

 PDF
PDF ePub
ePub Citation
 Print
Print


Introduction
Myotonic dystrophy type 1 (MyD1) is an autosomal dominant genetic muscle disease caused by the unstable expansion of CTG repeats in DMPK, the gene that encodes myotonic dystrophy protein kinase on chromosome 19.1,2 MyD1 has various extramuscular manifestations including cataracts, frontal baldness, cardiac conduction defects, and endocrine abnormalities.2
The primary involvement of the peripheral nerves in MyD1 is controversial. Several studies have indicated that peripheral neuropathy (PN) is an extramuscular manifestation of MyD1,3-5 whereas others suggest that certain PNs or peripheral nerve abnormalities are a secondary complication caused by diabetes mellitus (DM) or drug side effects.6-8 PN commonly appears during the advanced stage of MyD1, when glucose metabolism is significantly impaired;9,10 thus, it is difficult to determine the role of DM in the development of PN in MyD1. To differentiate between these potential causative factors, PN must be evaluated during the early stage of MyD1, when glucose metabolism is normal. The presence of overt PN or peripheral nerve dysfunction in this stage would indicate primary peri-pheral nerve involvement in MyD1. The conventional nerve conduction study (NCS) that is widely used to diagnose PN has a limited ability to detect abnormalities, particularly in the early stages of PN,11,12 and it provides little information concerning the pathophysiology.
The aim of the present study was to determine whether PN is a primary manifestation of MyD1 or a secondary complication of DM. To accomplish this, we used the automated nerve excitability test (NET) to compare the pattern of nerve excitability properties in patients with MyD1 and normal glucose me-tabolism and NCS findings, with that in patients with DM and normal NCS findings.
Methods
Subjects
The subjects were 12 MyD1 patients who visited the Inje University Busan Paik Hospital, Department of Neurology between April 2009 and May 2010. All of the patients were carefully evaluated by an experienced neurologist and showed clinical and electromyographic evidence of myotonia with myopathy. Unstable CTG gene expansions in DMPK were identified from peripheral blood samples. Patients who had a metabolic or nutritional disease that might cause PN, suspected radiculopathy, or entrapment neuropathy were excluded. Twelve patients with DM and normal conventional NCS findings were included as early-disease or subclinical PN controls. We also analyzed the data of 25 age- and sex-matched healthy volunteers as a normal control group. All subjects gave their informed consent to participate, and the study was approved by the ethics committee of Inje University College of Medicine.
All patients underwent a routine blood examination, which included complete blood count, liver function test, renal function test, thyroid function test, and lipid battery. If a patient's random glucose concentration was at the upper limit of the normal range, an oral glucose tolerance test was performed in accordance with the recommendations of the American Diabetes Association.
Automated NET
The NET was performed using a computerized program (QT-RACS with multiple excitability protocol TRONDF; copyright, Prof. Hugh Bostock, Institute of Neurology, London, UK). Compound muscle action potentials (CMAPs) were recorded from the right abductor pollicis brevis muscle after stimulation of the median nerve at the wrist (3 cm proximal to the wrist crease). Skin temperature was measured near the stimulation site and maintained above 31.5℃. The protocols examining stimulus-response curves used durations of 0.2 and 1.0 ms. The strength-duration time constant (SDTC) was determined using Weiss's equation to plot threshold charge ag-ainst stimulation duration. SDTC is given as the (negative) in-tercept on the duration axis.13,14
For the following measurements, the current required to produce a CMAP that was 40% of the maximum was tracked. In the threshold electrotonus (TE) studies, the membrane potential was altered by applying subthreshold DC polarizing currents that were 40% of the unconditioned threshold. Depolarizing and hyperpolarizing currents were used, each lasting 100 ms, and their effect on the threshold current for the test CMAP was examined. In a further test with subthreshold conditioning currents, the test stimulus was delivered at the end of a polarizing current pulse lasting 200 ms. The intensity of the current pulse was changed systematically from 50% depolarizing (TEd) to 100% hyperpolarizing (TEh) in 10% increments. This produced a current-threshold relationship (CTR) analogous to a conventional current-voltage relationship. The recovery cycle (RC) of axonal excitability after a single supramaximal stimulus was measured by delivering the test stimulus at different intervals after the conditioning stimulus. The conditioning-test intervals were systematically changed from 2 to 200 ms.
Statistical analyses
The statistical analyses were carried out using SPSS v10.0 for Windows (SPSS, Chicago, IL, USA). The Mann-Whitney U-test was used to compare continuous variables, and the chi-squared test was used to compare categorical variables. Spearman's rank correlation was used to determine the correlation between two independent continuous variables. The level of statistical significance was deemed to be p<0.05. Data are presented as mean±SEM values.
Results
Patient characteristics
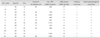
The characteristics of the patients with MyD1 are summarized in Table 1. No patient had radiculopathy or precipitating factors for PN such as metabolic or nutritional factors, drugs, toxins, or trauma. The clinical and laboratory evaluations indicated that no patient had overt DM or impaired glucose tolerance. The patients with DM had normal conventional NCS results and were rated as N0 according to Dyck's diabetic neuropathy staging.15 No significant age, sex, or height difference was found among the groups (MyD1: n=12, age range 17-54 years, mean age 35.8 years; DM: n=12, age range 31-56 years, mean age 38.8 years; control group: n=25, age range 26-54 years, mean age 37.0 years).
Multiple excitability measurements
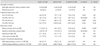
The multiple excitability measurements are listed in Table 2. The CMAP amplitude was significantly lower in the MyD1 group than in the DM and normal control groups (MyD1, 5.4±0.9 mV; DM, 9.4±0.7 mV; normal control, 9.7±0.6 mV; p=0.0002). All of the other NCS parameters were normal in all of the groups. The rheobase tended to be higher in the MyD1 group, but the difference did not reach statistical significance. The mean SDTC of the MyD1 and DM groups was within the range of the normal controls.
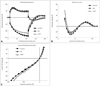
The TEd (10-20 ms), TEh (10-20 ms), and TEh (90-100 ms) were significantly lower in the MyD1 group than in the control group. When compared with the DM group, the patients with MyD1 had a significantly lower TEh (10-20 ms) and TEh (90-100 ms) and exhibited a tendency toward a lower TEd (10-20 ms). A tendency toward a difference among groups in TEd (90-100 ms) was also observed, but the difference did not reach statistical significance (p=0.05). These results gave the MyD1 group a "fanned-in" TE appearance compared with the control and DM groups (Fig. 1A).
The refractoriness of the axonal excitability RC was significantly greater in the MyD1 group (at 2.5 ms) than in the control group, and the MyD1 relative refractory period tended to be longer. In addition, the MyD1 group exhibited significantly greater refractoriness at 2.5 ms and subnormality compared with the DM group (Fig. 1B). The CTR comparison revealed that threshold changes in response to the 50% depolarizing current were similar in the MyD1 and control groups; however, threshold changes to the 100% hyperpolarizing current were significantly smaller for the MyD1 group than for the control group.
No significant differences were found between the DM and control groups with regard to the excitability indices, with the exception of supernormality (p=0.04). Furthermore, no significant correlation was found between the length of the CTG expansion and any multiple excitability parameters in the patients with MyD1.
In summary, the MyD1 group exhibited abnormalities in axonal excitability parameters including the "fanned-in" pheno-menon in TE and increased refractoriness and relative refractory period duration. Although not all of the differences between the MyD1 and DM groups reached statistical significance, many of the excitability properties exhibited a tendency toward significance. Furthermore, with the exception of super-normality, the DM and control groups exhibited a similar pattern of excitability properties.
Discussion
Our results demonstrate that the change in peripheral axonal excitability is more pronounced in patients who have MyD1 but not DM than in those who have DM with no PN and than in healthy controls. The MyD1 group exhibited a "fanned-in" phenomenon in TE, and an increased refractoriness and relative refractory period duration. The change in excitability properties did not differ significantly between the DM and control groups. However, the absolute values of excitability indices and the mean response curve suggested that the DM group was at an intermediate state between the MyD1 and control groups. Moreover, the data from the MyD1 and DM groups exhibited a tendency toward statistical significance for several the excitability properties.
The nerve excitability properties in patients with MyD1 were previously evaluated by Krishnan et al.16 Our results for patients with MyD1 compared with healthy controls are similar to those of Krishnan et al. except that our patients exhibited a tendency toward an increased rheobase. Thus, our study confirmed a characteristic pattern of peripheral nerve abnormality in MyD1: depolarized axonal membrane potential, impaired nodal voltage-gated transient Na+ channel function, and an increase in the axon excitation threshold, although these results did not reach statistical significance.
Controversy exists regarding the etiology of PN in MyD1. PN is reported to be present in 20-30% of patients with MyD1.17-20 It has been suggested that PN is an axonal neuropathy in MyD1 that tends to progress in a stepwise fashion, irrespective of the clinical severity of the myopathy.19 Although age, disease duration, and the clinical severity of the MyD1 are considered to be associative factors for the presence of PN in MyD1,9,10 clinicians do not agree on the underlying cause of PN. Furthermore, controversy continues over whether PN is a primary effect of MyD1 or a secondary complication of DM or drug side effects.6,10 DM commonly causes PN and is itself a frequent endocrinological complication of MyD1; thus, diabetic PN could be secondary manifestation.
Conventional NCS is commonly used to diagnose PN, despite problems with diagnostic sensitivity, the lack of pathophysiological information, and the possibility that it may result in a false-negative diagnosis, particularly in the early stages when changes to the nerve are minimal.11,12 Thus, NCS may not detect mild or early PN and may indicate a normal result when subclinical PN is present in patients with either MyD1 or DM.
The recently developed NET, which uses the threshold-tracking technique, can provide insight into the ionic mechanisms underlying the pathophysiology of axonal dysfunction in PN and motor neuron disease. This technique assesses nerve excitability properties and can analyze clinical features and positive neuromuscular symptoms that are not detected by conventional NCS.21 Moreover, the technique can measure discrete changes in peripheral nerve axon excitability and has been used to identify a distinct pattern of altered excitability properties in diabetic PN.22-24
Krishnan et al.16 demonstrated abnormal peripheral nerve excitability in patients with MyD1; the findings of the present study confirm their results. The etiology of this abnormal peripheral nerve activity is not known. Krishnan et al. noted that despite a clinical assessment showing no DM or glucose intolerance in their patients, it was possible that some had a subclinical alteration in glucose metabolism. Our study, which was designed to identify the mechanism underlying PN in MyD1, compared patients with MyD1 and early PN, and those with DM and no PN. Our finding of a significant difference in peripheral nerve activity in the MyD1 compared with the DM and normal control groups suggests that PN is a primary effect of MyD1 rather than a secondary complication of DM.
The present study had some limitations. It performed a cross-sectional comparison between the electrophysiological data produced by automated NET and NCS; we did not evaluate pathological findings or autonomic nerve function, particularly in the DM group. As such, our conclusions stem from a neurophysiological perspective rather than from functional evidence. It is known that small-fiber sensory or autonomic fibers are the initial target of pathological changes in DM. However, like conventional NCS, NET reflects only large, myelinated, fast-conducting fibers. Furthermore, the number of patients in the study was small, which may have limited the statistical power of our analyses; however, patients who have early MyD1 and uncomplicated DM with a normal NCS are scarce. Future work should involve a more precise evaluation of the overall status of the disease and larger patient numbers.
 XML Download