

 PDF
PDF ePub
ePub Citation
 Print
Print


Introduction
Incidence, mortality, and prevalence have traditionally been employed to measure the societal burden of disease. Incidence and prevalence measures can indicate disease quantity but fail to capture disease severity or intensity. Mortality can partially indicate disease severity but cannot incorporate nonfatal health conditions that disable human beings for their residual life. Moreover, the epidemiological transition from infectious and nutritional diseases to chronic and degenerative diseases has called for a paradigm shift in measuring disease burden to incorporate disability.
In 1992, the World Health Organization (WHO), the World Bank, and Harvard School of Public Health cooperated to develop a new metric of disability-adjusted life years (DALY) to quantify the burden of disease and injury on human beings for the Global Burden of Disease Project (GBDP).1,2 The DALY is a time-based measure of health status that incorporates both disability and mortality. Employing the time lost as a common, universal measurement unit enables a comparison of relative burdens of diverse health conditions and guides health-system planning.
To integrate disability into disease burden, the WHO-GBDP developed a concept of disability weight (DW) to rate nonfatal health conditions. The DW is a weighting factor that reflects the severity of the disease on a scale from 0 (perfect health) to 1 (equivalent to death).1,3 Using the person-trade-off method, healthcare professionals who participated in the WHO-GBDP judged each health status from a broad health perspective, ensuring equity across various health conditions, and determined DWs for more than 400 health conditions. Using DWs and po-pulation-level data of incidence, prevalence, and fatality, the WHO-GBDP has measured the burden of hundreds of diseases and injuries globally and regionally in a metric of DALY. The DALY has also been applied to a cost-effective analysis of an interventional efficacy on a population level.4,5 However, since it was not possible to directly calculate DALY lost to a disease in an individual patient, the application of DALY has been limited to population-level data analyses.
Previously, only a unified DW was available for chronic poststroke states, despite its wide range of disability.3 Formally derived fine-grained DWs for each modified Rankin Scale (mRS) disability level are now available.6 In addition, a novel methodology enables the estimation of the life expectancies of stroke survivors based on their age, gender and mRS disability levels.7,8 As a result, it is possible to derive individual pati-ents' DALY lost to stroke, and the DALY application has been expanded to diverse stroke research areas.
This review discusses the DALY concept and its applications to acute stroke trials, secondary prevention trials, registry-based outcome research, and a new approach to estimate a nationwide stroke burden.
The DALY concept and derivation
DALY lost is the sum of years of life lost due to premature death (YLL) and years of healthy life lost due to disability (YLD): DALY=YLL+YLD.1 One DALY lost indicates 1 year lost of healthy life. Conceptually, since the YLL is the loss of life years due to premature death caused by a fatal disease or disability impact, the YLL of a stroke patient who dies at age A is equal to a life expectancy of general population at age A. For living with a DW [range from 0 (normal health without disability) to 1 (equivalent to death)] for Ld years, YLD=(DW)×Ld. Living for Ld years without disability (DW=0) would be a YLD of 0. As an example, a 60-year-old man has a stroke, lives for 10 years with a DW of 0.4, and the life expectancy of general population at age 70 years is 12 years, then his YLL=12, YLD=4 (=0.4×10), and the DALY lost=16. Based on egalitarian principles, the WHO-GBDP applies the same DW to a specific health condition irrespective of the individual's race, gender, occupation, and socioeconomic status.
Age-weighting and future discount
Public health policy modeling usually employs age-weighting and future discount rate, and the WHO-GBDP also employs these two modeling assumptions in their DALY estimations. The age-weighting is to assign different values to different life years: higher in young adult ages than in infancy and elderly. The higher valuation of young adult life years well reflects the public's choice when only one patient can be treated in a hypothetical situation. The public's decision might be implicitly made based on each individual's life expectancy, productivity, and contribution to the well-being of others.1
The future discount is to discount the value of future healthy life years at present, reflecting that the public values 1 year of healthy life in the future less than 1 year of immediate present. The future discount is based on several concepts. At the simplest level of an economic concept, most individuals prefer present benefits rather than future benefits. At a more complex level of the health concept, the uncertainty of survival in the future that increases with increasing ages necessitates the future discount.
By incorporating age-weighting and future discount, YLL, YLD, and DALY are calculated using the following formula:1
DALY[r, K]=YLL[r, K]+YLD[r, K]
YLL[r, K]=KCerA/(r+β)2{e-(r+β)(L+A)[-(r+β)(L+A)-1]-e-(r+β)A[-(r+β)A-1]}+[(1-K)/r](1-e-rL)
YLD[r, K]=DKCerAs/(r+β)2{e-(r+β)(Ld+As)[-(r+β)(Ld+As)-1]-e-(r+β)As[-(r+β)As-1]}+[(1-K)/r](1-e-rLd)
where K is the age-weighting modulation factor (K=1), β is the parameter for the age-weighting function (β=0.04), r is the discount rate (r=0.03), C is a constant (C=0.1658), A is the age of death, L is the life expectancy of the general population at age A, D is the disability weight, As is the age at stroke, Ld is the duration of disability with a mRS X state (=life expectancy of a stroke patient with a disability of mRS X at age As). Note that the WHO-GBDP employs an annual 3% discount rate (r=0.03) for future discount; when age weighting is considered, this gives K=1 and β=0.04.1
DW for each mRS disability rank
Poststroke disability spans a wide spectrum. Previously, the WHO-GBDP has provided only two DWs for stroke, 0.920 for acute stroke and 0.266 for chronic poststroke states.3 Since most contemporary stroke research employs the mRS as an outcome measure, the generation of a DW for each mRS disability level would be the first step to enable the application of DALY to diverse stroke research.
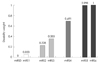
A recent study has determined the DWs for individual mRS levels,6 using person-trade-off methodology, which is the standard technique employed by the WHO-GBDP.1 Multinational stroke neurologists participating in that study were asked to assume that they were allocating health system resources and to decide what number would make them indifferent between the choices of extending the lives of 1,000 healthy people for 1 year versus extending the lives of N stroke survivors with a disability of mRS X for 1 year. Using the modified Delphi process, the value of N for each mRS was generated after achieving a substantial consensus. The DW for each mRS was derived by converting the value of N using the formula: DW=1-1,000/N. Finally, the derived DWs were normalized to the WHO-GBDP unitary chronic DW of 0.266 to ensure comparability of the newly derived DWs to the DWs of other health conditions. As a result, the adjusted DW of each mRS was determined as 0, 0.053, 0.228, 0.353, 0.691, 0.998, and 1 for mRS 0-6, respectively. The DW for each mRS confirms that the mRS is not a continuous, equally spaced scale, but rather a rank-ordered, unequally spaced scale. Consonant with the perception of stroke experts, the mRS ranks can be subcategorized into four groups based on the DWs: mRS 0-1 as no or minimal disability, (DW range 0-0.053), mRS 2-3 as mild to moderate disability (DW range 0.228-0.353), mRS 4 as severe disability (DW of 0.691), mRS 5-6 as extreme disability or death (DW range 0.998-1) (Fig. 1).
Estimation of life expectancy for individual stroke survivors
To calculate the DALY lost for individual stroke survivors, each patient's life expectancy needs to be estimated. Recent studies have demonstrated that long-term life expectancy decreases monotonically as the mRS level increases.9,10 From the data of these studies, we derived mortality hazard ratios for each mRS status relative to the general population.7 Then, by multiplying the mRS-specific mortality HR and age-specific mortality rates of the general population provided in life tables, we generated stroke survivors' age-specific mortality rates and life tables for each gender and mRS state. From the stroke survivors' life tables, the life expectancy for each stroke survivor can be determined based on their age, gender and mRS state. As a result, this novel technique enables the calculation of DALY lost for each patient and to apply the DALY metric to individual patient-level data analyses.
Acute stroke trial
To demonstrate the application of DALY to individual-patient data analysis in acute stroke trials, we reanalyzed the National Institute of Neurological Disorders and Stroke Tissue Plasminogen Activator trials. That study demonstrated that intravenous TPA therapy administered within 3 hours saves on average 1.28 healthy life years, and 4.4 healthy life years for patients who benefit from the treatment.7
The DALY analysis has several advantages over conventional analyses. The DALY value indicates the saving of healthy life years conferred by a treatment, and is therefore more understandable for the layperson. Acute stroke trials usually employ stroke specific functional outcome scales (i.e., mRS outcome scale). These are familiar to stroke experts, but unfami-liar to the layperson. Therefore, when findings are provided in an mRS analysis, public and health-policy decision-makers have difficulty interpreting the results of acute stroke trials and deciding upon health policies and treatment choice. In addition, the DALY metric allows physicians to communicate treatment effect tailored to individual patients. For example, suppose that a 50-year-old Korean man with a severe ischemic stroke is expected to be bedridden (mRS 5) without successful reperfusion therapy, his DALY lost would be 16.77. If this patient had successful reperfusion therapy and a disability of mRS 1, the DALY lost would be 3.13 and the treatment could confer 13.64 years of healthy life.
The DALY is a continuous interval scale. In general, continuous scales are more advantageous in statistical power detecting treatment effect than ordinal scales. In acute stroke trials, the mRS has been the most widely employed outcome scale. Since the mRS is an ordinal scale, conventional analytic techniques have employed mRS dichotomization using an cutoff point. The usual cutoff points are mRS 0-1 or mRS 0-2 which indicate excellent or good outcomes, respectively. While the dichotomized mRS analysis has the advantage of simple clinical interpretation for stroke experts, it collapses distinct mRS levels into only two outcome categories and inevitably discards the original, detailed mRS outcome information. In addition, determination of the cutoff point is somewhat arbitrary, and a negative trial might be attributable to selecting an inappropriate cutoff point rather than inefficacy of a treatment tested. The ECASS (European Cooperative Acute Stroke Study) II that tested intravenous TPA efficacy would have yielded a positive result if mRS 0-2 had been selected as a primary endpoint.11 In contrast, the Japanese MELT (Middle Cerebral Artery Embolism Local Fibrinolytic Intervention) trial that tested intra-arterial thrombolysis would have yielded a positive result if the mRS 0-1 had been a primary endpoint.12 The greater statistical power of the continuous DALY metric over conventional mRS dichotomization analysis has been well demonstrated in the age subgroup analysis of the National Institute of Neurological Disorders and Stroke Tissue Plasminogen Activator trials, in which the TPA effect for the aged 70 years or more was consistently significant with DALY analyses but not with dichotomized analyses.7
Finally, conventional stroke outcome scales are one-time, snapshot metrics and implicitly index the burden of disability for patients' remaining life. In contrast, the DALY metric explicitly indicates this burden by directly measuring the life years lost due to disability for their remaining life. Standard measures value the severe disability states of young and very elderly stroke patients equally, which is at variance with the public's perception. However, the DALY metric can discriminate the poststroke burdens among various age groups by reflecting the differential duration of disability.
Complication impact on stroke outcome
Organized stroke care provides clear benefits but requires additional human and structural resources. The benefits of organized stroke care are partially attributable to reducing poststroke complications that increase disability and mortality.13-15 To guide a transparent and scientific decision in allocating resources to competing health interventions, stroke experts must delineate for public and health policy decision-makers the impact of poststroke complications with a validated common metric that ensures comparability across diverse health conditions.
To date, the adverse impact of poststroke complications has been delineated based on the increased risk of mortality or poor outcome measured by stroke-specific outcome scales. The mortality measure allows poststroke complications to be compared with other health conditions, but does not fully reflect the impact of complications that increase both disability and mortality. In contrast, analysis with stroke-specific outcome scales can reflect the increased disability due to complications, but does not ensure its comparability to other health conditions. In contrast, the DALY metric could incorporate both disability and mortality, and ensures comparability since it is a universal, time-based metric.
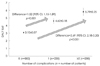
We previously analyzed stroke registry data that prospectively captured individual-patient mRS outcomes and complications, and demonstrated that poststroke complications deprive patients of approximately 2 years of healthy life. In addi-tion, a greater number of complications lead to a greater loss of healthy life years: 1.52 additional DALY lost with one complication and 2.69 DALY lost with two or more complications (Fig. 2).8
The DALY metric allows stroke experts to describe an interventional benefit in a more understandable manner. A previous study found that pneumonia developed in about 12% of patients and led to about 2-years of healthy life lost.8 Another study demonstrated that formal dysphagia screening and management could reduce of the incidence of pneumonia by 50%.16 Given the annual incidence of 100,000 strokes in Korea,17 a nationwide implementation of dysphagia screening could annually save 12,000 (=100,000×2 years×0.06) healthy life years in Korea.
Weighting of vascular endpoints in prevention trials
In vascular prevention trials, the usual primary endpoint is the composite of nonfatal stroke, nonfatal myocardial infarction (MI), and vascular death. The composite endpoint analysis has advantages since it integrates the treatment impact on diverse organs and increases the statistical power by increasing the number of vascular events. However, a well-recognized limitation is the equal weighting of all vascular events regardless of their differential impacts on a patient's life. The debates regarding the findings of the Carotid Revascularization Endarterectomy versus Stenting Trial clearly reflect the weakness of this equal weighting. That trial concluded that endarterectomy and stenting are equally effective. However, the stenting group had a higher risk of stroke, while the endarterectomy group had a higher risk of MI. Quality-of-life analyses among survivors of the Carotid Revascularization Endarterectomy versus Stenting Trial trial at 1 year demonstrated that stroke had a greater adverse effect on a broad range of health-status domains than did myocardial infarction.18 Thus, interpreting trial results might require differential weighting analysis adjusted for health states, but a widely accepted weighting method does not currently exist.
The DALY metric is well suited to assigning differential weight to disparate vascular events. Reflecting differential disability of and life expectancy after each event, the DALY method can convert hundreds of health conditions into a uniform, patient-centered metric of healthy life years lost. The differences in DW and life expectancy between stroke and MI survivors have been well recognized. The Framingham study showed that at age 60 years, the life expectancies for stroke and MI survivors are 8.9 years (men and women combined) and 11.2 years, respectively.19 For the DW generated in our previous study, the DW of chronic poststroke state (0.266) was about seven times higher than that of the chronic post-MI state (0.037).20
The DW for chronic poststroke state has previously been determined by the WHO-GBDP. The WHO-GBDP did not provide a unified DW for the chronic post-MI state, but did provide specific DWs for the two major disabling MI sequelae: 0.201 for congestive heart failure (CHF) and 0.124 for angina pectoris (AP). These conditions occur in only a subset of post-MI patients: 19.8% for AP and 16.9% for CHF.21,22 Furthermore, among those with post-MI angina, angina attacks occurs daily in only 1.2% of patients, weekly in 3.0% (angina symptom per 2-7 days: 81.1 days/year), and less than 1 day/week for 4 weeks in 15.6% (angina attack per 8-28 days: 20.3 days/year).21 Since the WHO-GBDP DWs were originally derived under the assumption of chronic and persistent symptoms and signs,1 we determined the unified DW for the chronic post-MI state after taking into account these proportions and frequencies for angina symptom occurrence using the following formula:20
DWMI=(PCHF×DensityCHF×DWCHF)+(PAP×DensityAP×DWAP),
where PCHF or AP is proportion of MI survivors experiencing CHF or AP, DensityCHF or AP is the number of days per year that these individuals experience symptoms of CHF or AP (days divided by 365 days). DensityCHF or AP is calculated using the following formula:
DensityAP=[(frequency of daily angina/19.8)×(days of symtom/365)]+[(frequency of weekly angina/19.8)×(days of symtom/365)]+[(frequency of angina attack less than one day per 4 weeks/19.8)×(days of symtom/365)]=0.14. DensityCHF was determined to be 1.0 under the assumption of daily symptoms or disability in daily activities.
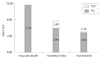
By applying the projected life expectancies, expected age at death, and DWs to the DALY calculation formula, we derived that the DALY lost for those aged 60 years was 11.59 for vascular death (YLD=0 and YLL=11.59), 7.63 for nonfatal stroke (YLD=1.69 and YLL=5.94), and 5.14 for nonfatal MI (YLD= 0.28 and YLL=4.86) (Fig. 3). Our formal analysis indicated that compared with a nonfatal MI, the DALY lost is 1.48-fold greater for a nonfatal stroke and 2.25-fold greater for a vascular death. Moreover, reflecting the differential DW between chronic poststroke and chronic poststroke MI states, the DALY analysis could demonstrate the discrete contribution of YLD to total DALY lost between the two states: 22.1% for nonfatal stroke and 5.4% for nonfatal MI. Consonant with the perception of experts, this DALY analysis clearly demonstrates that the DALY lost due to MI survivors is overwhelmingly determined by premature mortality rather than MI-related disability, while the stroke-related disability contributes more than 20% to overall healthy life years lost.
Nationwide stroke burden measure
The DALY was originally developed to measure disease burden both globally and regionally. To date, the stroke DALY burden in a population has been projected from the incidence, prevalence, fatality, mortality, and a unified DW for overall stroke. Some unavailable epidemiologic data were derived from the DisMod method or projected from data of comparable populations.23 Since the stroke care system and the characteristics of patients vary across diverse populations, the average poststroke disability level is likely to differ between such populations. Therefore, population-specific poststroke disability levels and incidence data might more finely project stroke burden in a particular population.
For this purpose, we derived for Korean ischemic stroke patients the average DALYs lost specific for age groups from the data of two large Korean ischemic stroke registries that prospectively captured the 3-month mRS outcomes of all consecutive patients.24 The incidences of ischemic stroke in various age groups were obtained from the 2006 report of Construction of National Surveillance System for Cardiovascular and Cerebrovascular Diseases.17 The nationwide DALY lost for each age group was generated by multiplying the average DALY lost and incidence for each group: 9,952 for those aged ≤44 years, 24,608 for 45-54 years, 50,682 for 55-64 years, 88,875 for 65-74 years, 18,118 for 75-84 years, and 4,735 for ≥85 years. Accordingly, the annual burden due to 64,688 ischemic strokes in 2004 was estimated to be 234,399 DALY lost. The group of those aged 65-74 years ranked in the first place.24
By integrating the DALY values from stroke registries capturing detailed individual-patient information and the incidence from a nationwide database, we obtained a more refined DALY burden due to ischemic stroke that will help to guide health policy planning. More than 230,000 healthy life years were lost annually to ischemic stroke in Korea. To reduce the stroke burden, the first target population would be those aged 65-74 years who contribute the greatest burden to the total DALY lost for ischemic stroke (almost 40%).
Conclusion
The DALY approach has a strong methodological framework and a firm theoretical grounding. It has been widely accepted by public health experts and employed to measure the global and regional burdens of disease. Recent advances in the stroke field expand the application of DALY metric to analyzing acute stroke trials, delineating complication impacts, differential weighting for disparate vascular events, and estimating stroke burden in a specific population. Like stroke, most neurological disorders torment human being by imposing both disability and mortality. Therefore, the DALY might be widely applicable not only to stroke but also to other disabling neurological disorders.
 XML Download