

 PDF
PDF ePub
ePub Citation
 Print
Print


Introduction
The clinical manifestations of hypoglycemic encephalopathy (HE) range from mental change and focal neurological deficits to coma or death.1 HE lesions are found in the cerebral cortex, basal ganglia, hippocampus, splenium, and bilateral internal capsule.2-5 Although hypoglycemia results in neuronal injury, the reason for the selective vulnerability of different brain regions remains unknown. We describe herein a case of unilateral HE that occurred in the right internal capsule, right frontal subcortical white matter (WM), as seen on diffusion-weighted images (DWI). Our patient had a preexisting stroke in the left cortical and subcortical regions, which was considered to have occurred perinatally. To elucidate the mechanism underlying unilateral HE occurrence, we performed diffusion-tensor imaging (DTI) and single positron-emission tomography (SPECT).
Case Report
A 72-year-old left-handed woman was admitted to our hospital because of altered mentality. She had a 10-year history of treatment with hypoglycemic agents for diabetes mellitus. Her initial serum blood glucose was 29 mg/dL. The results of other tests, including a complete blood count, blood chemistry, arterial blood gas analysis, and a drug screen, were normal.
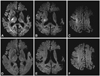
The patient immediately returned to an alert state after the intravenous infusion of 50% dextrose. However, she showed motor aphasia and motor weakness in her left extremities. DWI using a 1.5-T magnetic resonance (MR) scanner (Gyroscan, Philips, Best, The Netherlands) was performed to identify the brain lesion. DWI showed high signals in the patient's right frontal subcortical WM and right internal capsule, with a corresponding reduction of the apparent diffusion coefficient (ADC) and the preexisting lesion, which was manifest as tissue loss in the territory of the left middle cerebral artery (Fig. 1A-C). MR angiography did not reveal any stenotic lesion in the intracranial vessels. After 24 hours, the patient had completely recovered from the aphasia and motor weakness, except for a limping gait of the right leg. Follow-up imaging at that time revealed complete resolution of the hyperintensity on DWI, with normalization of the ADC values (Fig. 1D-F).
An interview with the patient revealed that she had suffered from a right-side limping gait since she was a toddler. The patient indicated that her language, motor skills, and gait development were delayed, although she eventually caught up with her peers.
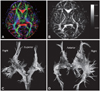
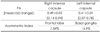
One week after the dextrose infusion, DTI was performed to evaluate WM properties using the following parameters: voxel size, 1.88×1.88×2.3 mm3; TE/TR=72/7,296 ms, SENSE factor=2; and b=600 s/mm2 in 15 directions. DTI-Studio software (Radiology, Johns Hopkins University, Maryland, USA) was used to calculate fractional anisotropy (FA) and to reconstruct the three-dimensional tractography.6 Two regions of interest (ROIs) of internal capsules were manually traced five times to obtain mean FA values (Fig. 2B). The mean FA value of the right internal capsule was higher than that of the left (Table 1), and the integrity and amount of WM in the right internal capsule was greater than that in the left (Fig. 2A, C and D).
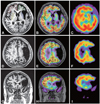
Two months later, 99mTc-hexamethylpropylene amine oxime (99mTc-HMPAO) was injected intravenously for SPECT studies, which were performed using a dual-head gamma camera (E-cam, Siemens Medical Systems, Hoffman Estates, IL, USA) equipped with low-energy and high-resolution collimators. The transaxial system resolution of this camera is 9.1 mm full width at half maximum. Images were reconstructed using Butterworth-filter back-projection. Attenuation correction was performed using Chang's method (attenuation coefficient=0.12 cm-1).7 SPECT was coregistered to T1 MR imaging (MRI) using SPM2 (Wellcome Department of Cognitive Neurology, Institute of Neurology, University College London, London, UK).8 The four ROIs of the prefrontal lobes and basal ganglia were manually traced on T1 MRI, then overlaid on transformed SPECT to extract regional cerebral blood flow (rCBF) values. The asymmetric index was calculated by dividing the difference between the ROI counts by the sum of the ROI counts, as follows: [(left ROI-right ROI)/(left ROI+right ROI)/2×100] (Fig. 3A and C). The rCBF in the prefrontal areas and basal ganglia in the right hemisphere was greater than in the left (Fig. 3), and the values of the asymmetric index demonstrated different tracer uptake patterns between the two sides (Table 1).
Discussion
A few cases of hypoglycemic hemiplegia have been reported.9 Our patient exhibited distinct features including lateralization of HE and an underlying preexisting brain lesion on the opposite side. Neurochemical changes from hypoglycemia include an arrest of protein synthesis, energy failure, loss of ion homeostasis, cellular calcium influx, intracellular alkalosis, and release of neuroactive amino acids into the extracellular space. The cerebellum and brainstem are less vulnerable to hypoglycemia because of their greater glucose transporter efficiency.10 However, in our patient, the entire left hemisphere was spared from the hypoglycemic event, which cannot be attributed to the same mechanism underlying the observations in the cerebellum and brainstem.
We propose three possible explanations: 1) a metabolic mechanism, whereby there is a difference in the metabolic demand between the hemispheres as a result of the preexisting stroke; 2) a structural mechanism, where because of the different neuronal compositions between the hemispheres, the denser side might be more vulnerable to the cytotoxic edema resulting from hypoglycemia; and 3) a pseudo effect on imaging, where although HE equally affected both sides, the sum of the cellular changes in the left side was not sufficient to be detected by DWI because of its less dense neuronal composition. We describe these mechanisms in detail below.
Brain reorganization would have contributed to the functional recovery from the old brain lesion.11,12 Hemispheric function shift to the undamaged nondominant hemisphere after a dominant hemisphere insult has been confirmed by functional imaging studies.13 In addition, there is evidence of motor system plasticity in the developing brain.14 This could explain why the patient exhibited aphasia as a neurologic deficit.
Our SPECT findings indicate that the prefrontal regions and basal ganglia of the left hemisphere that were spared from stoke had a relatively lower uptake of 99mTc-HMPAO than the corresponding areas in the right hemisphere, which suggests that the cerebral blood perfusion is more vulnerable in the left hemisphere than in the right hemisphere. However, the patient exhibited HE in the right hemisphere, and hence we assume that regional hypometabolism or brain atrophy resulted in hypoactive left hemisphere tracer uptake patterns in our patient,15 and that this condition decreased the rate of glucose consumption in the left hemisphere, enabling it to endure the HE insult. The lower FA and reduced number of left internal capsule fibers might also explain why glucose consumption was lower in the left hemisphere than in the right hemisphere, because integrated outputs between neurons descend through that pathway. It has been shown that various factors, including the axonal membrane, the number and thickness of axons, tissue hydration, cell packing density, and the intravoxel directional coherence of the fibers influence FA.11 Previous studies have also shown that the marked gliosis and microscopic changes that occur following brain insult result in a reduction in FA, while the increased density of fibers occurs with alternation of the microstructure of surrounding the cellular matrix in unaffected brain sites.11,16 The reduced number of descending fibers, relatively lower FA, and scanty configuration of the tractography might reflect a relatively lower number of synapses between neurons in the left hemisphere, although these findings might have an alternative explanation, which will be discussed below. Therefore, we assume that the difference in metabolism between the hemispheres could result from brain reorganization and the preexisting stroke, which contribute to the increased vulnerability of the right hemisphere to hypoglycemia.
A second explanation is that the more compact neuronal tissue might be more vulnerable to hypoglycemia. It is known that the myelin water content in the posterior limb of the internal capsule and splenium is heterogeneous, and cases of splenium injury with or without internal capsule involvement have been documented, although many etiologies are involved.17-20 By analogy with the hypothesis involving the splenium, hypoglycemia might also perturb cellular fluid mechanics in the posterior limb of the internal capsule, resulting in cytotoxic edema. In our patient, the restricted movement of intracellular free water caused by hypoglycemia might be greater in the right internal capsule with its more compact neuronal integrity. However, this assumption does not apply to other brain structures, such as the subcortical WM.
The third possibility is that although HE affected both sides equally, a relative loss of neuronal integration in the left hemisphere reduced the detected signal in DWI. However, this assumption does not favor the clinical manifestation because there was no aggravation of the preexistent motor weakness on the patient's left side.
Based on her past history, imaging findings, and clinical symptoms and signs, we assume that the preexisting lesion resulted in distortion and reorganization of cerebrum, including its regional structure and neuronal function, and that these aberrations changed the hemispheric metabolism or structure. We therefore conclude that the degree of metabolism required to maintain the function of brain structures and neuronal integrity might be an important factor determining the selective vulnerability associated with HE.
 XML Download