

 PDF
PDF ePub
ePub Citation
 Print
Print


Introduction
Transient global amnesia (TGA) is characterized by a sudden, transient memory disturbance with preserved alertness, attention, and personal identity.1,2 This memory disturbance usually resolves within 24 hours and has no long-term sequelae; recurrence rarely occurs.3 The clinical and neuropsychological spectrum of this syndrome has been characterized and several etiological factors, such as migraine, focal ischemia, venous flow abnormalities, and epileptic phenomena have been proposed.1,2 Several case reports using single-photon-emission computed tomography (SPECT) have shown transient and relative hypoperfusion of the temporal lobe during the acute phase of TGA.4-6 Several case reports using SPECT have shown hypoperfusion of the bilateral frontal cortex, thalamus, and hippocampus, and hyperperfusion of the cerebellum.7 More recently, diffusion-weighted magnetic resonance imaging (DWI) has revealed high-signal abnormalities in the hippocampus associated with TGA, thus providing strong evidence of ischemia as a causative event.4,6 Previous studies have reported that lesions in the medial temporal lobe are related to memory disturbance.5 However, no one has yet attempted to record eye movements during the acute and recovered phases of TGA and to correlate the findings with the functional brain imaging. The aims of this study were thus to characterize the findings of DWI and SPECT recorded during the acute and recovered phases of TGA and to correlate the findings with any observed oculomotor abnormalities.
Methods
Subjects
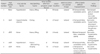
Five consecutive patients with a clinical diagnosis of TGA made at the emergency room of Seoul National University Bundang Hospital between January and June 2007 were enrolled into this study after excluding one patient in whom magnetic resonance imaging (MRI) was not performed within 1 day of symptom onset. The patients comprised four women and one man aged 50-69 years (mean=60.2 years; Table 1). All five patients underwent MRI including DWI between 4 and 22 hours (mean=12 hours) after symptom onset, and all fulfilled the following six diagnostic criteria of TGA proposed by Hodges and Warlow:1
1) The attack must be witnessed and information must be available from a capable observer who was present for most of the attacks.
2) There must be a clear-cut anterograde amnesia during the attack.
3) Clouding of consciousness and loss of personal identity must be absent and the cognitive impairment must be limited to amnesia.
4) There should be no accompanying focal neurological symptom during the attack and no significant neurological sign afterward.
5) Epileptic features must be absent.
6) Patients with a recent head injury or active epilepsy are excluded.
Neurological examination, brain SPECT and MRI, and recording of eye movements were performed during a TGA attack in all five patients. Neurological examination, SPECT and MRI were repeated 3 days later when the patients had recovered. The patients also underwent follow-up recording of eye movements 2 weeks after symptom onset.
MRI technique and analysis
MRI was conducted using a 1.5-T unit (Intera, Philips Medical Systems, Best, The Netherlands) with a sensitivity-encoding (SENSE) head coil, and head/neck synergy coil. Intervals from symptom onset to the initial MRI ranged from 4 to 22 hours (mean=12 hours). Patients initially underwent MRI using our stroke protocol, which comprised diffusion-, T1-, and T2-weighted, fluid-attenuated inversion-recovery, and conventional gradient-echo images in the transverse plane, three-dimensional time-of-flight angiography of the intracranial region, and contrast-enhanced angiography of the neck region. Subsequent diffusion- and T2-weighted imaging protocols in the coronal plane were performed perpendicular to the long axis of the hippocampus with thinner slices. The coronal T2-weighted imaging was performed using the fast spin-echo technique with the following parameters: matrix=256×256 interpolated to 512×512, field of view=200-220 mm, slice thickness=3 mm, TR=4,113 ms, TE=100 ms, echo-train length=24, SENSE factor=1, and number of acquisitions=3. DWI was initially performed in the transverse plane within 24 hours of TGA onset (mean=13 hours, range=4-22 hours), and then repeated 3 days later (mean=73 hours, range=71-75 hours) with four sequences: b=1,000 s/mm2 per 5-mm-thick slice, b=1,000 s/mm2 per 3-mm-thick slice, b=2,000 s/mm2 per 3-mm-thick slice, and b=3,000 s/mm2 per 3 mm-thick slice. These DWI sequences consisted of single-shot spin-echo planar imaging with the following parameters: matrix=128×128 interpolated to 256×256, field of view=220 mm, TR=5,000-12,500 ms (5,000 ms at b=1,000, 9,400 ms at b=2,000, 12,500 ms at b=3,000), TE= 60-75 ms, SENSE factor=2, and number of acquisitions=4.
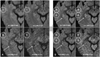
Rates of lesion detection on diffusion-weighted images were compared based on the consensus of three neuroradiologists. If the lesion was positive on DWI, lesion conspicuity was graded as + or ++ (Fig. 1).6 The locations of the lesions in the hippocampus (i.e., unilateral/bilateral and head/body/tail) were evaluated primarily based on transverse DWI. The hippocampal lesions were localized more specifically on thin-section, coronal, and diffusion- and T2-weighted images. Lesion locations were arbitrarily divided into lower-medial, lateral, and upper-medial regions. According to existing knowledge of hippocampal anatomy,6,11 CA1, the largest of the four hippocampal sectors (i.e., CA1-CA4), occupies the lateral curvature of the hippocampus. Therefore, the lower-medial region corresponds approximately to the subiculum, the lateral region to CA1, and the upper-medial region to the remaining sectors, which include CA2, CA3, CA4, and the dentate gyrus.
Oculography
All five patients also underwent three-dimensional recording of eye motion with video-oculography (SMI, Teltow, Germany), which had a resolution of 0.1° and a sampling rate of 60 Hz. Initial recording of eye movements was performed with an interval of 4.3±0.6 hours (mean±SD) from TGA onset. Digitized eye position data were analyzed using MATLAB software (Mathworks, USA).
Spontaneous nystagmus with or without fixation and gaze-evoked nystagmus were recorded in the horizontal (±30°) and vertical (±20°) planes. Positional nystagmus was observed during serial changes of the positions, which included sitting, lying down, turning of the head to both sides while supine, straight head hanging, and Hallpike maneuvers in both directions. Head-shaking nystagmus was induced using a passive head-shaking maneuver.
Saccades were generated by asking the patients to follow a target moving on a light bar with ranges of ±15.0° and ±30.0°. For each saccade, latency, accuracy, and peak velocity were computed and compared with the data from 50 normal controls. The saccadic latency in the normal controls was 217.5±20.0 ms, and when the value from the patients exceeded 257.5 ms (mean±2SD), the saccades were considered delayed. The saccadic gain was computed using the following equation: saccadic gain (%)=(amplitude of the initial saccade/target amplitude)×100; the normal range for saccadic gain was 93.1±4.4%. Hypermetric saccades in the five patients were defined when the mean saccadic gain was more than 101.9% (mean+2SD) or the frequency of hypermetric saccades exceeded 13.4% (mean+2SD in the normal controls). In contrast, hypometric saccades in the patients were determined when the mean saccadic gain was less than 84.3% (mean-2SD in the normal controls) or when the frequency of gaze shift with more than two corrective saccades exceeded 7.4% (mean+2SD). To determine any abnormality in horizontal saccadic velocity, normative data were obtained from 50 normal controls by performing fixed and random saccades. The peak velocities of 2,170 saccades (0.1-29.9°) were plotted versus saccadic amplitudes, and the 95% prediction interval was calculated using the following equation: peak velocity=Vmax×(1-e-Amplitude/C), where Vmax is the asymptotic peak velocity, and C is a constant that defines the exponential rise. Data were considered abnormal when they lay outside the 95% prediction curves.
The stimulus for smooth pursuit was a light target moving in a sinusoidal pattern at peak velocities of 10°/s and 20°/s. The amplitude of target motion was 20°. For gain, the peak eye velocity was compared with the peak target velocity after eliminating saccades. Then, average gain from the accepted cycles were then compared with the values from 50 age-matched controls. In younger normal controls (age=34.9±8.0 years, range=20-49 years), the smooth pursuit gain was 0.75±0.07 and 0.73±0.07 for peak target velocities of 10°/s and 20°/s, respectively. In older normal controls (age=60.3±6.7 years, range=51-73 years), the smooth pursuit gains were 0.69±0.11 and 0.64±0.13 for peak target velocities of 10 and 20°/s, respectively. Impaired smooth pursuit was defined when the smooth pursuit gain in the patients was less than the mean-2SD of that in the age-matched normal controls at either peak target velocity.
Brain SPECT and statistical parametric mapping analysis
Brain SPECT was obtained in all patients with an average interval of 6.0±1.4 hours from the onset of TGA. SPECT images were obtained using a double-head gamma camera (ADAC Forte, Philips Medical, USA) with a low-energy, high-resolution collimator mounted on it. The subjects were injected with 30 mCi of 99mTc-ethylcysteine dimer under standard conditions of a dimly lit room with eyes closed and minimal background noise. Scanning was initiated 30 minutes after injection and data were acquired over 35 minutes. SPECT images were analyzed using statistical parametric mapping (Statistical Parametric Mapping; SPM99, Wellcome Department of Cognitive Neurology, Institute of Neurology, London, UK), and implemented using Matrix Laboratory 6.5. All of the images were spatially normalized into the standard templates supplied by SPM. To minimize individual anatomical variability and increase the signal-to-noise ratio, the normalized images were smoothed by convolution with an isotropic Gaussian kernel with 16-mm Full width at half maximum prior to statistical analyses. With regard to local cerebral blood flow, the whole-brain radiological quantity was normalized using a proportional coefficient. The images of the normal controls and patients were compared using ANOVA, as were those obtained during the acute and recovered phases. The control group comprised eight age-matched, healthy volunteers (five men; age=60.0±4.7 years, range=50-65 years) who were all dextromanual and free of current or previous neuropsychiatric disease.
Results
Clinical findings
The duration of the TGA attack was 8.2±2.9 hours. The attacks were induced by physical stress in four patients: two after heavy lifting, one during fervid singing in a choir, and one after strenuous dishwashing. One patient lost her memory after crying due to emotional stress. Three patients had vascular risk factors, two had hypertension, and one had hypercholesterolemia (Table 1).
MRI
In all of the patients, DWI disclosed small punctate (1-3 mm), high-signal lesions in the hippocampus; this was the only abnormal finding on MRI. All of the lesions were unilateral (three on the left and two on the right side) and all were also clearly demonstrated on both coronal diffusion- and T2-weighted images. The lesions were located in the lateral region of the hippocampus and were matched with small areas of low signal intensity on apparent diffusion coefficient maps.6
SPECT
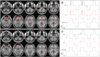
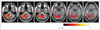
Individual analyses showed hypoperfusion in the cerebellar vermis and uni- or bilateral temporal lobes during the attacks in all patients. One patient (patient 5) also exhibited increased perfusion in the left frontal lobe and right corpus callosum (p<0.005, uncorrected k>100). Cerebral activity was normalized using an ANCOVA scale (Fig. 2A). The cerebellar vermian hypoperfusion had normalized 2 weeks later (Fig. 2C). Group analyses revealed hypoperfusion (p<0.005, uncorrected cluster k>100) in the cerebellar vermis during the TGA attack (Fig. 3).
Abnormal oculomotor findings
Eye movements were abnormal in all patients during the TGA attack. The most striking feature was hypermetric saccades in all patients (Fig. 2B). One patient (patient 2) demonstrated downbeat nystagmus in the primary position, and another (patient 3) displayed upbeat nystagmus during upgaze. Smooth-pursuit eye movements were mildly broken up in one patient. The vestibulo-ocular reflex gain, as judged by the head impulse test and dynamic visual acuity, was normal. The abnormal response of both eyes on the video-oculography had disappeared 2 weeks after symptom onset (Fig. 2D).
Discussion
Our patients showed cerebellar vermian hypoperfusion in addition to ischemic insults to the lateral hippocampus during the TGA attacks. Furthermore, the patients exhibited abnormal ocular movements, which are suggestive of cerebellar dysfunction, but these resolved with the normalization of cerebellar hypoperfusion. Previous studies on brain SPECT in TGA have demonstrated transient hypoperfusion of the bilateral medial temporal lobes,4 left temporal lobe,8 various cortical areas including the occipital lobe and thalamus,9 unilateral or bilateral temporal lobes,10 thalamus and angular gyrus,11 right basal ganglia, the polar area of the left temporal lobe,12 and right thalamus.13 Previously, serial brain SPECT images also revealed hypoperfusion in the bilateral medial temporal lobes during the acute phase of TGA, which normalized later. However, bilateral cerebellar hypoperfusion has not been described in TGA.
In view of the normal perfusion in the cerebral cortices, the observed cerebellar hypoperfusion cannot be explained by crossed cerebellar diaschisis. Furthermore, all patients showed abnormal oculomotor findings during the acute phase, which resolved along with the normalization of cerebellar vermian hypoperfusion. This also supports the occurrence of cerebellar dysfunction during a TGA attack.
The cerebellar vermis, sometimes called the "limbic cerebellum", plays a role in the control of affective behaviors and in the coordination of fear-related somatic and autonomic conditioned responses.14 The vermis is divided into three lobules: anterior superior (lobules I-V), posterior superior (VI and VII), and inferior posterior (VIII-X).15 The dorsal cerebellar vermis (lobules V-VII) and the fastigial nuclei are important for saccade control. Chemical inhibition of the fastigial nuclei leads to hypermetric saccades via their influence on the saccade burst generator within the brainstem. The low sampling rate of video-oculography equipment makes it unsuitable for analyzing rapid eye movements such as saccades.
The cerebellar vermis may be particularly vulnerable to stress because it has the highest density of glucocorticoid receptors during the development, exceeding even those in the hippocampus. Early stressful experience gives rise to several structural and functional neurobiological consequences, including reduced size of the corpus callosum, impaired development of the left neocortex, hippocampus, and amygdala, enhanced electrical irritability in the limbic structures, and reduced functional activity of the cerebellar vermis. Like the hippocampus, the cerebellar vermis may produce granule cells postnatally.16,17 The cerebellar vermis appears to play a role in the control of epilepsy and limbic activation. Electrical stimulation of the vermis suppresses the onset and spread of seizures.18 It has been shown that with any level of limbic symptomatology there is a marked decrease in the relative perfusion of the vermis in individuals with a history of abuse, which is indicative of a functional impairment in the activity of the cerebellar vermis.19
There is increasing awareness of the critical role played by the cerebellum in attention, language, cognition, and affect. Cognitive, linguistic, social behavioral, and emotional disruptions appear to be the primary clinical manifestation of cerebellar and vermal lesions.20 The cerebellum occupies only 10-20% of the volume of the brain, but it contains more than half of all the brain's neurons. There is new evidence that abnormalities in the cerebellar vermis are involved in a wide array of psychiatric disorders, including schizophrenia, autism, attention-deficit hyperactivity disorder, and both bipolar and unipolar depression. The cerebellar vermis exerts strong modulatory effects on the locus ceruleus, ventral tegmental area, and substantia nigra, which include neurons that form the primary norepinephrine and dopamine projections.21,22 The cerebellum not only modulates the systemic circulation, but also influences regional cerebral blood flow, and initiates long-term neuroprotection of the brain from ischemic injury, independent of its effects on the blood flow.16
These findings suggest that the vermis is important for the maintenance of psychiatric health, that it is significantly affected by early stress or neglect, and that it mediates some of the primary neurobehavioral consequences of early stress or neglect. As mentioned above, hypoperfusion of the vermis is related to the epidemiology during the TGA attack period. All patients are in a stressful condition during the attack, and it is considered that this situation affects the vermis.
 XML Download