

 PDF
PDF ePub
ePub Citation
 Print
Print


INTRODUCTION
Moyamoya disease is a vaso-occlusive disorder characterized by progressive luminal narrowing and the eventual disappearance of the terminal internal carotid artery (ICA) of the anterior circulation.1 Abundant collaterals develop simultaneously from the posterior intracranial circulation with progressive depletion of blood flow of the anterior circulation. Subsequent remodeling of the intracranial hemodynamic status is therefore expected as a result of the progressive luminal narrowing of the anterior intracranial circulation and collateral development in the posterior circulation.
Previous studies have demonstrated that the flow velocity changes with advancing moyamoya stage. The flow velocity of the middle cerebral artery (MCA) decreases as the disease progresses from an early stage to a late stage.2 The normal flow velocity of early-stage moyamoya disease increases to a stenotic velocity in the middle stage of the disease, and then finally decreases in the late-occluded stage of moyamoya disease.3 However, previous studies have only focused on the MCA or have only used a simple classification based on magnetic resonance angiography (MRA) into three stages for moyamoya patients.
To more clearly understand the stage-specific hemodynamic changes that develop in the intracranial vessels of patients with moyamoya disease, we compared changes in the blood flow velocities of variable anterior and posterior intracranial vessels according to the conventional angiographic stages of the disease.
MATERIALS AND METHODS
1. Subjects
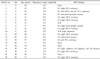
We initially included 28 consecutive moyamoya disease patients who had been admitted to the Department of Neurology, Chungnam National University Hospital, Daejon, Korea. We reviewed the magnetic resonance imaging (MRI) data, transfemoral cerebral angiography (TFCA) data, and clinical and laboratory findings in these patients. We excluded any patient who was younger than 20 of age or who potentially had quasi-moyamoya disease, including those with abnormal thyroid function, atherosclerotic changes in the intra- and extracranial vessels, vasospasm of subarachnoid hemorrhage and intraventricular hemorrhage, fibromuscular dysplasia, vascular malformations, or a history of oral contraceptive intake.4,5 These criteria resulted in the inclusion of 19 adult moyamoya patients (9 males, 10 females; age, 42.3±12.4 years, mean±SD) in our analysis of cerebral blood flow changes (Table 1). Four of the included patients had unilateral development of moyamoya vessels.
2. Angiographic staging of moyamoya disease
We modified Suzuki's classification to define the moyamoya stages in our patients.1 The original classification used all angiographic findings describing both small- and large-vessel status in each stage. The blood flow velocity detected by transcranial Doppler ultrasonography (TCD) is influenced mainly by the status of large vessel. Therefore, to simplify our comparison of the cerebral blood flow changes in the anterior cerebral circulation during the progression of moyamoya disease, we reduced the six stages of Suzuki's classification into five stages based on the large-vessel status of the anterior circulation (Table 2).1,6 In brief, the mildly stenotic carotid fork of stage I and the peripheral vessel dilatation of stage II according to Suzuki's classification were combined to create stage I/II since these two stages are associated with similar MCA lumen characteristics. The angiographic findings associated with the carotid fork were simplified as follows: marked stenosis (stage III) of the MCA and anterior cerebral artery (ACA), disappearance of the MCA and ACA (stage IV), and disappearance of terminal intracranial artery (TICA) in the posterior communicating artery (stage V) or in the ophthalmic artery (OA; stage VI). Although progressive luminal and vascular changes in the posterior vertebrobasilar circulation have been noted in young moyamoya patients,7,8 the adult moyamoya patients included in our study showed good collateral flows from the posterior circulation without luminal narrowing in the basilar artery (BA). Therefore, we did not consider the vessel status of the posterior circulation in our moyamoya stage classification.
3. TCD evaluation
All patients underwent TCD within 7 days after a TFCA examination using a 2-MHz range-gated and pulsed Doppler instrument (TC 4040, Nicolet/EME). The hemodynamic status in the anterior intracranial circulation was evaluated by measuring the mean blood flow velocities (MBFVs) in the bilateral MCA (at a depth of 55 mm), ACA, TICA, OA, and siphon region of the ICA (ICA-siphon). For the posterior circulation, the MBFVs in the bilateral posterior cerebral artery (PCA) and BA (at a depth of 100 mm) were examined. Finally, Doppler signals from six vessels in three patients with moyamoya stage 3 or 4 were not obtained (one ACA and one PCA in case 2, two TICA in case 5, and one MCA in case 7), although the vessels were visible on TFCA. These six vessels were not included in the statistical analyses.
4. Statistical analyses
The continuous progression of moyamoya disease has been observed in clinical and angiographic follow-ups.9,10 The progressive structural change from a normal diameter to marked stenosis, and then from stenosis to final disappearance are the anticipated nonlinear sequential hemodynamic changes in the MCA, ACA, and TICA. Furthermore, collateral blood flow should develop simultaneously from the posterior intracranial circulation as moyamoya progresses in the anterior circulation. Simple or multiple linear regression analyses are usually used to examine the significance of a linear regression line that has no changing point. Thus there are limitations to the use of linear regression analyses in evaluating the statistical significance of nonlinear regression lines. Piecewise regression analysis has been used to evaluate the statistical significance of nonlinear regression lines that have changing points.11 We used piecewise linear regression models to investigate whether linear or nonlinear changes in hemodynamic slope occur with the progression of moyamoya disease. Although the present moyamoya stages defined by imaging findings are not separated by equal intervals, for the regression analysis we assumed that the progression of moyamoya stages was equally spaced from stage I/II to stage VI. The piecewise linear model determines whether the initially increasing slope of the MBFV changes to a decreasing slope at a particular stage during the progression of moyamoya disease. The model is as follows:
MBFV=a+b1×stage+b2×(stage-κ)×dummy,
where a, b1, and b2 are regression coefficients, "stage" is the stage of moyamoya disease, κ is the knot value (i.e., the moyamoya stage at which the slope changes), and "dummy" is the dummy variable (1 if stage>κ, 0 otherwise).
The piecewise linear regression model was fitted to identify the knot point in each vessel, which is the stage at which the linearity of the slope transitions from increasing to decreasing. Among all the linear and nonlinear piecewise models using different stages as the knot value, we chose the model having the lowest p and the highest R2 values as the most plausible model for a given intracranial vessel.
RESULTS
1. MBFV changes in the anterior circulation
In total, we used 38 angiographic and TCD observations (4 at stage 0, 3 at stage I/II, 9 at stage III, 14 at stage IV, 3 at stage V, and 5 at stage VI) to assess the bilateral anterior circulation in 19 patients, and analyzed the MBFV changes associated with the progression of moyamoya disease (Table 1). Based on MRI findings, cerebral infarctions, intracerebral hemorrhage, and intraventricular hemorrhage in the brain parenchyma were observed in 68%, 5%, and 5% of patients, respectively (Table 1). No significant parenchymal lesions were noted in 16% of patients on initial MRI workups.
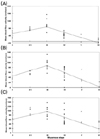
The carotid fork region showed nonlinear hemodynamic changes with progressing moyamoya stages. The following piecewise linear regression models for MCA (p<0.0001, R2=63%), TICA (p=0.0001, R2=42.70%), and ACA (p<0.0001, R2=52.60%) showed the best fits with the knot point at stage III:
MCA=56.8+23.6×stage-60.4×(stage-2)×dummy
TICA=62.4+16.7×stage-42.6×(stage-2)×dummy
ACA=44.8+21.4×stage-49.4×(stage-2)×dummy
The MBFV of the vessels insidiously increased to a marked stenotic velocity at stage III, and then the velocity progressively decreased to 0-20 cm/s at stage VI (Fig. 1).
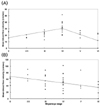
The following nonlinear regression model for OA (p=0.0002, R2=40.20%) showed the best fit with the knot point at stage IV:
OA=16.1+4.7×stage-13.8×(stage-3)×dummy
The MBFV of the OA gradually increased to a stenotic velocity at stage IV, and then progressively decreased to the final stage, at which point the velocity was slightly lower than the normal velocity (Fig. 2A). The linear regression model for the ICA-siphon (p=0.0163, R2=15.10%) with no knot point at any moyamoya stage was
ICA-siphon=67.9-6.6×stage
In the ICA-siphon, the MBFV gradually decreased from a normal MBFV at stage 0 to a lower velocity at stage VI. However, the MBFV of the ICA-siphon decreased to below the normal range at the final stage VI (Fig. 2B).
2. MBFV changes in the posterior circulation
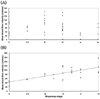
To evaluate collateral flows developing from the posterior circulation, we analyzed the linearity of the MBFV changes in the PCA and BA as the disease progressed. The PCA showed an increased MBFV at stages III and IV and a decreased MBFV at stages V and VI. However, neither linear nor nonlinear models could be significantly fitted to explain the changes in MBFV (Fig. 3B).
It was difficult to relate the hemodynamic changes from a single BA in a patient with bilateral moyamoya stages in the anterior circulation. We therefore first combined the bilateral moyamoya stages of anterior circulation from each patient, and then analyzed the linearity of the MBFV changes in the BA using the 19 combined moyamoya stages. The linear regression model for BA (p=0.0009, R2=48.90%) with no knot point for any moyamoya stage was
BA=43.3+14.0×combined-stage
The MBFV of the proximal and distal BA continuously increased from stage 0 to VI. At stages III and IV the MBFV increased to a stenotic velocity. At the final stage VI, the MBFV of the BAs was higher than the stenotic flow velocity observed in earlier stages (Fig. 3A).
DISCUSSION
In this study, we observed the sequential intracranial hemodynamic changes that develop with the progression of moyamoya disease. Although various hemodynamic changes12,13 and subsequent hemodynamic changes in intracranial vessels2,3 have been reported for moyamoya disease, those studies did not describe stage-specific hemodynamic changes that develop simultaneously in the posterior intracranial circulation as moyamoya disease advances. Furthermore, some studies have used mixed hemodynamic data obtained from children and/or adult moyamoya patients,2 or used mixed MRA and/or conventional angiographic data.3 To avoid the limitations of these previous studies, we documented the sequential hemodynamic changes that developed in the anterior and posterior intracranial circulations in adult moyamoya disease as detected by conventional angiography.
Functional hemodynamic evaluations using positron-emission tomography, single-photon-emission computed tomography, and xenon-inhalation studies have aimed at understanding changes in intracranial hemodynamics.6,14,15 The reconstruction of peculiar and small vascular networks after large-vessel changes might be important for maintaining global cerebral circulation in moyamoya patients.1 However, the structural changes in the large vessels in the carotid fork - rather than in the small pial or basal moyamoya vessels - might have the greatest effects on TCD evaluations at different stages of moyamoya disease. Therefore, we used a classification system based on changes in the status of large vessels during the progression of moyamoya disease. Previous studies have employed several moyamoya classifications to define the progressive structural changes in moyamoya vessels using conventional angiography and MRA.1,3,8 For a more practical evaluation of hemodynamic changes in moyamoya disease, we combined stages 1 and 2 in Suzuki's classification to create five simpler stages.
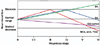
We expected to see nonlinear hemodynamic changes resulting from the sequential structural changes associated with the progression from a normal diameter to marked stenosis, and ultimately to the disappearance of the terminal ICA. We also expected that the development of collateral flows from the posterior circulation would coincide with the start of anterior moyamoya changes. The piecewise linear regression model is an appropriate statistical method for confirming the presence of significant linear or nonlinear hemodynamic changes that develop in intracranial vessels as moyamoya disease progresses. Combining observations of linear and nonlinear MBFV characteristics in variable intracranial vessels might be useful for assigning a hemodynamic status to each moyamoya stage (Fig. 4). The early stage I/II did not show a unique pattern of hemodynamic changes, in that all the tested vessels had already started to change. In stage III, the stenotic MBFV peaked in the MCA, ACA, and TICA, and the MBFV of the BA and OA started to increase linearly. Stage IV showed a peak stenotic MBFV in the OA, whereas the peaked stenotic MCA, ACA, and TICA velocities had decreased back to their normal levels. The discrepancy between the high MBFV of the BA and the low MBFV of the MCA, ACA, and TICA was greater at stage V than at the previous stages. The MBFV of the OA and ICA-siphon decreased to near-normal levels. At the final stage VI, the MBFV of the MCA and ACA decreased to near zero, and the BA showed the highest velocity. Even though the OA and ICA-siphon showed the lowest MBFV at stage VI, the levels were only slightly lower than normal. Therefore, although TFCA is considered the gold standard for the diagnosis and follow-up of moyamoya disease,16 our analysis of the unique hemodynamic characteristics at different moyamoya stages might be a useful tool for supporting suspected moyamoya disease, as well as for measuring the progression of moyamoya disease after an initial diagnosis.
In the evaluation of the posterior circulation of our moyamoya patients, only the BA showed a linear increase in flow velocity. The PCA showed no significant linear or nonlinear hemodynamic changes associated with moyamoya progression, which might be due to anatomical variations. In some moyamoya patients, the PCA arises from or communicates significantly with the ICA via a posterior communicating artery, as observed with the normal variation of the circle of Willis. The communication of the PCA with the ICA becomes more prominent in the later stages of moyamoya disease. The hemodynamic status of the PCA could indicate collateral development in the posterior circulation via the PCA in some moyamoya patients who have a typical circle of Willis. However, the hemodynamic changes in the PCA could also be related to collateral development from the anterior circulation in moyamoya patients who have a prominent posterior communicating artery. Therefore, the observed hemodynamic changes in the PCA might not truly reflect the stage-specific changes developing in the posterior circulation of moyamoya patients. Although more hemodynamic and anatomical observations are needed to accurately determine collateral developments from the anterior and posterior circulations in moyamoya patients, the present results suggest that the BA is more useful than the PCA for evaluating the collateral development in the posterior circulation as moyamoya disease advances.
Bilateral ICA occlusion associated with variable stroke risk factors is a rare cerebrovascular disease entity.17,18 It has been suggested that the posterior vertebrobasilar system is the main collateral source for maintaining a normal cerebral blood flow at rest.17 However, the natural history of rearrangements of the cerebral hemodynamic status in both carotid artery occlusions is poorly understood. The present analysis of MBFV changes in the anterior and posterior circulations associated with the stages of moyamoya disease provides data to explain the hemodynamic changes correlated with the disappearance of the bilateral anterior circulations.

 XML Download