

 PDF
PDF ePub
ePub Citation
 Print
Print


INTRODUCTION
Clinical differentiation between idiopathic Parkinson's disease (PD) and the striatonigral variant of multiple system atrophy (MSA-P) is often difficult, particularly at the early stages. The main pathologic change observed in MSA-P is striatal degeneration in addition to the nigral cell loss seen in PD.1 Recent magnetic resonance imaging (MRI)-based volumetry studies have shown that the striatal volume is lower in MSA-P than in PD.2,3 However, the requirement to set a specific volume cutoff threshold is problematic due to the wide overlap between the two diseases (presumably resulting from the individual variation in absolute striatal size), which limits the diagnostic usefulness of MRI volumetry in routine clinical practice.2 Interestingly, the pattern of striatal degeneration in MSA-P is characterized by predominant involvement of the putamen with relative sparing of the caudate nucleus;1 this may result in a reduced the putamen/caudate volume ratio (PC ratio), which may be beneficial in reducing interindividual variability. Thus, we measured the PC ratio on routine brain MRI images to test its clinical value in early differentiation between MSA-P and PD.
MATERIALS AND METHODS
The study subjects comprised 24 consecutive patients with MSA-P (12 men and 12 women; age 65.5±7.1 years, mean±SD) and 21 consecutive patients with PD (4 men and 17 women; age 65.2±10.3 years), all of whom underwent brain MRI and had symptoms for 3 years or less. Clinical diagnoses of PD and MSA-P were based on the UK brain bank criteria4 and MSA consensus criteria,5 respectively.
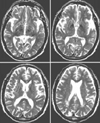
T2-weighted brain MRI (TR=4000 ms, TE=98 ms) was undertaken using a 1.5-T device (Signa Horizon Echo Speed, GE, Milwaukee, WI) with a standard quadrature head coil and a transaxial image slice thickness of 7 mm. Two neurologists (Drs. Kang and Yang) who were blinded to each other's assessments and the patients' diagnoses delineated the putamen and the caudate nucleus using a computer pen-based mouse on all the T2-weighted axial MRI images containing these structures using Scion Image® (Fig. 1). The volumes of these structures were calculated by multiplying the measured area by the number of slices containing them (i. e., measured area number of slices containing the structure 7 mm). For each patient, the mean ratio of both sides was used in the analyses.
Simple regression analysis was used to evaluate the relationship between the measurements of the two investigators, and to test the relationship between PC ratio and symptom duration or symptom severity. The unpaired t-test was employed to compare values between MSA-P and PD patients, with probability values of p<0.05 considered statistically significant.
RESULTS
Age and symptom duration were comparable between the two groups: the age was 65.3±10.3 and 65.5±7.1 years, and the symptom duration was 20.0±14.0 and 15.9±10.4 months in PD and MSA-P, respectively. However, symptom severity based on Hoehn & Yahr stage was significantly higher in patients with MSA-P due to early development of postural instability (1.8±0.64 in PD and 2.71±0.57 in MSA-P).
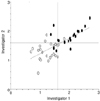
The measured PC ratios of the two investigators were highly correlated (r=0.72, p<0.0001), although a certain amount of discordance was evident for individual patients (Fig. 2). The mean PC ratios of both investigators were significantly lower (p<0.0001) in MSA-P (1.29±0.24) than in PD (1.91±0.29). Setting an arbitrary cutoff ratio of 1.6 resulted in 91.7% and 87.5% patients with MSA (according to investigators 1 and 2, respectively) falling into the group with a lower ratio, while 81.0% and 85.7% of patients with PD (according to investigators 1 and 2, respectively) were in the other group (Fig. 2). PC ratios in the MSA-P group were not correlated with either symptom duration (r=0.13 and p=0.55) or symptom severity (i.e., Hoehn & Yahr stage) (r=0.25 and p=0.24).
DISCUSSION
This study used routine MRI with a 7-mm slice thickness, and area measurements were performed manually. Thus, our absolute volume measurements may be less accurate than those in previous MRI volumetry studies that employed thinner slices.2,3 However, since the same method was applied to measure both structures, we assume that the volume ratio itself is more reliable than measuring absolute volumes. The high correlation between the measurements of the two investigators supports this assumption.
MRI volumetry studies have shown that both areas are degenerated in MSA-P,2,3 but the reduced PC ratio confirmed previous pathological findings that the degree of degeneration is much more severe in the putamen than in the caudate nucleus.1 Since the striatum is not affected in PD,2,3 the PC ratio is presumably similar in PD patients and healthy subjects. The relative ease of performing routine MRI-based PC ratio measurements in clinical practice may represent an advantage over MRI volumetry2,3 and other MRI-based methods aimed at discriminating between MSA-P and PD.6,7 An arbitrary cutoff of 1.6 differentiated more than 80% of the patients included in this study. Considering the interinvestigator variability, this value may not be applicable in other experimental settings, but it appears to provide useful information for early differentiation of MSA-P and PD.
 XML Download