

 PDF
PDF ePub
ePub Citation
 Print
Print


INTRODUCTION
Stroke and falls have a large impact on society. Stroke is the second largest cause of death and the leading source of disability,1 and the lasting neurological symptoms of stroke could increase the risk of falls.23 It is well established that falls are associated with increased morbidity and mortality. People who experience falls are also more likely to have other chronic conditions such as diabetes, arthritis, osteoporosis, and indeed stroke,45 all of which contribute to a pre-existing increased risk of falls,3 with some of these morbidities also being risk factors for stroke.
While it is recognized that falling after stroke increases mortality, little is known about the effects of previous falls or low-trauma fractures on mortality after stroke. While low bone mineral density has been linked to stroke incidence6 and is a strong factor associated with fracture risk,457 the links between previous falls and low-impact fractures on mortality outcomes after stroke remain unclear. Identifying such links may have important prognostic implications, including for identifying those patients with stroke who require targeted intervention.
The aim of the current study was therefore to determine whether a history of falls or a history of falls and fractures is associated with immediate mortality and predicts longer-term mortality after stroke.
MEHTODS
Study population
The study population was drawn from the Norfolk and Norwich University Hospital Stroke and Transient Ischaemic Attack Register (NNSTR) in East Anglia, UK, which has a catchment population of approximately 750,000 people. The NNSTR was set up in late 1996, with regular annual record linkage of comorbid conditions and mortality status after stroke, thereby providing a unique opportunity to examine the outcomes of these patients over a long-term follow-up. The register received research database ethical approval from the Newcastle and Tyneside National Health Service and the Research Ethics Committee (approval no. 12/NE/0170). The study protocol was approved by the Steering Committee of the Register.
Data collection
The data collection methods have been described previously.8910 In brief, the data entry team entered paper and electronic records into the stroke register database prospectively, under supervision by clinicians. Patients were included if they had a confirmed ischemic or hemorrhagic stroke based on clinical examinations, the medical history, and neuroimaging results. Only the first recorded stroke in the database was used in the analysis of each patient. The prestroke modified Rankin Scale (mRS) score is commonly used to measure the level of disability (with 0 indicating no disability, 5 indicating severe disability and requiring constant nursing care, and 6 indicating being dead), and it was confirmed from medical records or from the history as reported by patients and relatives.
The predicting variables used in the study were a history of falls and a history of falls and fractures. A history of falls or fractures was defined as either event occurring before the date of the stroke event. This indicated that falls occurred in women at a median of 1.44 years before their stroke [interquartile range (IQR)=3.72 years] while fractures occurred at a median of 2.24 years (IQR=4.54 years); the corresponding values for men were 1.16 years (IQR=3.21 years) and 1.50 years (IQR=4.24 years), respectively. The International Classification of Diseases tenth revision (ICD-10) codes for the occurrence of falls were W00 to W19, while those for fractures were ICD-10 codes S82, S72, S62, S52, S42, S32, S22, S12, S02, T14.2, and T10. Patients who had a history of fractures were only included if they also had a history of falls, since the fractures were then more likely to be associated with low-trauma (i.e., fractures associated with falls and therefore frailty, not high energy trauma).
Statistical analysis
The statistical analysis was performed using SPSS Statistics (version 24, IBM Corp., Armonk, NY, USA). In the analysis we used sex-specific data to fully examine the effects of a history of falls and fractures stratified according to sex, since women are more likely to fall than men and are also more prone to osteoporosis.34 Descriptive statistics were calculated separately for men and women, with and without a history of falls or a history of falls and fractures. Continuous variables are presented as mean±SD values, while categorical variables are presented as number and percentage values. Characteristic data were compared between patient groups using independent-samples t-tests for continuous variables and chi-squared tests for categorical variables.
We investigated the effects of a history of either falls alone or of both falls and fractures on the stroke prognosis in terms of mortality at six different time periods for men and women separately. The outcomes were defined by mortality at these time points: in-hospital, 0–30, 31–90, 91–365, 366–1,095 (1–3 years), and 1,096–3,650 days (3–10 years). These time points were selected to allow the in-hospital and short-, medium-, and long-term effects of a history of either falls alone or falls and fractures on poststroke mortality to be examined accurately, without deaths during the previous time points distorting the results. Binary logistic regression was used to obtain odds ratios (ORs) for the short-term analysis of in-hospital mortality and mortality up to 30 days, while Cox proportional-hazards model regression was used to obtain hazard ratios for the longer-term analysis of mortality from day 31 onward.
The variables included in regression models examining mortality outcomes were chosen based on our own work and that of others that have shown impacts on stroke mortality. We incorporated the identified variables in eight models that were analyzed separately for men and women: Models A–F, where Model F was the fully adjusted model, and Models C2 and G were used for two sensitivity analyses. These models were constructed to fully analyze, in a step-by-step approach, the complex relationships between falls, fractures, and stroke mortality in order to examine the potential confounding effects of variables incrementally added to the following adjusted models:
A) Not adjusted.
B) Adjusted for age, stroke type (ischemic or hemorrhagic), and Oxfordshire Community Stroke Project (OCSP) classification (lacunar stroke, partial anterior circulation stroke, posterior circulation stroke, and total anterior circulation stroke).
C) Further adjusted for the presence of pre-existing comorbidities before stroke (previous strokes, transient ischemic attacks, congestive heart failure, coronary heart disease, atrial fibrillation, myocardial infarction, diabetes, hypertension, peripheral vascular disease, chronic kidney disease, chronic obstructive pulmonary disease, dementia, hyperlipidemia, and cancer).
C2) Used in a sensitivity analysis to examine the effects of a previous history of stroke on the results, adjusting for the same variables as in Model C but excluding patients who had a previous history of stroke.
E) Further adjusted for the acute illness parameters of the admission white blood cell count and C-reactive protein.1314
F) Further adjusted for the acute illness parameters of the admission serum sodium, albumin, and glucose.151617
G) Used in a sensitivity analysis to examine the impact of the prestroke mRS score (a measure of frailty) on outcomes by removing this variable from the final adjusted model (Model F).
Missing data were excluded from each successive model.
RESULTS
In total, 11,729 stroke cases were recorded between January 2003 and April 2015. Applying the exclusion criteria of the study as detailed in Supplementary Fig. 1 (in the online-only Data Supplement) resulted in 10,477 cases for inclusion in the analysis. Although set up in 1996, cases before 2003 were excluded since electronic record linkage for some variables (e.g., blood tests and extensive comorbidity linkage through electronic records) was not available before this time. Six stroke events were excluded due to the patients being younger than 18 years, and 990 were excluded due to them being related to the second or third admission of the same patient during the study period (to avoid duplicate data, we only included stroke cases that were the first recorded in the register for each patient). A further 102 were excluded because they were lost to follow-up, and lastly 154 were excluded because they had a history of fractures but not a history of falls. Therefore, 10,477 people with stroke recorded for the first time in the register during the study period were included in the analysis.
The cohort was aged 77.7±11.9 years (mean±SD); 47.8% were men (n=5,003) and 52.2% women (n=5,474). A history of falls was observed in 14.7% of cases (n=1,535), 72.0% of which involved women. A history of falls and fractures combined was observed in 8.5% of cases (n=895), most of which (78.9%) involved women. Ischemic stroke occurred in 86.1% of the cases, with the most common OCSP stroke classification (31.0%) being partial anterior circulation stroke. Most (59.0%) of the patients had a prestroke mRS score of 0. The prevalence of a history of both falls and falls and fractures increased with age and was significantly higher in women: 20.2% of the women had a history of falls compared with only 8.6% of the men, and 12.9% of the women had a history of both falls and fractures compared with 3.8% of the men. The distribution of stroke types was similar between those with and without a history of falls.
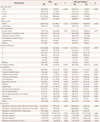
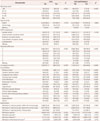
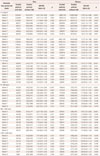
Tables 1 and 2 list the basic data characteristics for those with and without a history of falls or a history of falls and fractures in men and women, respectively. The prestroke mRS score was higher in the presence of a history of falls in both men and women. The prevalence rates of dementia, hypertension, previous stroke, congestive heart failure, coronary heart disease, atrial fibrillation, diabetes, chronic kidney disease, and chronic obstructive pulmonary disease were higher in patients with a history of falls or a history of falls and fractures than in nonfallers (p<0.05). A history of transient ischemic attacks was more common in women with a history of falls or a history of falls and fractures (p<0.001), while there was no such association in men. Peripheral vascular disease was associated with a history of falls alone in both men (p<0.001) and women (p=0.018) and with a history of falls and fractures in men only (p<0.001). In women, hyperlipidemia was only associated with a history of falls (p=0.011), as was myocardial infarction (p=0.007). In men, hyperlipidemia was also associated with a history of falls (p=0.036), and a history of myocardial infarction was associated with both a history of falls and a history of falls and fractures (p=0.005 and <0.001 respectively). Cancer was not significantly associated with a history of falls or a history of falls and fractures in women (p≥0.377), while it was significantly associated with a history of falls (p<0.001) but not with history of both falls and fractures (p=0.226) in men.
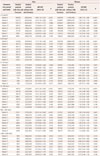
Table 3 presents the effects of a history of falls on mortality in both men and women. The patients were divided into two categories for the analysis: those with and without a history of falls. The analyzed event was the number of deaths occurring during the specified time period, and this was divided by the total number of patients in that period. The total number of cases examined in the models decreased as the number of adjusted variables increased, which was due to any cases with missing data being excluded from the analysis. The in-hospital mortality rate was significantly higher in women with a history of falls than in those with no such history [OR=1.33, 95% confidence interval (CI)=1.03–1.71] in the fully adjusted model (Model F). Model C2 was used in a sensitivity analysis of the effects of a previous history of stroke on the results, and it yielded p values closely matching those of Model C, implying that our results remained significant. Model D (adjusting for the prestroke mRS score) resulted in a loss of significance in the results of our detailed analysis (OR=1.19, 95% CI=0.97–1.45), but the significance remained in the fully adjusted model. The results for Model G, which examined the potential effects of frailty on the outcomes by removing the prestroke mRS score from Model F, remained essentially unchanged, except for a higher significance level (i.e., lower p value) for in-hospital mortality in women with a history of falls alone (Table 3). This suggests that prestroke frailty may serve as a mediator for these outcomes. A significant association was also present for the in-hospital mortality among men in the unadjusted model, although the association was no longer significant after adjusting for comorbidities in Model C (OR=1.17, 95% CI= 0.88–1.56).
A history of falls was significantly associated with increased short-term mortality (0–30 days) in women (OR=1.34, 95% CI=1.03–1.73) in the fully adjusted model. This showed a very similar pattern to the in-hospital mortality in women, with the significance being lost in Model D (OR=1.20, 95% CI=0.98–1.47) but returning in the subsequent increasingly adjusted models. Model G also produced a lower p value than Model F, again indicating that prestroke frailty may contribute to these outcome associations. When adjusting for comorbidities, the significance was lost for the 0- to 30-day mortality in men in Model C (OR=1.14, 95% CI=0.86–1.51).
There were no consistent significant associations between a history of falls and longer-term mortality outcomes.
Table 4 presents the effects of a history of both falls and fractures on mortality in men and women. No association was found between a history of falls and fractures on mortality after stroke in the fully adjusted models for both men and women.
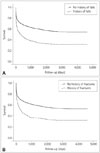
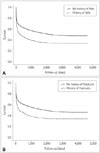
We have also included graphs for the Cox proportional-hazards models that display the mortality rate over the entire follow-up period for men (Fig. 1) and women (Fig. 2) with and without a history of falls (Figs. 1A and 2A, respectively), and with and without a history of fractures (Figs. 1B and 2B, respectively).
DISCUSSION
This is the first report in the literature of the rates of acute mortality in-hospital and at 0–30 days being significantly higher in poststroke women with a history of falls than in those without such a history. However, no similar association was found in men, and there was no association between the predictor of the history of falls and fractures combined and mortality. Our findings suggest that a history of falls may be of prognostic use especially for women who are admitted with a stroke. While it is unclear whether this is mere reflection of frailty, sensitivity analysis that involved removing prestroke frailty, as indicated by the prestroke mRS score, did not significantly alter the results.
These findings raise the possibility of implementing targeted approaches to improve the poststroke outcomes for the atrisk population, for example by providing fall-prevention measures such as targeted balance training and ensuring a safe environment or reviewing current medications.1819 This may be particularly beneficial for women with a history of falls who also have risk factors for stroke.
Previous studies have shown not only that the bone mineral density (an indicator of osteoporosis) decreases after stroke but also that a previous low bone mineral density increases the risk of having a stroke,62021 poststroke mortality,22 and fracture risk,23 with previous fractures having also been shown to be a risk factor for future fractures.7 A study reported on in 1991 found that the risk of death from stroke was increased in women with osteopenia and aged at least 65 years, but showed that most of this risk was unrelated to the occurrence of fractures.24 A prospective study of osteoporotic fractures reported on in 1993 showed an association with low bone mineral density and stroke occurrence in women older than 65 years.25 It was also recently demonstrated that hip fractures increase the risk of stroke.26
In contrast, the present study found no significant association between the predictor of falls and fractures combined and poststroke mortality. This finding is similar to Browner et al.24 reporting in 1991 that fractures were unrelated to death from stroke. Similar results were also reported by Mussolino et al.27 in 2003, who found no association between bone mineral density and mortality after stroke in their population of 3,402 white and black men and women aged 45–74 years who were followed up from 1971 to 1992.
There are a few plausible reasons for explaining our apparently unexpected result that a history of falls associated with a history of fractures did not increase the mortality risk. Firstly, the group sample was relatively small, which could have introduced a type 2 statistical error. Secondly, we might not have adequately controlled for confounders, resulting in the presence of residual confounding or other known and unknown confounders.
A previous study followed up 3,257 Chinese patients older than 55 years for 8 years, and found frailty to be associated with a significantly increased risk of recurrent falls but not fractures, which is also known to be associated with higher mortality.28 Moreover, in our study we also did not distinguish between histories of single and multiple falls, and so those without fractures may have also experienced multiple falls, which is known to be associated with worse mortality outcomes.29
While this study may have unveiled a potential area of risk management to improve clinical outcomes poststroke, future investigations need to determine the mechanisms underlying the association between previous falls and mortality, even though we have shown that frailty may act as a mediator in this association. This should lead to targeted preventative therapies that are effective at reducing mortality.
Tables 1 and 2 indicate that the prestroke mRS score was higher when there was a history of falls, indicating greater disability prior to the stroke. This may partly explain the mortality increase in this group shown using Model G and the loss of significance in Model D. It could be argued that it is therefore unsurprising that the mortality rate is higher among those with a history of falls than in those without such a history. However, we still found a significant association even when the comorbidities and previous disability (an indicator of frailty) were accounted for in women in our fully adjusted models. Examining the links between comorbidity burden, history of falls, and acute mortality outcomes may yield a better understanding of this finding, and also whether specific comorbidities affect the poststroke prognosis relating to a history of falls. Further research directions could include exploring if having a history of falls increases the risk of future comorbidities after stroke.
While the analyzed data provided a unique opportunity to examine the links between a history of falls or a history of falls and fractures and stroke mortality over a long-term follow-up, this study was subject to some limitations. We did not have information on the bone mineral density status of patients, and the history of falls and fractures were based on ICD-10 codes, which may have underestimated their true prevalence in this patient population. Nevertheless, these limitations are likely to only have attenuated the relationships. We attempted to minimize the possible effect of the lack of bone mineral density data by combining falls and fractures into one predicting variable, meaning that the fractures were more likely to be low-trauma fragility fractures related to osteoporosis. There was a considerable amount of missing data in the final models, but the sample size remained adequate and our careful approach to constructing the models reduced the potential effects of any missing data. It is also important to note that we were able to control for important acute illness markers–which are known to influence mortality outcome in stroke–in the final models.
In summary, a previous history of falls was associated with increased acute mortality in women but not in men after stroke. In both sexes, the history of previous falls and fractures combined was not associated with any effect on mortality. The results obtained in this study imply that a history of falls may be an important factor to consider in the prognosis of stroke, particularly in women. Most instances of stroke mortality are acute, with inpatient mortality being the largest burden and of great concern to patients, relatives, and clinicians. This study has therefore made an important contribution by identifying a new marker for an increased risk of mortality after stroke. Further research should attempt to identify the factors underlying this increase in mortality, with the aim of developing targeted interventions that can improve stroke mortality outcomes.
 XML Download