

 PDF
PDF ePub
ePub Citation
 Print
Print


INTRODUCTION
Among the motor symptoms of Parkinson's disease (PD), falling is a serious problem with associated morbidity and mortality. Postural instability, the freezing phenomenon, loss of dexterity, impaired gait control, and PD dementia all directly or indirectly increase the probability of falling.123 Aging, a postmenopausal status, race, low bone mass, low body weight, estrogen deficiency, and a previous fracture are documented risk factors for femur fracture.4 A tendency to fall, immobilization, and low levels of physical activity could also be other risk factors.56 PD patients are thought to have a higher risk of femur fracture due to factors related to nutritional status and bone density.7891011 However, considering the association between the ability of these patients to perform ambulatory activities and the progression of PD, it is unclear whether the risk of femur fracture caused by falling is proportional to the duration of PD, although a relationship between real ambulatory activity and falls in incident PD has been reported.12
We hypothesized that there is a point during the progression of PD at which the risk of femur fracture is highest, with this being neither at the very early nor very advanced stages of PD. We also hypothesized that PD can itself augment the influence of traditional risk factors for femur fracture, including being underweight, postmenopausal, and older.
We examined our hypotheses by analyzing data from the Korea National Health Insurance Service (NHIS) program.13 The clinical diagnosis of PD is frequently challenging, and can result in a misdiagnosis of atypical parkinsonism.141516 We studied patients with parkinsonism, including atypical parkinsonism, but did not limit our inquiry to PD. Based on this data set, we examined the relationship between parkinsonism and femur fracture in patients with parkinsonism and compared these results with comparable data obtained from control subjects.
METHODS
Data acquisition
The NHIS is a universal health insurance program that offers medical-care coverage to all residents of South Korea (http://nhiss.nhis.or.kr), and almost all Korean residents are registered in the NHIS program. The NHIS National Sample Cohort (NSC) contains about one million subscribers to NHIS and the Medical Aid Program, representing approximately 2% of all Koreans and extracted using stratified sampling methods in 2002. The members of the NSC comprise a 12-year cohort (2002–2013) and are tracked in terms of socioeconomic variables (residence area, year and month of death, cause of death, and income level) and medical treatments (health examinations, medical-care history, and medical-care institutions). These data enable long-term observations and can be used to investigate causal relationships. Diseases are registered in the NSC using the Korean Classification of Disease, sixth edition (KCD-6), which is modified from the International Classification of Disease, tenth revision (ICD-10) for use in the NHIS and medical-care institutions in South Korea.
This study was approved by the Institutional Review Board of Kangwon National University Hospital (approval no. KNUH-2016-02-012-001).
Study design
This study involved a population-based matched cohort constructed using the NHIS-NSC. The NHIS-NSC database contains data on 1,017,468 subscribers for the period of 2002–2013. We first selected subscribers who were older than 40 years in 2003 (n=399,954). Parkinsonism was defined as ICD-10 classification codes G20, G22, and G23, and femur fracture was defined as code S72. We excluded subscribers with parkinsonism (n=472) or femur fracture (n=377) registered in 2002 in order to identify newly diagnosed subjects with parkinsonism or femur fractures, because the time of onset of these diseases in the subjects registered during 2002 was unclear. We also used body mass index (BMI) to analyze associations of the amount of tissue mass and parkinsonism with femur fracture, because BMI influences the occurrence of femur fractures in the general population.17 BMI data were available for 304,083 subscribers. When multiple BMI measurements were available for a single subscriber, the BMI measured closest to the time of registration was used in the analysis. Since 2003, 3,850 subjects had been diagnosed as ICD-10 code G20, G22, or G23. In addition to diagnoses, we extracted other variables including age, sex, and BMI. Under the assumptions that femur fracture would occur relatively infrequently in those younger than 65 years and that the number of eligible subjects would decrease rapidly among those older than 80 years, subjects were subdivided into the following age groups at the start of the study: <65, 65–69, 70–74, and ≥75 years.10 In addition, participants were subdivided into underweight (<18.5 kg/m2), normal weight (18.5–22.9 kg/m2), and overweight/obese (≥23 kg/m2) based on the generally accepted BMI criteria for Asians.18
Individuals with parkinsonism were those who were first diagnosed as ICD-10 code G20, G22, or G23 from 2003 to 2013. The index date for these subjects was the date when parkinsonism was first diagnosed. We excluded subjects who were diagnosed with a femur fracture before the index date (n=60) or for whom there was no BMI information (n=1,207). Ultimately, this study included 2,583 parkinsonism patients.
For each case with parkinsonism, up to five controls without parkinsonism were randomly selected and matched for age, sex, and index date.192021 Subscribers in the control group were given the same index date as the subjects with parkinsonism. Subjects in both groups were followed from the index date until the occurrence of femur fracture, death, or December 31, 2013, whichever occurred first.
Statistical analysis
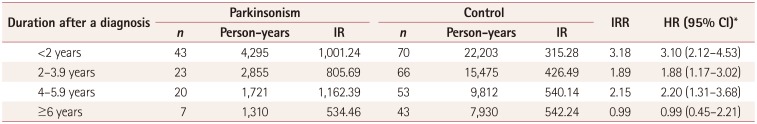
The prevalence rates of parkinsonism per 100,000 individuals in 2003 and the incidence rates of parkinsonism per 100,000 person-years during 2003 and 2013 were calculated. We used Pearson's chi-square test to compare differences in the rates of femur fractures between groups according to age, sex, BMI, and ICD-10 codes. A Cox proportional-hazards model was used to calculate the adjusted hazard ratio (HR) and 95% confidence interval (CI) to determine whether parkinsonism was an independent risk factor for femur fracture after adjusting for sex, age, and BMI. Survival time was defined as the time from the index date until a diagnosis of femur fracture or until censoring due to death or the end of study on December 31, 2013, whichever occurred first. Those who were never diagnosed with a femur fracture by the end of the study were treated as censored. Kaplan-Meier survival curves were estimated, and the log-rank test was used to compare differences in the curves between the groups. After stratifying by sex, age, and BMI, we estimated the relative risk of femur fracture for subjects with parkinsonism compared with that for controls. The duration of parkinsonism from the index date was arbitrarily divided into <2, 2–3.9, 4–5.9, and >6 years in order to compare differences in the relative risk of femur fracture in subjects with parkinsonism and controls.
The statistical analysis was performed using the SAS for Windows statistical package (version 9.4, SAS, Cary, NC, USA).
RESULTS
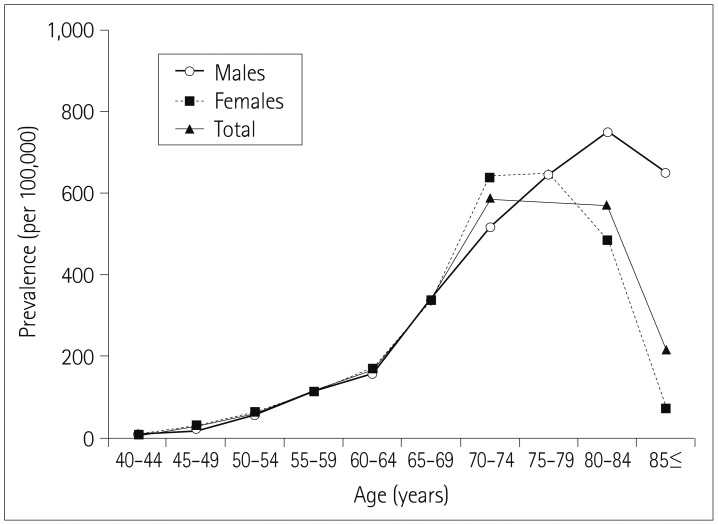
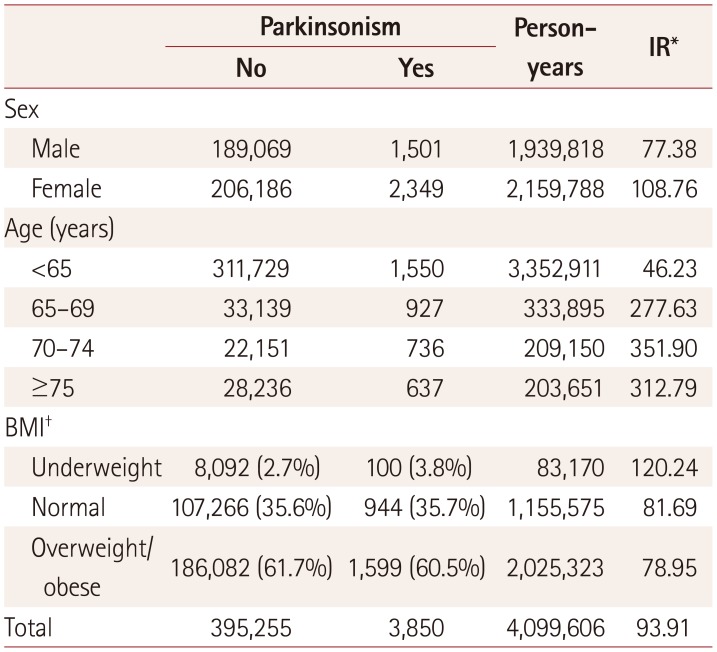
In 2003, the prevalence of parkinsonism was 149 per 100,000 individuals among subjects older than 40 years, and 473 per 100,000 individuals among that those aged 65 years or older. The prevalence of parkinsonism tended to increase gradually up to an age of 80 years, and was higher in males than in females in the oldest groups (Fig. 1). The incidence rate of parkinsonism was 93.91 per 100,000 person-years during 2003 and 2013. The incidence rates of parkinsonism per 100,000 person-years in men and women older than 40 years were 77.38 and 108.76, respectively. The BMI did not differ significantly between subjects with and without parkinsonism (p>0.05). The incidence rate of parkinsonism increased with age. Table 1 summarizes the incidence rates of parkinsonism according to sex and age.
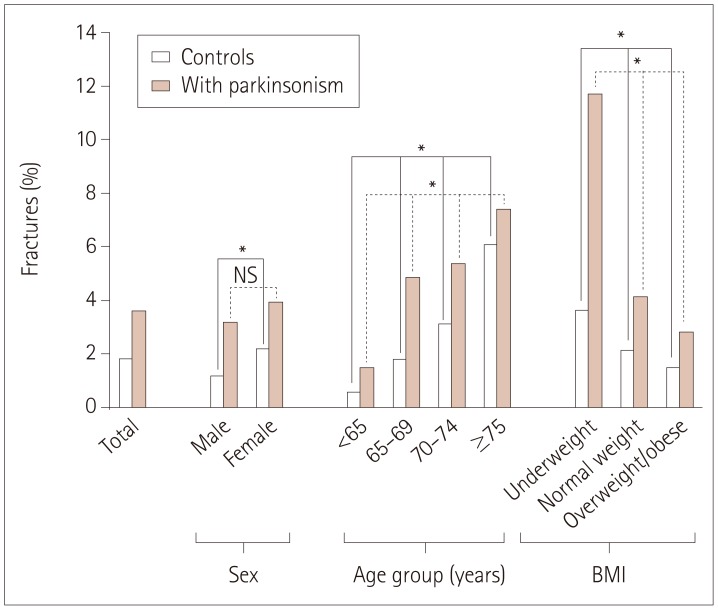
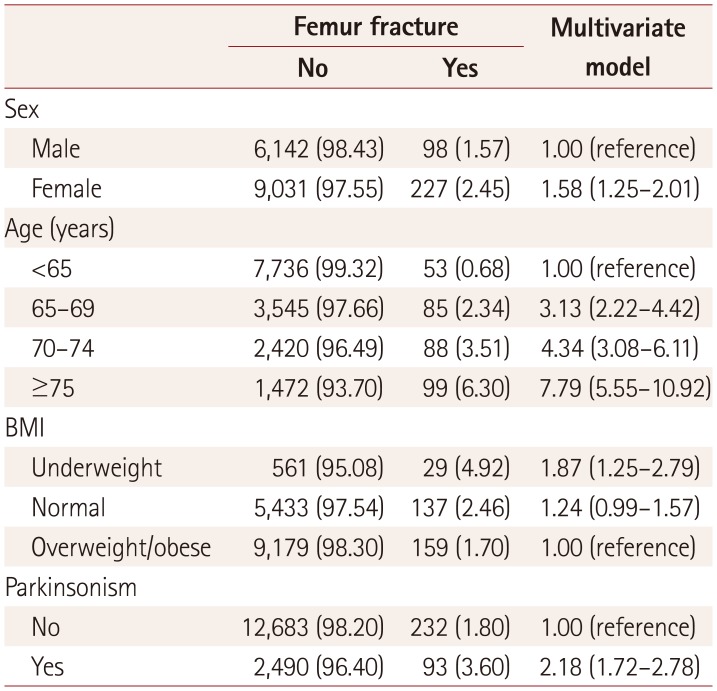
The numbers of subjects diagnosed as codes G20 and G22/G23 were 2,327 and 256, respectively. Among the subjects diagnosed as code G20, 232 subjects also had a diagnostic code of either G22 or G23. The numbers of subjects with femur fracture diagnosed as codes G20 and G22/G23 were 85 (3.65%) and 8 (3.13%), respectively (p>0.05). The risk of femur fracture increased as age increased and BMI decreased regardless of the presence of parkinsonism. However, the risk of femur fracture did not differ significantly with sex for subjects with parkinsonism. In particular, the presence of parkinsonism augmented the influences of traditional risk factors for femur fracture, including age, being female, and being underweight (Fig. 2). These results were confirmed in the stratified Cox regression analysis according to sex, age, and BMI, as shown in Fig. 3.
The multivariate Cox regression models showed that the risk of femur fracture was higher in females than in males (adjusted HR=1.58, 95% CI=1.25–2.01). The risk of femur fracture also increased as subjects aged and as BMI decreased. The overall risk of femur fracture was higher in subjects with parkinsonism than in controls (Table 2) (adjusted HR=2.18, 95% CI=1.72–2.78).
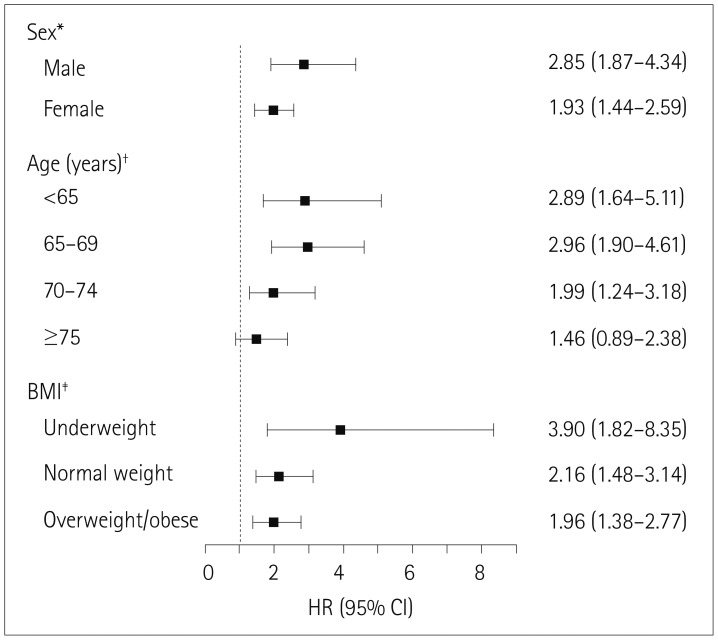
The adjusted HR for the risk of femur fracture in each stratum of sex, age, and BMI showed that the risk of femur fracture was higher in males with parkinsonism than in male controls (HR=2.85, 95% CI=1.87–4.34) and higher in females with parkinsonism than in female controls (HR=1.93, 95% CI=1.44–2.59). Whereas females overall had a higher risk of femur fracture than males, males with parkinsonism had a higher risk of femur fracture than females with parkinsonism. The risks of femur fracture for subjects with parkinsonism younger than 65 years and 65–69 years old were significantly higher than those in the corresponding controls (HR=2.89, 95% CI=1.64–5.11; HR=2.96, 95% CI=1.90–4.61, respectively). However, the risk of femur fracture with parkinsonism decreased as subjects aged (HR=1.99, 95% CI=1.24–3.18 for subjects 70–74 years old; HR=1.46, 95% CI=0.89–2.38 for subjects ≥75 years old). The risk of femur fracture should generally increase with age; however, the influence of parkinsonism on femur fracture had a negative effect as age increased. Subjects with parkinsonism who were underweight, normal weight, and overweight/obese had significantly higher risks of femur fracture than the comparable groups of controls (HR=3.90, 95% CI=1.82–8.35; HR=2.16, 95% CI=1.48–3.14; HR=1.96, 95% CI=1.38–2.77, respectively) (Fig. 3).
The adjusted HR (adjusted for parkinsonism, age, sex, and BMI) for femur fracture with parkinsonism, based on the length of time from the index date and femur fracture, was 3.10 (95% CI=2.12–4.53) within 2 years after being diagnosed with parkinsonism. The adjusted HRs for femur fracture from 2 to 4 years and from 4 to 6 years after being diagnosed with parkinsonism were 1.88 (95% CI=1.17–3.02) and 2.20 (95% CI=1.31–3.68), respectively. However, there was no significant adjusted HR for femur fracture at more than 6 years after being diagnosed with parkinsonism (Table 3). Overall our study indicated that the risk of femur fracture for subjects with parkinsonism is highest early in the diagnosed state, and that the influence of parkinsonism decreases as the duration after a diagnosis of parkinsonism increases.
Kaplan-Meier curves showed that the risk of femur fracture differed significantly between the parkinsonism and control groups (log-rank p<0.001) (Fig. 4). The cumulative HRs for femur fracture in subjects with parkinsonism and controls were 0.0834 and 0.0514, respectively, at the 11-year follow-up (not shown).
DISCUSSION
This study examined a cohort comprising about one million subscribers to medical insurance and aid. All medical service providers must register with the NHIS program for reimbursement, and the NHIS-NSC database contains all of the medical usage data for the subscribers. Another strong point of this study was its ability to analyze the relationship between relatively uncommon diseases due to the sample size comprising approximately one million individuals. This also allowed us to investigate causal relationships between parkinsonism and femur fracture over a long period.
Pathological findings in PD include dopaminergic neuron loss in the substantial nigra, gliosis, and eosinophilic cytoplasmic inclusion bodies.22 However, a diagnosis of parkinsonism (including PD and atypical parkinsonism) is based mainly on the medical history, clinical features, and a neurological examination, because there are no biomarkers for confirming the presence of these disease entities.2324 Although many technical tools are available to support diagnoses, the accuracy of parkinsonism diagnoses has not improved in the last 20 years.25 We therefore assume that the accuracy of parkinsonism diagnoses did not change from 2003 to 2013.
We found that the prevalence rates of parkinsonism among those older than 40 years and at least 65 years of age were 149 and 473 per 100,000 persons, respectively. These results differ from those of a previous study conducted in a rural area in South Korea.26 In terms of geographic location, the prevalence of parkinsonism in our study is also higher than those in other Asian countries.272829 We assume that the increasing proportion of elderly individuals, a trend toward the increasing prevalence of parkinsonism, and variations in investigation methods such as inclusion criteria contributed to the differences among studies.3031 In the present study, both the incidence and prevalence of parkinsonism were closely associated with age. Considering that PD is a neurodegenerative disease and that other forms of parkinsonism are closely related to the aging process, our statistical analysis of the NHIS-NSC data constituted a reliable method for analyzing parkinsonism and related disorders.
In our study, femur fractures were more common in women than in men, regardless of the presence of parkinsonism.3233 However, the difference in the risk of femur fracture between subjects with parkinsonism and controls was greater for men than for women. Postmenopausal osteoporosis is undoubtedly related to femur fracture. In this study we assumed that a femur fracture was a single event but with diverse etiologies, and found that parkinsonism is related to femur fracture in males.
We found that the BMI did not differ significantly between subjects with and without parkinsonism. A low BMI is correlated with a low bone mineral density,1734 and lower body weight and BMI have been found to be more common in individuals with PD than in controls.353637 However, considering that the BMI information used in the present study was obtained at the closest time point to when the diagnosis was made, we found no evidence of a baseline difference in BMI between subjects with and without parkinsonism. In our study the occurrence of femur fracture was significantly positively correlated with age, whereas it was significantly negatively correlated with BMI, regardless of the presence of parkinsonism. Another interesting finding is that age and BMI exerted stronger effects on femur fracture in subjects with parkinsonism, while the influence of parkinsonism on femur fracture increased in younger subjects. These findings imply that the presence of parkinsonism could enhance the traditional risk factors for femur fracture including age and being underweight, and increase the risk of femur fracture at a younger age.
Another interesting finding of our study is that, in contrast to our expectations, the incidence-rate ratio (IRR) of femur fracture was highest within 2 years after a new diagnosis of parkinsonism. In other words, the IRR for femur fracture decreases gradually after a diagnosis of parkinsonism. The severity of parkinsonism is usually closely associated with the duration of disease, which is due to most cases involving a neurodegenerative process. Various factors such as postural instability, the freezing phenomenon, loss of dexterity, and impaired gait control could increase the probability of falling, which can result in femur facture.10 However, our results indicate that advanced parkinsonism does not imply a high risk of femur fracture. Paradoxically, a shorter duration after a diagnosis of parkinsonism was associated with a greater risk of femur fracture. This could be explained by a high risk of a falling event in parkinsonism subjects who do not have the motor symptoms and signs associated with falling. There are several reports of early PD being also associated with falls, related to the frequency of falls varying with the progression of PD.383940 In particular, there is reportedly an inverted U-shaped relationship between the frequency of falling and ambulatory activity, which decreases as the disease severity increases.12 Because the time point of a parkinsonism diagnosis did not directly indicate the occurrence of disease in our study, we cannot suggest that the frequency of femur fracture in subjects with parkinsonism had an inverted U-shaped association with the duration of disease. However, our results could indicate that the duration after a diagnosis of parkinsonism is not always correlated with the risk of femur fracture. A second possible explanation is there being more events of femur fracture for ICD-10 codes G22 and G23 than for code G20, which would have biased our study findings toward overemphasizing atypical parkinsonism with early gait disturbance. Another difficulty is that some of the items under codes G22 and G23 are the same as those under code G20, which makes increases the difficulty of distinguishing between PD and atypical parkinsonism. Our statistical analysis found no significant difference in the frequency of hip fracture between code G20 and the other codes. Based on these results, we assume that the risk of femur fracture in parkinsonism may be high before ambulation becomes functionally limited, which contrasts with previous reports of PD patients with ambulatory impairments having a high risk of falling.3
Based on the findings of the present study–including that the risk of femur fracture was higher in men with parkinsonism, younger individuals with parkinsonism, and individuals with less advanced parkinsonism–we postulate that engagement in ambulatory activity contributes to the occurrence of femur fracture. Providing early education to patients and caregivers is therefore necessary for preventing femur fracture even when there are no limitations in gait.
One limitation of this study is the absence of important information in the NHIS-NSC data, such as medical history, clinical manifestations, and levodopa response. We therefore included subscribers with not only PD (ICD-10 code G20) but also other related forms of parkinsonism (codes G22 and G23), which biased the findings toward overemphasizing atypical parkinsonism with early gait disturbance. Another limitation is the unavailability of records on disease severity, such as for the Unified Parkinson's Disease Rating Scale or the Hoehn-Yahr stage. Therefore, the statistical analysis was performed without information on disease severity or the clinical stage of disease. The other limitation is that no information was available about osteoporosis, which is known to be an important factor for femur fracture, especially in postmenopausal women. We were therefore also not able to directly analyze the association between osteoporosis and parkinsonism.
In conclusion, this study highlights the need to consider how factors associated with the amount of ambulatory activity–even in the early diagnosed state–could play an important role in femur fracture in subjects with parkinsonism. Our results demonstrate that the presence of parkinsonism is more strongly related to femur fracture in males, and augments the influences of traditional risk factors for femur fracture.

 XML Download