

 PDF
PDF ePub
ePub Citation
 Print
Print


INTRODUCTION
Defects in the mitochondrial respiratory chain complex (MRC) can disrupt cellular energy metabolism, resulting in mitochondrial disease (MD), which is an inherited metabolic disorder.1 MRC defects can influence cellular function in various ways, with the neuromuscular system typically being affected.2 Diagnosing MD is a challenge because of its genetic heterogeneity, diversity in clinical phenotypes, and the lack of gold-standard diagnostic criteria.3 The diagnosis involves evaluating clinical symptoms, performing imaging studies and biochemical enzyme assays, and assessing the pathology and molecular biology. MD in infants is particularly difficult to diagnose because the presentation usually involves clinical symptoms that are either atypical or similar to numerous other diseases.45
Muscle biopsy is the most helpful diagnostic procedure for evaluating MD, especially when other tests produce normal findings.67 While the presence of dramatic crystalline inclusions in the mitochondria of skeletal muscle is considered an ultrastructural change characteristic of biopsied skeletal muscle in adults with MD, wide variations in the changes in the ultrastructure of mitochondria in infants with MD have been reported, including between organ types and MD classifications.
Since morphological changes in the mitochondria of infants with MD have not been characterized adequately, we investigated the associated ultrastructural changes in the skeletal muscle.
METHODS
Patients and muscle biopsy
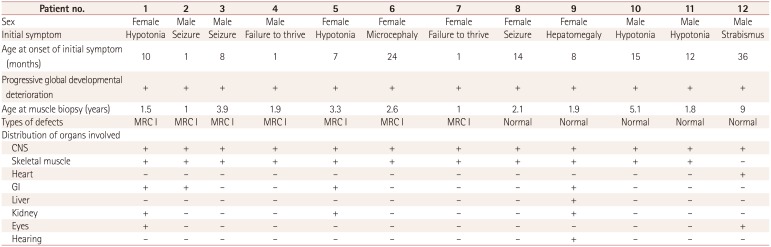
Twelve infants were enrolled in this study. They were initially evaluated for unexplained neurodegenerative symptoms, myopathies, or other progressive multiorgan involvement. Each patient underwent a biopsy of the quadriceps muscle when MD was suspected. Lactic acidosis was defined as an increase of more than twice the normal reference value. The level of serum creatine kinase was normal in all patients.
Biochemical enzyme assays of muscle tissue confirmed the presence of MRC I defects in 7 of the 12 patients. Only subjects confirmed by the assay as MRC I were categorized as patients in order to ensure homogeneity of the disease state. Mitochondrial enzyme functions were evaluated by analyzing the activities of reduced nicotinamide adenine dinucleotide (NADH)-coenzyme Q (CoQ) reductase (complex I), succinate-CoQ reductase (complex II), succinate-cytochrome c reductase (complex II and III), cytochrome c reductase (complex III), cytochrome c oxidase (complex IV), oligomycinsensitive ATPase (complex V), and citrate synthase. The activities of these complexes were assessed in isolated mitochondria obtained from muscle tissue using standard spectrophotometric assays, as described by Rustin et al.8 We defined MRC defects as a reduction of the residual enzyme activity to below 10% of that in controls. The seven patients with MRC I defects also satisfied the definitive diagnostic criteria described by Bernier et al.9 Five of the original 12 patients did not exhibit defects in biochemical enzyme assays and did not satisfy the criteria for MD, and so were categorized as the control group without MD.
Transmission electron microscopy was performed using samples from patients with MRC I defects and control patients without enzymatic defects. The study protocol was approved by the Institutional Review Board of Yonsei University Gangnam Severance Hospital, and written informed consent was obtained from the parents or legal guardians of all patients (IRB No. 3-2010-0190).
Sample preparation for electron microscopy
Samples were fixed in 2.5% glutaraldehyde mixed with 2% paraformaldehyde solution (0.1 M cacodylate buffer, pH 7.0) for 1 hour and then in 2% osmium tetroxide for 1 hour at 4℃. The samples were stained en bloc with 2% uranyl acetate, followed by dehydration with a graded acetone series and embedding in low-viscosity medium.
Conventional transmission electron microscopy and image analysis
Samples were sectioned at 60 nm using an ultramicrotome (MTXL, RMC, Tucson, AZ, USA). The sections were double-stained with 2% uranyl acetate for 20 minutes and lead citrate for 10 minutes, then viewed with the aid of transmission electron microscopy operating at 120 kV (Tecnai 12, FEI, Netherlands; H-7600, Hitachi, Tokyo, Japan).
The total number of intermyofibrillar mitochondria per 100 µm2 was counted in each group. The concentration of intermyofibrillar mitochondria was also checked in each patient with and without MRC I defects. Every sample was photographed within a randomly selected grid square. The total counts of mitochondria were divided by the total measured area in order to calculate the number of mitochondria per square micron. Finally, the mitochondria density was expressed as the mean number of mitochondria per 100 µm2. Statistical analysis was performed using Student's t-test.
The sizes of 50 randomly chosen mitochondria and lipid droplets were measured in each patient using the Image J program (National Institutes of Health). Mitochondria and lipid droplets were circled, and their actual size was calculated using a calibration grid. Values were represented as the mean individual size (in square microns) of mitochondria and lipid droplets. The statistical significance of differences between means was assessed by analysis of variance followed by Student's t-tests. A probability of less than 5% was considered significant (p<0.05). Statistical normalization was used to investigate the relationship between mitochondria and lipid droplets.
Three-dimensional structure of lipid droplets and mitochondria
For the reconstruction of the three-dimensional (3D) structure, electron tomography (H-7600) was performed with 60-nm-thick sections collected on formvar/carbon-coated copper slot grids and stained with uranyl acetate and lead citrate. Colloidal gold particles were applied to both sides of sections as fiducial markers. A series of 61 tilted images was recorded around a tilt axis over an angular range of 120° with a tilt interval of 2°. Images were aligned and surfacerendered models were produced using IMOD (The Mastronarde Group, Boulder, CO, USA).1011
RESULTS
Diagnosis of patients
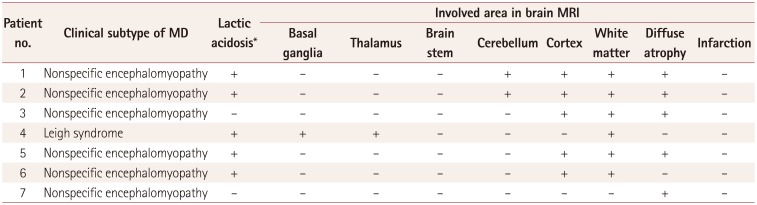
Central nervous system involvement was observed in all patients, with this involving multiple organs in most cases. All of the patients showed background slowing in electroencephalograms, which is consistent with encephalopathy, and various degrees of involvement in brain magnetic resonance imaging (MRI). Patients in both groups (patients with MRC I defects and control patients without enzymatic defects) showed various clinical characteristics (Table 1 and 2). The findings for all enzyme assays other than for MRC I defects were normal. One of the patients with MRC I defects was diagnosed with Leigh syndrome as a clinical subtype of MD, while the other six patients had nonspecific encephalopathy. The patient with Leigh syndrome exhibited typical findings of lactic acidosis and basal ganglia involvement in brain MRI. Light-microscopy examination of the muscle tissues revealed no ragged-red fibers. Modified Gomori trichrome and other special immunohistochemical staining procedures yielded normal results.
MRC I defects, mitochondrial size, and structural changes in cristae
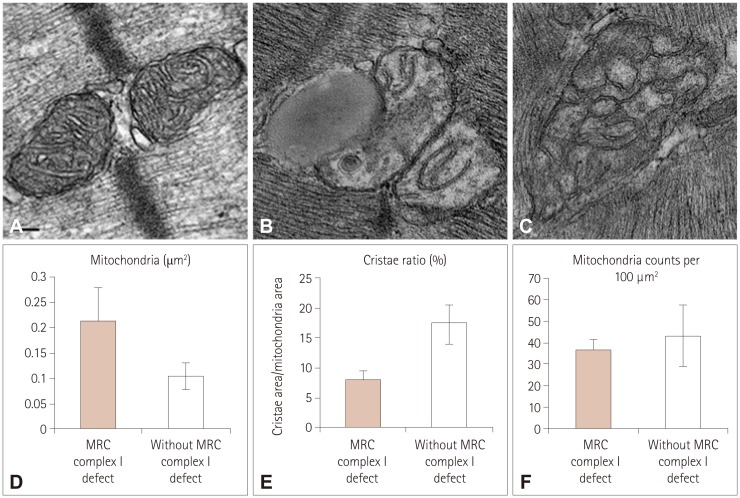
To determine whether MRC I defects caused ultrastructural changes, we compared the ultrastructure of skeletal muscle in the patients. Enzyme tests revealed that 7 of the 12 originally enrolled patients had MRC I defects (Table 1), while the remaining 5 patients were included as control individuals for comparison. Quantification of these changes showed differences in mitochondrial size and cristae area between muscles with and without MRC I defects (Fig. 1D and E), while there were no intergroup differences in mitochondrial numbers (Fig. 1F). The mean mitochondrial sizes were 0.21±0.07 and 0.10±0.03 µm2 in patients with and without I defects, respectively (Fig. 1D). Thus, the mitochondria in patients with MRC I defects were 53% larger than those in patients without such defects (p=0.005) (Fig. 1A-C). In patients with MD, the cristae area represented 17.4±3.0% of the total mitochondrial area in mitochondria from patients without MRC I defects and 7.8±1.8% in mitochondria from patients with these defects, representing a 2.2-fold difference (Fig. 1B, C, and E). Moreover, compared with the tubular structure of cristae in mitochondria from patients without MD (Fig. 1A), patients with MRC I defects exhibited elongated, curved cristae that were frequently stacked against one another (Fig. 1B). Other obvious structural changes included irregularly shaped mitochondria containing numerous internal vesicles (Fig. 1C).
MRC I defects and lipid droplets in muscle
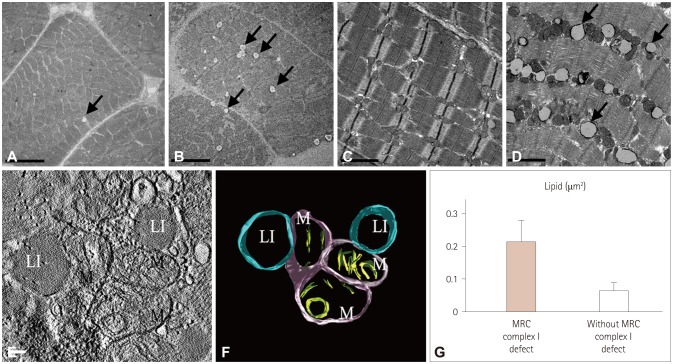
A particularly interesting finding was that ultrastructure images of skeletal muscle showed that the number of intramyocellular lipid droplets (IMCLs) was greater in patients with MRC I defects (Fig. 2B and D) than in those without defects (Fig. 2A and C). Lipid droplets were frequently observed adjacent to the mitochondria in two-dimensional images (Figs. 1B and 2D). The size of IMCLs differed significantly (Fig. 2G), being 0.2127±0.0462 and 0.0647±0.0139 µm2 in patients with and without MRC I defects, respectively, indicating a difference of more than threefold (Fig. 2G). Statistical normalization was applied to the data to study the relationship between structural changes of mitochondria and size increases in lipid droplets in patients. A positive correlation between lipid droplet size and mitochondrial size was observed consistently in all of the patients.
Lipid droplets were surrounded by one or multiple mitochondria (Fig. 2D). Electron tomography was applied to improve the resolution of the obtained images and thereby allow a more detailed structural analysis of lipid droplets and mitochondria. The electron tomograms showed that lipid droplets were in direct contact with mitochondria (Fig. 2E), and analysis of the 3D structure confirmed that the outer mitochondrial membrane was directly connected to the surrounding lipid droplets (Fig. 2F).
DISCUSSION
Mitochondrial volume homeostasis is a housekeeping cellular function that helps to regulate oxidative capacity, apoptosis, and mechanical signaling. Changes in the mitochondrial volume have been shown to be associated with a wide range of important biological functions and pathologies. To our knowledge, the present study is the first to investigate the mitochondrial size and ultrastructural features of skeletal muscle of infants with MRC I defects. The mitochondrial volume is primarily regulated by the potassium flux into and out of the matrix, and is controlled by the electrochemical potential. However, the mitochondrial volume may be altered in the presence of various disorders; for example, there are some reports of enlarged or swollen mitochondria resulting from functional disorders.121314 An increase in the mitochondrial volume has been shown to be related to a reduction in the mitochondrial membrane potential.15 Moreover, an increased mitochondrial volume is often observed after mitochondrial depolarization, mitochondrial calcium overload, or opening of the permeability transition pore.16 Another possible cause of mitochondrial swelling is the release of cytochrome c and apoptosis-inducing factor.17
The present study found significant increases in mitochondrial size in infants with MRC I defects but no definitive changes in the numbers of mitochondria. This finding could be due to the significant decrease in cristae. Abundant cristae are found in mitochondria from tissues having a high energy demand, and so decreases in cristae could be suggestive of the presence of functional defects.1819 The MRC plays a very important role in energy production and is mainly localized in the inner membrane, particularly within cristae.2021 Consequently, defects in the MRC could result in structural changes in mitochondria, particularly in cristae that are related to the oxidative capacity. When there is a lack of ATP synthase e or g subunits222324 and mitofilin, which is a part of the supramolecular complex of ATP synthase,111825 mitochondria manifest as an onion-like structure with decreased cristae and no cristae junctions. Enlarged mitochondria have also been observed in associated with a reduced cristae area, showing a honeycomb structure.26 The present study frequently observed stacked cristae with reduced cristae junctions (resembling an onion-like structure) and interconnected cristae (resembling a honeycomb, vesicle structure) in the mitochondria of patients with MRC I defects. These structural changes indicate the presence of functional defects and imply that MRC I defects may be directly linked to ATP synthase. Furthermore, defects in this complex may affect lipid metabolism in mitochondria. Such morphological changes in mitochondria have not been clearly reported as a tool for differentiating between pediatric and adult MD; however, changes in cristae area and mitochondrial size found in the tissues of patients with MRC I defects are of clinical importance, particularly in pediatric patients, and could indicate that MRC I defects are distinct from other types of MRC defects.
The mitochondrial membrane structure is dynamic and depends on the ATP level, apoptosis, oxidative stress, and aging.272829 Because the membrane dynamics of mitochondria affect mitochondrial function, more detailed analyses of morphological changes in the mitochondria of patients with MD have been performed. We applied electron tomography in order to improve the imaging resolution,30 which yielded detailed images of the mitochondrial structure and direct connections between the mitochondrial outer membrane and lipid droplets. Lipid droplets wrapped by mitochondria reflect the intimate functional relationship between these two structures,31 and these results were confirmed by statistical analysis. Statistical normalization suggested the presence of a mutual relationship between the increases in mitochondrial size and the number of lipid droplets. ATP is mainly produced by mitochondria via the utilization of glucose; however, other substances such as glycogen and lipid droplets can also be used to produce ATP. When skeletal muscle depends on lipids as an energy source, lipid accumulation may result from the impaired mitochondrial oxidation of fatty acids.3233 In addition, defects in lipid metabolism in mitochondria can affect mitochondrial transport to impair energy production, which is observed in progressive myopathies.32
Skeletal muscle is highly reliant on oxidative phosphorylation. Oxidative metabolism is linked to changes in mitochondrial structure and function. Although various changes in mitochondria have been reported in infants with mitochondrial dysfunction, no definitive characteristics have been consistently observed. Among the five complexes, MRC I (NADH: ubiquinone oxidoreductase) is the largest and most important mitochondrial enzyme. MRC I oxidizes NADH from the tricarboxylic acid cycle, promotes fatty-acid oxidation and glycolysis, reduces ubiquinone during the remaining steps of the respiratory chain, and transports protons across the inner mitochondrial membrane to support ATP synthesis. Defects in MRC I are the main well-known causes of MD.34 However, studies of rare diseases such as MD are restricted by the small number of affected patients. In the present prospective study, we examined fresh biopsies of skeletal muscles in infants with or without MRC I defects. Patients were diagnosed based on clinical symptoms, the findings of imaging studies and biochemical enzyme assays, and assessing the pathology and molecular biology. Diagnosing MD in infants is especially difficult due to atypical clinical presentations and similarities with other diseases.45
The present findings suggest that mitochondrial functional defects in MRC I can disrupt certain activities related to ATP synthesis, resulting in changes in skeletal muscle. Although the seven infants with MRC I defects in this prospective study might be representative of this unique population, the findings cannot be generalized owing to the rarity of the disease. Despite this limitation, this study has provided a valuable starting point for clinicians to diagnose MD precisely and understand the natural course of MRC I defects in the pediatric population. The ultrastructural changes in mitochondria and lipid droplets in infant patients with MRC I defects might be useful unique markers for detecting MD.
 XML Download