

 PDF
PDF ePub
ePub Citation
 Print
Print


INTRODUCTION
Cerebral small-vessel diseases (CSVDs) are defined as those involving a small perforating arteriole, which presents as cerebral microbleeds (CMBs), high-grade white-matter hyperintensities (HWHs), perivascular spaces (PVSs), and asymptomatic lacunar infarctions (ALIs) in brain magnetic resonance imaging (MRI).1 Although each CSVD can have a different impact on the clinical presentation, these individual types of CSVD have common risk factors or share similar mechanisms.23 Furthermore, they are also considered to be closely related to the risks of cognitive impairment, recurrent stroke, and growth of cerebral infarction at an early stage.145 Therefore, for predicting the prognosis after stroke, it may be reasonable to consider the various CSVDs as a single entity rather than separately.
A new scoring system called the total CSVD score has been proposed for capturing the overall effect of CSVD on the brain, rather than estimating only one or two individual CSVDs separately.6 This score has been linked with risk factors for CSVD and with cognitive dysfunction in lacunar stroke patients,67 and it might be helpful for the rapid quantification or stratification of CSVD.6 Moreover, because the scoring system represents the overall CSVD burden, which may influence the short- and long-term outcomes, it is possible that the total CSVD score is indicative of the mortality likelihood during follow-up after an acute stroke. However, no data supporting this have been reported previously.
We investigated whether the total CSVD score is associated with mortality during follow-up in patients with ischemic stroke.
METHODS
Study population
This study performed a retrospective analysis of prospectively collected data. Between January 2009 and December 2010, 1,215 consecutive patients with acute cerebral infarction or transient ischemic attack were admitted to our stroke center within 7 days after symptom onset.8 All of the patients were thoroughly evaluated during their hospitalization, and their demographic data, medical history, clinical manifestations, and vascular risk factors were recorded. According to the standard protocol of our stroke center, all patients underwent brain computed tomography (CT) and/or MRI, vascular imaging studies (digital subtraction angiography, magnetic resonance angiography, or CT angiography), chest radiography, 12-lead electrocardiography, and routine blood tests. Echocardiography was also performed as a standard evaluation. Most of the patients were admitted to the stroke unit and were kept under continuous electrocardiographic monitoring during their stay (average length=4.9 days).89
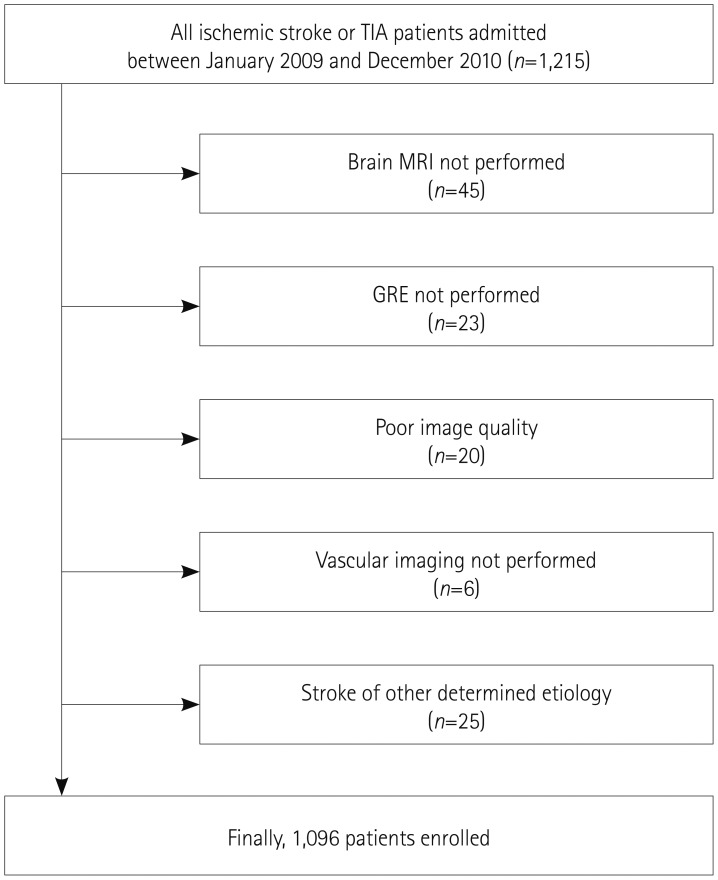
We excluded 45 of the 1,215 patients who did not undergo brain MRI due to the patient's refusal, claustrophobia, or presence of metallic material in the body, 23 with no available gradient recalled echo (GRE) images, 20 with poor image quality, and 6 with no vessel imaging data. Patients with stroke due to other determined etiology (n=25) were also excluded. These exclusions resulted in 1,096 patients finally being included in this study (Fig. 1).
The Institutional Review Board of Severance Hospital, Yonsei University Health System approved this study and waived the need for informed consent from the patients due to the its retrospective and observational design.
Brain MRI protocol and definition of CSVD
All MRI examinations were performed using a 3.0T MRI system (Achieva 3.0T, Philips Medical Systems, Best, the Netherlands; or MAGNETOM Trio 3.0T, Siemens, Amberg, Germany). MRI images were obtained parallel to the orbitomeatal line using the following parameters: time repetition (TR)/time echo (TE)=2,600–6,500/42–70 ms, interslice gap=2 mm, field of view (FOV)=230×230 mm, slice thickness= 5 mm, six different directions of diffusion gradient (x, y, z, xy, yz, and zx), and two b values (0 and 1000) for diffusion-weighted imaging (DWI); TR/TE=9,000/120 ms, FOV=230×230 mm, pixel spacing=0.449 mm/0.449 mm, and slice thickness=5 mm for fluid-attenuated inversion recovery (FLAIR) imaging; TR/TE=9,000/100 ms, FOV=230×230 mm, pixel spacing=0.240 mm/0.240 mm, and slice thickness=5 mm for T2-weighted images; and TR/TE=600/16 ms, FOV=250×250 mm, pixel spacing=0.449 mm/0.449 mm, and slice thickness=5 mm for GRE imaging.1011
CMBs manifested as punctate hypointense lesions smaller than 10 mm on GRE images.10 The extent of white-matter hyperintensities was determined on the FLAIR images for the periventricular white matter or deep white matter according to the Fazekas scoring system.12 A Fazekas score of 3 in periventricular white matter or ≥2 in deep white matter was considered to indicate HWHs. PVSs were defined as punctate and/or linear hyperintense lesions smaller than 3 mm on T2-weighted images in the basal ganglia.13 PVSs of grade 2-4 in the basal ganglia were defined as high-grade perivascular spaces (HPVSs), based on a previous report.3 ALIs were defined as a round or ovoid, subcortical, fluidfilled cavity (signal similar to cerebrospinal fluid) of hyperintense lesions ≥3 mm and <15 mm in size on T2-weighted images with low signal intensity on T1-weighted images, with no relevant history of symptoms or signs. The existence of CMBs, HWHs, HPVSs, and ALIs was determined outside the acute infarct area (based on DWI), and these lesions were independently investigated by two neurologists (T.J.S. and J.K.) who were blinded to the patient's clinical information.
The total CSVD score was calculated for each patient on an ordinal scale from 0 to 4 by counting the presence of each of the four MRI features of CSVD, with a score of 1 point applied for the presence of each of CMB, HWH, HPVS, and ALI.6 The interobserver agreement values for the presence of CMBs, HWHs, HPVSs, and ALIs were 0.912, 0.956, 0.938, and 0.888, respectively (all p<0.05). Any disagreement about the presence of CSVD was resolved by consensus.
Clinical and laboratory variables
We collected the patient's data for traditional vascular risk factors14 and the previous stroke. Hypertension was defined as being present when a patient had been taking blood-pressure-lowering agents or had a resting systolic blood pressure of ≥140 mm Hg or a diastolic blood pressure of ≥90 mm Hg in repeated measurements. Diabetes mellitus was diagnosed for a fasting blood glucose level of ≥7.0 mmol/L or treatment with oral glucose-lowering medications or insulin. Hyperlipidemia was diagnosed for a total cholesterol level of ≥6.2 mmol/L, a low-density lipoprotein cholesterol level of ≥4.1 mmol/L, or if the patient had taken lipid-lowering medications after a diagnosis of hyperlipidemia at admission. Patients were defined as smokers if they were current smokers or had stopped smoking within 1 year before the index stroke. Previous stroke was defined as having a previous stroke-like symptom combined with the presence of an ischemic lesion confirmed by brain imaging. A history of a transient ischemic attack was not included as a previous stroke. We further collected data relating to the patient's prior medication, coronary artery disease (a history of myocardial infarction, unstable angina, or angiographically confirmed occlusive disease of the coronary artery), metabolic syndrome, and the thrombolytic or endovascular reperfusion therapy used for the index stroke.
We also measured the white blood cell count, hemoglobin, hematocrit, and estimated glomerular filtration rate (eGFR) at admission. eGFR was calculated using the Modification of Diet in Renal Disease formula as eGFR=186.3×(serum creatinine-1.154)×(age-0.203)×(0.742 for women). All laboratory data were collected at admission.
Outcome measures
We recorded the date and cause of death for each patient using data from the Korean National Statistical Office, which are based on death certificates and are known to be reliable.17 The causes of death were classified according to the International Classification of Disease (10th revision) and categorized into fatal cardiovascular events (I21–I25, R96, I49, and I50), fatal ischemic stroke (I63 or I69.3), or fatal hemorrhagic stroke (I60–I62). The censoring date was set as December 31, 2013.
Statistical analyses
Statistical analyses were performed using the Windows SPSS software package (version 20.0, IBM Corporation, Armonk, NY, USA). The independent-samples t-test, Mann-Whitney U test, or Kruskal-Wallis test was used to compare continuous variables, and Fisher's exact test or the chi-square test was used to compare categorical variables, as appropriate. The association between the total CSVD score and mortality rate was analyzed using the Kaplan-Meier product-limit method with a log-rank test and multivariate Cox proportional-hazards regression. A probability value of p>0.05 was considered statistically significant.
RESULTS
Comparisons of baseline characteristics according to CSVD burden
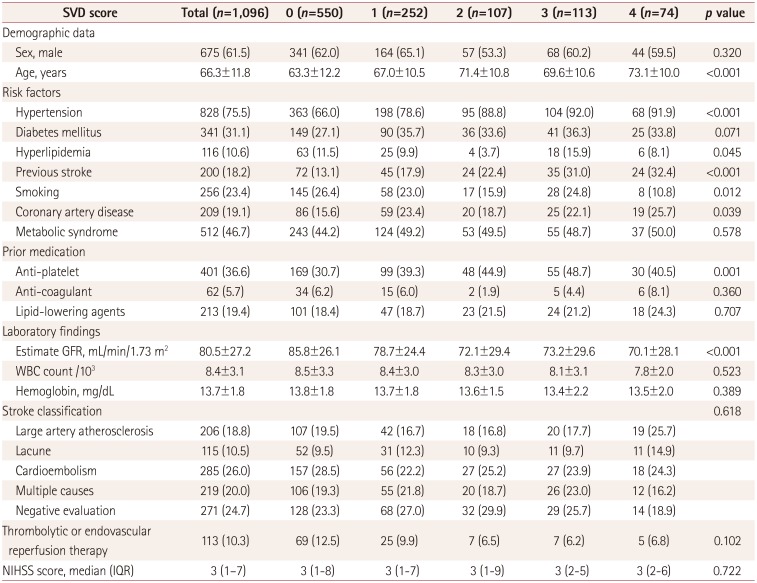
The baseline characteristics of the study population (n=1,096) are presented in Table 1. The patients were aged 66.3±11.8 years (mean±SD) and 61.5% (n=675) of them were male. In terms of stroke classification, cardioembolism (26.0%) was most common, followed by negative evaluation (24.7%), two or more causes identified (20.0%), large-artery atherosclerosis (18.8%), and lacune (10.5%).
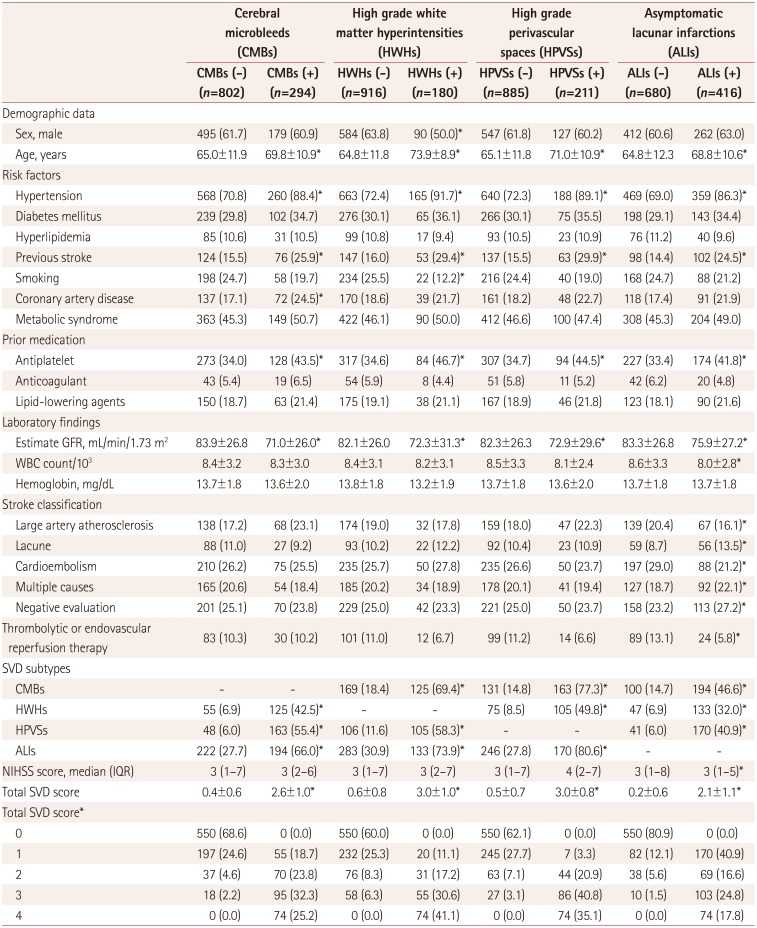
CMBs were found in 26.8% of the subjects (294/1,096), HWHs in 16.4% (180/1,096), HPVSs in 19.3% (211/1,096), and ALIs in 38.0% (416/1,096). Age, hypertension, previous stroke, and prior antiplatelet use were associated with the presence of any type of CSVD (Table 2). Patients with ALIs showed a lower initial stroke severity and more frequent lacunar stroke compared to those without ALIs (Table 2).
Five hundred and fifty patients (50.2%) had a total CSVD score of 0. ALIs were most commonly observed (67.5%) in the 252 patients with a score of 1. The most common combinations were CMBs+ALIs, in the 107 patients (32.7%) with a score of 2, and CMB+HPVSs+ALIs, in the 113 patients (51.3%) with a score of 3. Seventy-four patients (6.8%) had all four types of CSVD. A higher total CSVD score was associated with advanced age, hypertension, previous stroke, not smoking, coronary artery disease, prior antiplatelet use, and decreased eGFR, while initial stroke severity and stroke mechanism did not vary with the total CSVD score (Table 1).
Association between CSVD and mortality during follow-up
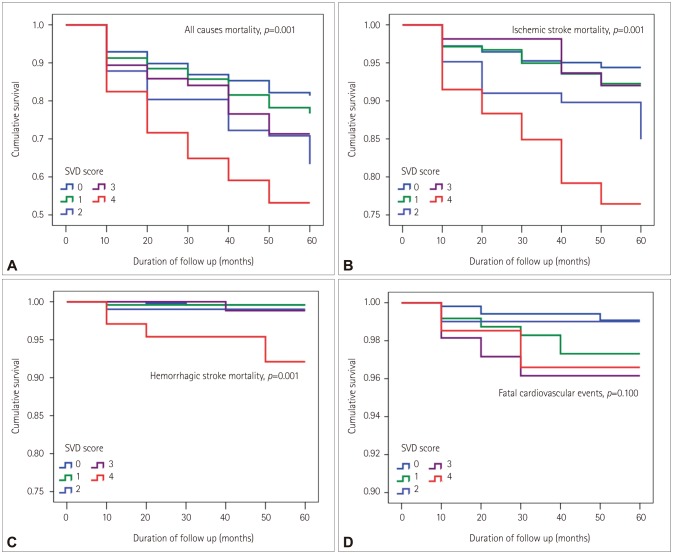
Among the total of 1,096 patients, 240 (21.9%) died at a median follow-up of 3.8 years (interquartile range=3.2–4.3 years); 77 (32.1%) patients died of fatal ischemic stroke, 17 (7.1%) of fatal cardiovascular events, and 9 (3.8%) of fatal hemorrhagic stroke. Among the other causes of death, malignancy was the most common, followed by renal failure and diabetes mellitus (Supplementary Table 1 in the online-only Data Supplement). The Kaplan-Meier curve showed that all prespecified outcomes (all-cause mortality, fatal ischemic stroke, and fatal hemorrhagic stroke) other than fatal cardiovascular events were associated with the CSVD score (Fig. 2).
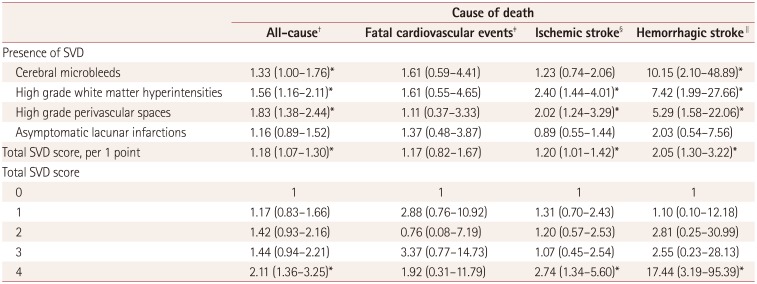
In multivariate Cox regression analyses adjusting for age, sex, and variables that were significant at p<0.1 in the univariate analysis, the presence of CMBs, HWHs, or HPVSs was independently associated with all-cause mortality (Table 3). Fatal ischemic stroke was related to HWHs or HPVSs, while CMBs were associated with fatal hemorrhagic stroke during the long-term follow-up (Table 3). In addition, the total CSVD score (especially one of 4) was an independent predictor for all-cause mortality [hazard ratio (HR)=2.11, 95% confidence interval (CI)=1.36–3.25], fatal ischemic stroke (HR=2.74, 95% CI=1.34–5.60), and fatal hemorrhagic stroke (HR=17.44, 95% CI=3.19–95.3), but not for fatal cardiovascular events (HR=1.92, 95% CI=0.31–11.79) (Table 3).
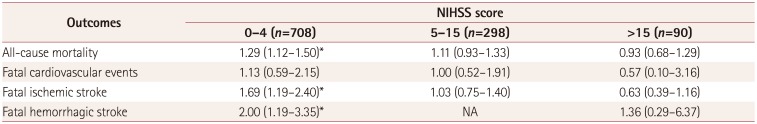
The long-term prognosis according to the initial stroke severity was investigated by dividing the study population into three groups: mild (NIHSS score=0–4), moderate (NIHSS score=50–15), and severe (NIHSS score>15). There was no evidence of an interaction between the initial stroke severity and the total CSVD score. Multivariate analysis showed that the total CSVD score (as a continuous variable) was significantly associated with mortality other than fatal cardiovascular events during the follow-up in patients with mild severe stroke severity but not in those with severe stroke severity at admission (Table 4).
DISCUSSION
Previous studies have proposed using the MRI-based total CSVD score for evaluating the total burden of CSVDs,6 but no data on the association between this scoring system and clinical outcomes during follow-up have been reported previously. In this study we found that the total CSVD score was associated with mortality other than fatal cardiovascular events during the follow-up. In addition, a total CSVD score of 4 was associated with long-term all-cause mortality as well as death from fatal ischemic or hemorrhagic stroke.
About half of the stroke population had CSVDs in this study, with ALIs being most common, followed by CMBs, HPVSs, and HWHs. Previous studies have found that many patients (up to 60%) with evident stroke or cardiovascular diseases had ALIs,1819 and that ALIs were the most common type of CSVD in stroke patients.20 These results were similar to our own, although the prevalence of specific CSVDs can vary widely depending on the underlying conditions, the imaging modality, and the population studied.4,19
Previous studies showed that certain CSVDs such as HWHs, CMBs, and ALIs were independent predictors for a poor outcome after index stroke2122 or the long-term fatal outcome.11232425 However, there has been no information on the impact of the total burden of CSVDs on clinical outcomes despite various types of CSVDs commonly coexisting and the clinical outcome possibly being determined by their combined effect. Considering the potential impact of the underlying total burden of CSVD on cognitive decline and physical disability,13 patients with a higher total CSVD score might remain undertreated with rehabilitation or medication for secondary stroke prevention. In addition, severe CSVD could be a marker of an impaired neurovascular network, which could inhibit plasticity and adversely affect the recovery after stroke.26 A high CSVD burden has also been associated with other neurodegenerative diseases13 that have a detrimental effect on the outcome after stroke. Along with these previous reports, our results showed that the total burden of CSVD can affect the outcomes after index stroke.
In should be noted that in an acute stroke population such as the present one, the potential impact of the CSVD burden on clinical outcome could be attenuated due to the presence of other stronger factors affecting the outcomes, such as the initial stroke severity.1023 We found that an impact of the total CSVD burden was not present in patients who had severe stroke. This means that the impact of the CSVD burden on outcome can differ with the patient's characteristics, including age and the severity of the index stroke.
The mortality rate in this study was higher than in previous studies.2728293031 Stroke outcomes (including mortality) can vary with the patient's characteristics, stroke subtype, and acute stroke care. Our study population had a higher age and higher proportion of the cardioembolic or multiple-causes stroke subtype compared to other previous studies,3031 which may have affected the present results.
This study was subject to some limitations. First, it had a retrospective design, which is a substantial weak point of this type of study. Second, we did not investigate stroke recurrence, and so it was uncertain whether the higher mortality rate in patients with a higher burden of CSVDs was due to increased stroke recurrence. Third, the degree of adherence to medication used for stroke prevention, which is another factor affecting recurrent ischemic or hemorrhagic stroke, was not investigated during the follow-up. Fourth, we did not exclude patients with previous disability before index stroke. Fifth, we cannot guarantee that each CSVD subtype, particularly ALIs, was truly asymptomatic, although we did determine the presence of previous stroke based on patient recall. A neurologic deficit that is not recognized as being due to a previous stroke might affect the clinical stroke outcome.32 Sixth, the smallness of the sample for hemorrhagic stroke mortality means that the associated data should be interpreted with caution. Lastly, our study population included only Asian (Korean) patients. This homogeneity of the study population should be considered when interpreting our results because the association between CSVD and clinical outcome could differ with ethnicity.33
In conclusion, this study has shed light on the association of the total CSVD score with mortality during follow-up in acute ischemic stroke patients. The different types of CSVD frequently coexist, and the simple scoring system that combines the various types of CSVD in a single scale is easy to use. Our findings suggest that this scoring system could be useful for risk stratification in future clinical research.
 XML Download