Journal List > J Clin Neurol > v.13(2) > 1048021

Lee, Ryoo, Park, Jeong, and Alzheimer's Disease Neuroimaging Initiative: Morphological and Microstructural Changes of the Hippocampus in Early MCI: A Study Utilizing the Alzheimer's Disease Neuroimaging Initiative Database

Abstract

Background and Purpose

With the aim of facilitating the early detection of Alzheimer's disease, the Alzheimer's Disease Neuroimaging Initiative proposed two stages based on the memory performance: early mild cognitive impairment (EMCI) and late mild cognitive impairment (LMCI). The current study was designed to investigate structural differences in terms of surface atrophy and microstructural changes of the hippocampus in EMCI and LMCI.

Methods

Hippocampal shape modeling based on progressive template surface deformation was performed on T1-weighted MRI images obtained from 20 cognitive normal (CN) subjects, 17 EMCI patients, and 20 LMCI patients. A template surface in CN was used as a region of interest for diffusion-tensor imaging (DTI) voxel-based morphometry (VBM) analysis. Cluster-wise group comparison was performed based on DTI indices within the hippocampus. Linear regression was performed to identify correlations between DTI metrics and clinical scores.

Results

The hippocampal surface analysis showed significant atrophies in bilateral CA1 regions and the right ventral subiculum in EMCI, in contrast to widespread atrophy in LMCI. DTI VBM analysis showed increased diffusivity in the CA2–CA4 regions in EMCI and additionally in the subiculum region in LMCI. Hippocampal diffusivity was significantly correlated with scores both for the Mini Mental State Examination and on the Modified Alzheimer Disease Assessment Scale cognitive subscale. However, the hippocampal diffusivity did not vary significantly with the fractional anisotropy.

Conclusions

EMCI showed hippocampal surface changes mainly in the CA1 region and ventral subiculum. Diffusivity increased mainly in the CA2–CA4 regions in EMCI, while it decreased throughout the hippocampus in LMCI. Although axial diffusivity showed prominent changes in the right hippocampus in EMCI, future studies need to confirm the presence of this laterality difference. In addition, diffusivity is strongly correlated with the cognitive performance, indicating the possibility of using diffusivity as a biomarker for disease progression.

INTRODUCTION

Alzheimer's disease (AD) is a neurodegenerative disease that is the most common type of dementia, the main symptom of which is cognitive decline associated with memory failure. It is unclear how AD will progress, and the clinical symptoms appear later than the disease onset, which makes early diagnosis and intervention difficult.1,2 An earlier diagnosis could help to reduce cognitive deterioration and/or treatment costs. It is also important to understand the disease progression when performing clinical trials.
To overcome these problems, the Alzheimer's Disease Neuroimaging Initiative (ADNI) proposed two stages–early mild cognitive impairment (EMCI) and late mild cognitive impairment (LMCI)–based on the education-adjusted scores of the Wechsler Memory Scale Logical Memory II.3,4 Patients with EMCI and LMCI were subdivided solely on the Logical Memory II score of the Wechsler Memory Scale, but other biomarkers such as the hippocampal volume and cerebrospinal fluid (CSF) biomarkers also showed empirical trajectories suggesting that EMCI could be a transitional stage.5 Thus, understanding differences between EMCI and LMCI might facilitate the understanding of disease progression specifically in mild cognitive impairment (MCI).
Shape-based morphometry has often been applied for analyzing structural changes in subcortical structures, including in the hippocampus.6,7,8,9,10,11,12 Researchers have previously used volumetric analyses for quantitatively assessing hippocampal atrophy as a marker for the progression of AD.13,14 However, changes in volume in certain regions can be compensated for by atrophy or dilation in other locations, which may obscure changes in the total volume. This indicates that volumetric analyses may not reveal the true association between local deformations and the disease or risk factors.12 Additionally, volumetric analyses do not give information about the morphological changes that characterize the appearance and progression of neurodegenerative diseases. A precise analysis of these changes could provide useful early diagnostic information and help to identify individuals at risk.
Early studies using diffusion-tensor imaging (DTI) in AD focused particularly on fractional anisotropy (FA). However, some studies15,16,17 found this measure to be insensitive to early white-matter disruption in AD. Furthermore, most of the relevant studies18,19,20,21,22,23,24 have focused on the changes in large-scale white-matter tracts. This approach is based on the idea that white-matter changes could be the result of Wallerian degeneration, which involves earlier loss of cortical neurons.25,26 Also, clinical abnormalities have been shown to be correlated more strongly with gray-matter changes than with white-matter changes,27 and the presence of cortical gray-matter damage has been demonstrated by diffusion MRI in multiple sclerosis.25
A few studies28,29,30,31,32,33 have investigated microstructural changes within the hippocampus in AD. They demonstrated increased mean diffusivity (MD) in the left hippocampus to be the best predictor of disease progression. However, these analyses relied on manual segmentation of the hippocampus or did not use masking to isolate the hippocampus. This limitation may be attributed to the risk of partial volume effects and the complexity of segmentation.
In the present study we adopted a novel segmentation method that involves subtle volume extraction and better shape reconstruction to input images compared to previous methods.12 We also decomposed the MD into axial diffusivity (AxD) and radial diffusivity (RD) in order to assess the gray-matter abnormalities in EMCI. The overall aim of this study was to characterize the morphometric and microstructure changes in subregions of the hippocampus in EMCI in order to identify the early signature of AD.

METHODS

Demographics

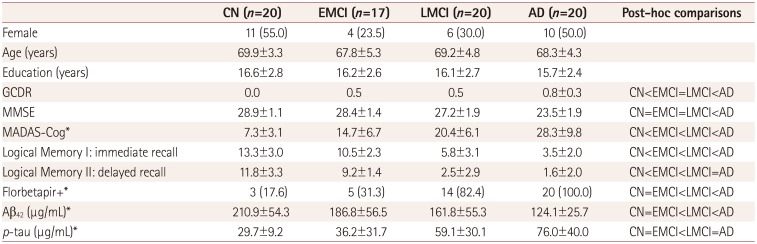
In the phase ADNI2 database, subjects who underwent both T1-weighted and DTI with a visit identifier of “ADNI2 Screening MRI-New Patient” comprised 49 cognitive normal (CN) subjects, and 27 EMCI, 34 LMCI, and 47 AD patients. As an initial study, subjects were sampled with the following criteria: aged 60–75 years, education duration of 12–20 years, and gender matching within groups. Note that the lack of female data for EMCI limited the number of subjects in each group.
The T1-weighted and DTI images of 77 subjects (20 CN, 17 EMCI, 20 LMCI, and 20 AD) were gathered from the ADNI (http://adni.loni.usc.edu). The MRI protocol is described elsewhere.34 We only used the images acquired at the first visit of each subject. The following clinical and neuropsychological assessments were included: global Clinical Dementia Rating, Mini Mental State Examination (MMSE), Modified Alzheimer's Disease Assessment Scale-Cognitive subscale (MADAS-Cog), and Wechsler Memory Scale Logical Memory I & II. Florbetapir PET image data were acquired from the ADNI database with a positivity cutoff of 1.11. The CSF amyloid beta and phosphorylated tau concentrations were measured using the multiplex xMAP Luminex platform. Full details of the analysis can be found online (http://adni.loni.usc.edu/methods/biomarker-analysis/).
The demographics of the included subjects are presented in Table 1. Note that some of the subjects did not undergo a MADAS-Cog assessment, florbetapir PET imaging, or CSF screening, since these interventions are recommended for detailed assessments rather than being applied in routine care settings. Those subjects who did not undergo a MADAS-Cog assessment were excluded from the correlation analysis with clinical scores.

Surface morphometry

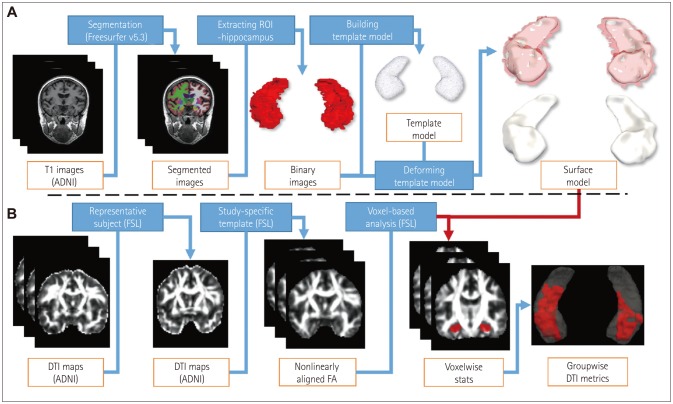
We used progressive template surface deformation to generate a hippocampal template.12 This method involves building the pairwise correspondence of a template surface by minimizing geometric distortion while robustly restoring the shape characteristics of the individual subject. First, we constructed an average template surface of the CN group to use as a region of interest for DTI voxel-based morphometry (VBM) analysis on Montreal Neurological Institute (MNI) 1-mm isotropic space. We then compared T1-weighted MRI hippocampal subfields between the EMCI and LMCI groups (Fig. 1A). Significant dilation was not detected in any region, and so we assumed that the changes in morphometry were due to regional atrophy. All statistical analyses were controlled for age, gender, and years of education. To delineate the surface of the hippocampal subfields, we segmented the average template surface following rules from an anatomy atlas textbook, as described previously.35

DTI analysis

For DTI analysis, the data from an additional 20 AD patients were included to show the characteristics of disease progression. The functional MRI of the brain software library (FSL) Tract-Based Spatial Statistics (TBSS) pipeline was used to construct a study-specific template, and DTI index maps were registered to this template in an MNI space.36 Clusterwise group comparisons of DTI metrics within the hippocampus were performed using the FSL randomise function with the Threshold-Free Cluster Enhancement37 option along 10,000 permutations33 (Fig. 1B). To further analyze the relationship between microstructural integration changes with clinical scores, linear regressions were performed to identify significant clusters. MMSE and MADAS-Cog scores were used for the general clinical assessments. All statistical analyses were controlled for age, gender, and years of educaeducation, and clusters smaller than 100 mm3 were discarded.

RESULTS

Hippocampal volume

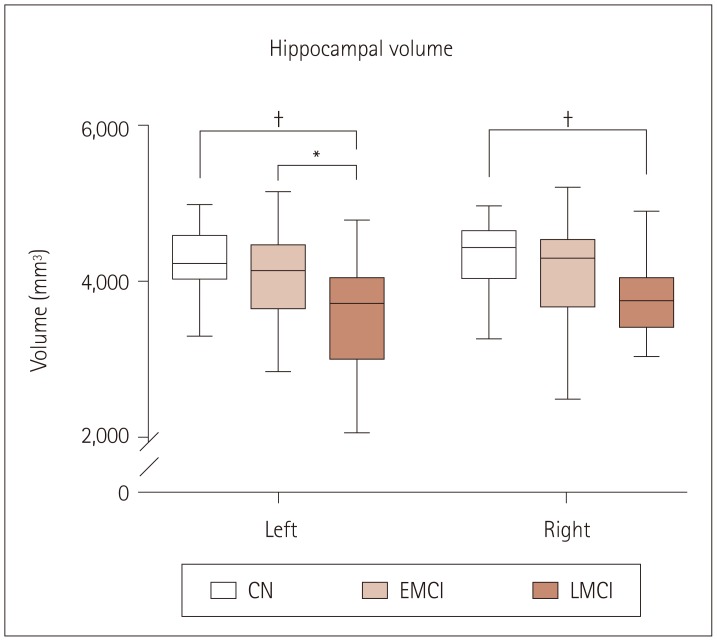
We compared the hippocampal volume using Freesurfer segmentation in each group with regard to laterality. Left hippocampal volumes in EMCI did not differ from those in CN, while those in LMCI were smaller than those in CN (p<0.001) and EMCI (p<0.05). Right hippocampal volumes in EMCI did not differ from those in CN and LMCI. The volumes in LMCI were smaller than those in CN in both hippocampi (p<0.001) and smaller than those in EMCI in the left hippocampus (p<0.05) (Fig. 2).

Hippocampal shape modeling

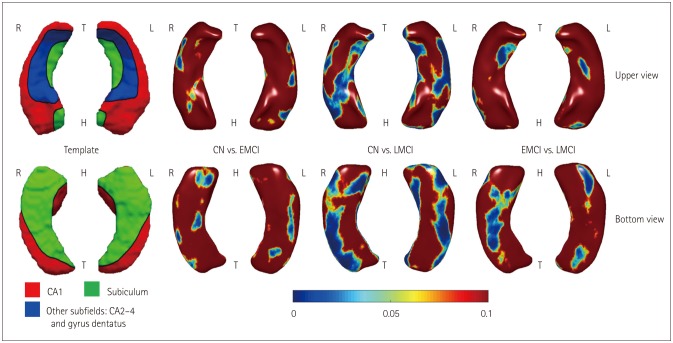
Hippocampal surface analysis revealed significant atrophy in bilateral CA1 regions and the right ventral subiculum in EMCI compared to CN, and in bilateral CA1 and CA2–CA4 regions and the subiculum in LMCI. Direct comparison of EMCI and LMCI revealed that atrophy in the right ventral subiculum part of the hippocampus was more significant in LMCI (uncorrected p<0.05) (Fig. 3).

Hippocampal microstructural changes

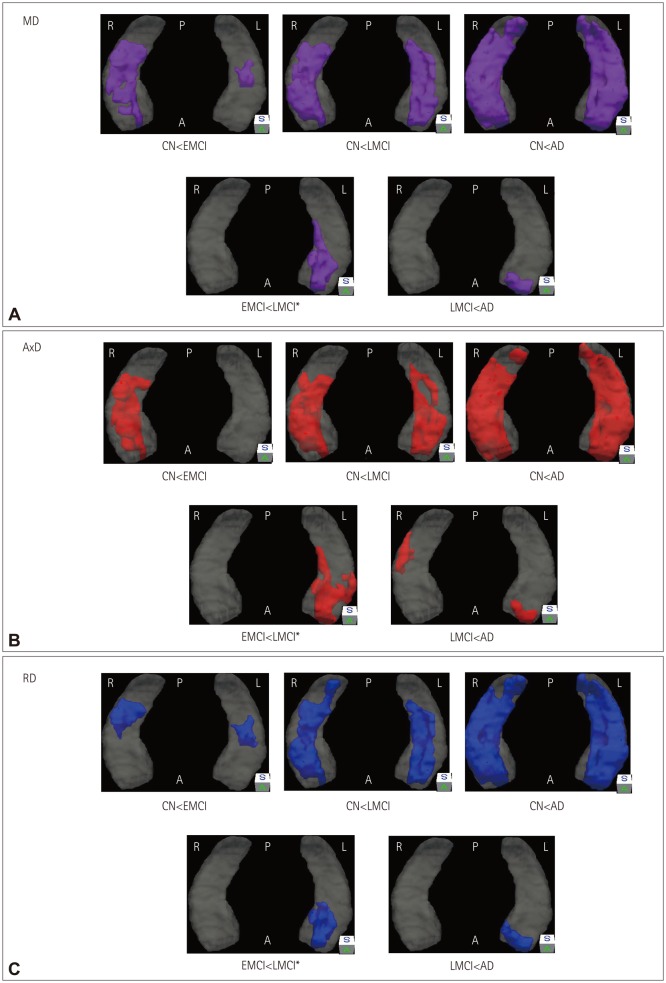
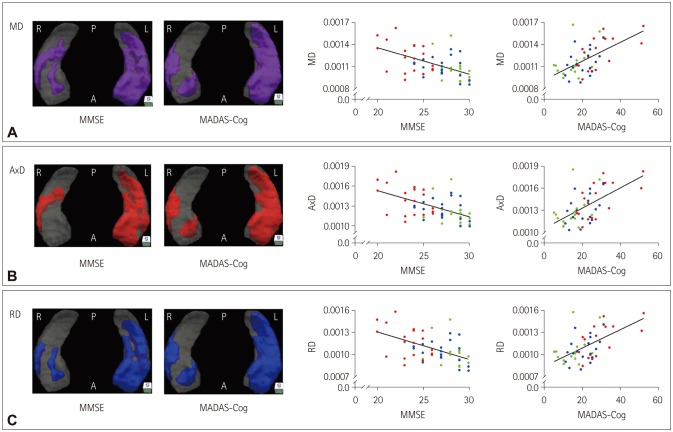
We investigated differences in the diffusion parameters in the gray matter, which reflect microstructural changes. This is not possible via the conventional TBSS approach, which focuses only on white-matter areas, and so we examined voxelwise DTI metrics within the gray matter. The DTI VBM results indicated that the regions of increased DTI metrics grew larger with the disease stage onward (Fig. 4). Note that there were no significant group differences in FA.
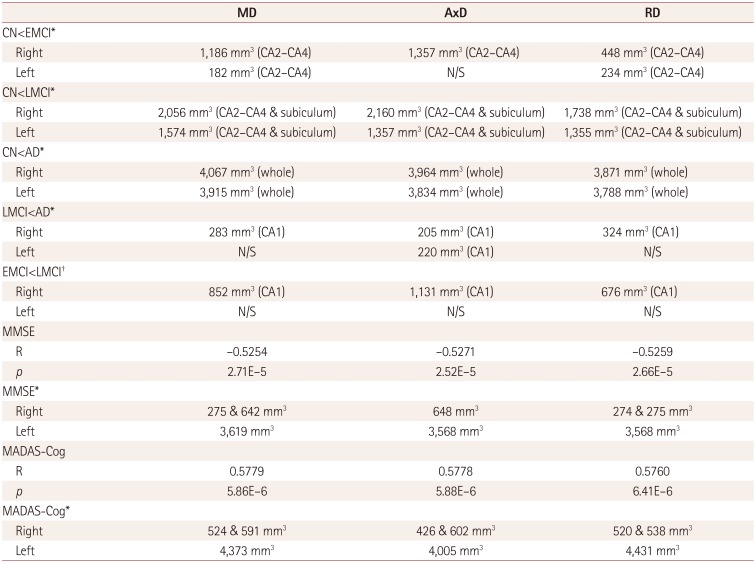
MD was higher in EMCI than in CN in the bilateral CA2–CA4 regions, higher in LMCI than in CN in the bilateral CA2–CA4 and subiculum regions, higher in AD than in CN in most hippocampal regions, and higher in AD than in LMCI in the left hippocampal CA1 region [p<0.05, familywise error (FWE) corrected]. Direct comparison of EMCI and LMCI revealed that the MD was higher in the left hippocampal CA1 region in LMCI (uncorrected p<0.05) (Fig. 4A, Table 2).
AxD was higher in EMCI than in CN in the right CA2–CA4 regions, higher in LMCI than in CN in the bilateral CA2–CA4 and subiculum regions, higher in AD than in CN in most hippocampal regions, and higher in AD than in LMCI in the bilateral CA1 regions (p<0.05, FWE-corrected). Direct comparison of EMCI and LMCI revealed that AxD was higher in the left hippocampal CA1 region in LMCI (uncorrected p<0.05) (Fig. 4B, Table 2).
RD was higher in EMCI than in CN in the bilateral CA2–CA4 regions, higher in LMCI than in CN in the bilateral CA2–CA4 and subiculum regions, higher in AD than in CN in most hippocampal regions, and higher in AD than in LMCI in the left hippocampal CA1 region (p<0.05, FWE-corrected). Direct comparison of EMCI and LMCI revealed that RD was higher in the left hippocampal CA1 region in LMCI (uncorrected p<0.05) (Fig. 4C, Table 2).

Correlations between microstructural changes and clinical scores

Clusters correlated with the MMSE and MADAS-Cog clinical scores were found in the hippocampus in the EMCI, LMCI, and AD groups (Fig. 5, Table 2). The scatter plots in that figure show linear relationships between diffusivity and clinical scores. Note that there was no significant correlation with FA.
MD within the hippocampus showed significant correlations with the MMSE and MADAS-Cog scores (p<0.05, FWE-corrected). Using the mean MD within a cluster to calculate linear relationships yielded R=-0.5254 and p=2.71×10⁻⁵ for the MMSE score, and R=0.5779 and p=5.86×10⁻⁶ for the MADAS-Cog score (Fig. 5A, Table 2).
AxD within the hippocampus showed significant correlations with the MMSE and MADAS-Cog scores (p<0.05, FWE-corrected). Using the mean AxD within a cluster to calculate linear relationships yielded R=-0.5271 and p=2.52×10⁻⁵ for the MMSE score, and R=0.5778 and p=5.88×10⁻⁶ for the MADAS-Cog score (Fig. 5B, Table 2).
RD within the hippocampus showed significant correlations with the MMSE and MADAS-Cog scores (p<0.05, FWE-corrected). Using the mean RD within a cluster to calculate linear relationships yielded R=-0.5259 and p=2.66×10⁻⁵ for the MMSE score, and R=0.5760 and p=6.41×10⁻⁶ for the MADAS-Cog score (Fig. 5C, Table 2).

DISCUSSION

This study aimed to identify the features of EMCI in terms of hippocampal morphology and microstructural changes. As described in the Introduction, we addressed the earlier detection of MCI with respect to structural changes in the hippocampus. While several studies have examined changes in EMCI, significant EMCI-related anomalies are not well documented. Moreover, the present study is the first to reveal both surface deformation and microstructural changes in the hippocampus in EMCI. The findings of this study provide additional knowledge about earlier MCI-related changes in the structure of the hippocampus.
The adoption of progressive template surface deformation made it possible to identify the changes in EMCI that were not detected by conventional volumetric analysis (Figs. 2 and 3). Although we could identify the morphometric changes in EMCI, these were related to disease progression rather than being a characteristic of EMCI. Atrophy in EMCI was present in the hippocampal CA1 region and the right ventral subiculum, which is in accordance with previous reports38,39 of amnestic MCI (aMCI) changes. In addition, the accumulation of neurofibrillary tangles in specific hippocampal subfields and the associated neuronal loss are well documented. The presence of tangles has typically been reported to occur first in the entorhinal cortex, followed by spreading to the subiculum and CA1, then to CA2 and CA3, and finally to CA4.40 A postmortem study of AD brains also found that the subiculum and CA1 were the most affected regions.41,42 These findings confirm that EMCI may predate LMCI in the perspective of AD progression.
LMCI was characterized by a volume decrease in the left hippocampus but additional atrophy relative to EMCI in the right hippocampus (Figs. 2 and 3). A previous study43 found left-less-than-right asymmetry of the hippocampal atrophy as a characteristic change in aMCI. However, one study44 found that right hippocampal changes can occur up to 10 years before the clinical onset of AD. Although that study employed a volumetric analysis, its findings suggest that damage to the right hippocampus characterizes a transition from healthy aging to MCI. This discrepancy could also plausibly be explained based on the characteristics of aMCI patients or differences in difficulties between verbal and visual memory tests. Impairments in verbal memory would presumably be detected more easily by caregivers than those of visual memory. Thus, there is a greater likelihood of including verbal-type aMCI–which would be associated with greater atrophy in the left hippocampus–than visual-type aMCI according to previous studies. As a result, left-right asymmetry of the hippocampus could be collective changes in EMCI and LMCI.
Our DTI analysis also revealed microstructure changes in the hippocampus. DTI is commonly used to measure the large-scale integrity of the white matter. However, there have been recent studies28,29,30,31,32,33 of microstructural changes within the gray matter. In the present study we found progressively larger regions of increased diffusivity during the disease progression, starting from the CA2–CA4 regions in EMCI to the bilateral CA2–CA4 and subiculum regions in LMCI (Fig. 4). While macroscopic changes in EMCI and LMCI showed right hippocampal surface atrophy, microscopic changes were characterized by left hippocampal gray-matter abnormalities. Considering the increased AxD in the right hippocampal CA2–CA4 regions, with mild atrophy in the CA1 region and the subiculum in EMCI, microscopic changes may precede those of surface atrophy. Furthermore, these differences in morphometry and microstructure could represent early changes in MCI. These findings might indicate that microstructural changes such as synaptic loss, neuronal soma changes, and neuronal disorganization occur along with the neuronal loss in the hippocampus.45
Hippocampal asymmetry was also found in the linear relationship between diffusivity and clinical score (Fig. 5), which is consistent with the finding of den Heijer et al.46 The diffusivity in a relatively small area of the right hippocampus was correlated with the clinical scores, and this might be due to earlier gray-matter disruption in the right hippocampus in EMCI. Hippocampal dissociation was previously demonstrated using optogenetics in mice.47 That study showed that optogenetic silencing of either the left or right hippocampal CA3 region impaired the short-term memory, while only left hippocampal CA3 silencing impaired the long-term memory. Considering this dissociation, we suggest that early gray-matter abnormalities in the right hippocampal CA2–CA4 regions in EMCI can cause short-term memory loss while long-term memory in MCI remains intact.
Previous studies28,29,30,31,32,33 have mainly found increased MD within the hippocampal gray matter, along with no AxD changes. An increase in MD is often attributed to the progressive loss of cellular barriers or an increase in extracellular water content, such as occurs during neurodegeneration.48,49,50 However, our findings showed significant overlap between MD and AxD, with a relatively partial overlap between MD and RD. Considering that MD is the combination of AxD and RD, the main difference in MD could be due to AxD changes (Fig. 4, Table 2). A recent study51 found negative correlations between the traverse relaxation rate (R2) and DTI eigenvalues both in vitro and in vivo. R2 is the reciprocal of the transverse relation time (T2) multiplied by 1,000 ms/s. In the presence of damage, this measure decreases as the amount of tissue water increases, which reflects abnormalities in the structural integrity of tissues.51,52,53,54 Rulseh et al.51 found lambda 3 to be the most sensitive index for R2. However, considering RD as a combination of lambda 2 and 3, its sensitivity might be lower than that of lambda 1, which corresponds to AxD. Thus, to explain the elevation of water content as well as tissue damage, AxD could be a better index of neuronal damage within hippocampal gray-matter abnormalities.
This study was subject to several limitations. First, the number of subjects included in the analysis was small in order to observe progressive changes in MCI. As an initial study, we sought to control age, years of education, and gender in the cohort, while targeting subjects who were newly added in the ADNI2 phase in 2014. However, it was difficult to control the gender distribution in the EMCI group. Moreover, it is well known that males show higher diffusion properties than females, which made gender control a crucial factor in this study. We therefore targeted a rather small number of subjects in each group in order to control gender. Second, the initial design of this study did not consider subject inclusion criteria such as AD conversion or positivity for AD biomarkers. In order to focus on progressive changes, potential subjects who may progress to AD should be considered. However, screening was applied only once without follow up in several subjects in this study, or only MRI data were available. Lastly, a longitudinal study involving LMCI convertors from EMCI could better capture the progressive changes in MCI subtypes. Rather than group comparisons of EMCI and LMCI, consecutive changes within the same subjects should be considered in future studies.
In conclusion, we have investigated morphological and microstructural changes of the hippocampal surface in EMCI using structural MRI and DTI. EMCI showed hippocampal surface changes mainly in the CA1 region and the right ventral subiculum, and diffusivity increases in the CA2–CA4 regions. In addition, the diffusivity results showed laterality changes (especially in AxD) in EMCI. These results indicate that certain regions of the right hippocampus are affected earlier than those in the left hippocampus. However, further studies are needed to confirm these laterality changes. We also demonstrate that the diffusivity in the hippocampus is strongly correlated with the cognitive performance, indicating the possibility of using diffusivity as a biomarker for AD progression.

Acknowledgements

This research was supported by a grant from the Korea Health Technology R&D Project through the Korea Health Industry Development Institute (KHIDI), funded by the Ministry of Health and Welfare, Republic of Korea (grant number: HI14C2768).
Data collection and sharing for this project was funded by the Alzheimer's Disease Neuroimaging Initiative (ADNI) (National Institutes of Health Grant U01 AG024904) and DOD ADNI (Department of Defense award number W81XWH-12-2-0012). ADNI is funded by the National Institute on Aging, the National Institute of Biomedical Imaging and Bioengineering, and through generous contributions from the following: AbbVie, Alzheimer's Association; Alzheimer's Drug Discovery Foundation; Araclon Biotech; BioClinica, Inc.; Biogen; Bristol-Myers Squibb Company; CereSpir, Inc.; Cogstate; Eisai Inc.; Elan Pharmaceuticals, Inc.; Eli Lilly and Company; EuroImmun; F. Hoffmann-La Roche Ltd. and its affiliated company Genentech, Inc.; Fujirebio; GE Healthcare; IXICO Ltd.; Janssen Alzheimer Immunotherapy Research & Development, LLC.; Johnson & Johnson Pharmaceutical Research & Development LLC.; Lumosity; Lundbeck; Merck & Co., Inc.; Meso Scale Diagnostics, LLC.; NeuroRx Research; Neurotrack Technologies; Novartis Pharmaceuticals Corporation; Pfizer Inc.; Piramal Imaging; Servier; Takeda Pharmaceutical Company; and Transition Therapeutics. The Canadian Institutes of Health Research is providing funds to support ADNI clinical sites in Canada. Private sector contributions are facilitated by the Foundation for the National Institutes of Health (www.fnih.org). The grantee organization is the Northern California Institute for Research and Education, and the study is coordinated by the Alzheimer's Therapeutic Research Institute at the University of Southern California. ADNI data are disseminated by the Laboratory for Neuro Imaging at the University of Southern California.

Notes

Conflicts of Interest: The authors have no financial conflicts of interest.

References

1. Jack CR Jr, Knopman DS, Jagust WJ, Shaw LM, Aisen PS, Weiner MW, et al. Hypothetical model of dynamic biomarkers of the Alzheimer's pathological cascade. Lancet Neurol. 2010; 9:119–128. PMID: 20083042.
crossref
2. Shim YS, Morris JC. Biomarkers predicting Alzheimer's disease in cognitively normal aging. J Clin Neurol. 2011; 7:60–68. PMID: 21779293.
crossref
3. Aisen PS, Petersen RC, Donohue MC, Gamst A, Raman R, Thomas RG, et al. Clinical core of the Alzheimer's Disease neuroimaging initiative: progress and plans. Alzheimers Dement. 2010; 6:239–246. PMID: 20451872.
crossref
4. Weiner MW, Aisen PS, Jack CR Jr, Jagust WJ, Trojanowski JQ, Shaw L, et al. The Alzheimer's disease neuroimaging initiative: progress report and future plans. Alzheimers Dement. 2010; 6:202–211.e7. PMID: 20451868.
crossref
5. Qiu Y, Li L, Zhou TY, Lu W. Alzheimer's Disease Neuroimaging Initiative. Alzheimer's disease progression model based on integrated biomarkers and clinical measures. Acta Pharmacol Sin. 2014; 35:1111–1120. PMID: 25088003.
crossref
6. Wang L, Miller JP, Gado MH, McKeel DW, Rothermich M, Miller MI, et al. Abnormalities of hippocampal surface structure in very mild dementia of the Alzheimer type. Neuroimage. 2006; 30:52–60. PMID: 16243546.
crossref
7. Frisoni GB, Ganzola R, Canu E, Rüb U, Pizzini FB, Alessandrini F, et al. Mapping local hippocampal changes in Alzheimer's disease and normal ageing with MRI at 3 Tesla. Brain. 2008; 131(Pt 12):3266–3276. PMID: 18988639.
crossref
8. Costafreda SG, Dinov ID, Tu Z, Shi Y, Liu CY, Kloszewska I, et al. Automated hippocampal shape analysis predicts the onset of dementia in mild cognitive impairment. Neuroimage. 2011; 56:212–219. PMID: 21272654.
crossref
9. Hanseeuw BJ, Van Leemput K, Kavec M, Grandin C, Seron X, Ivanoiu A. Mild cognitive impairment: differential atrophy in the hippocampal subfields. AJNR Am J Neuroradiol. 2011; 32:1658–1661. PMID: 21835940.
crossref
10. Shen KK, Fripp J, Mériaudeau F, Chételat G, Salvado O, Bourgeat P. Alzheimer's Disease Neuroimaging Initiative. Detecting global and local hippocampal shape changes in Alzheimer's disease using statistical shape models. Neuroimage. 2012; 59:2155–2166. PMID: 22037419.
crossref
11. Ye BS, Seo SW, Kim CH, Jeon S, Kim GH, Noh Y, et al. Hippocampal and cortical atrophy in amyloid-negative mild cognitive impairments: comparison with amyloid-positive mild cognitive impairment. Neurobiol Aging. 2014; 35:291–300. PMID: 24080178.
crossref
12. Kim J, Valdes-Hernandez Mdel C, Royle NA, Park J. Hippocampal shape modeling based on a progressive template surface deformation and its verification. IEEE Trans Med Imaging. 2015; 34:1242–1261. PMID: 25532173.
crossref
13. Lee DY, Fletcher E, Carmichael OT, Singh B, Mungas D, Reed B, et al. Sub-regional hippocampal injury is associated with fornix degeneration in Alzheimer's disease. Front Aging Neurosci. 2012; 4:1. PMID: 22514534.
crossref
14. Thomann PA, Seidl U, Brinkmann J, Hirjak D, Traeger T, Wolf RC, et al. Hippocampal morphology and autobiographic memory in mild cognitive impairment and Alzheimer's disease. Curr Alzheimer Res. 2012; 9:507–515. PMID: 22372439.
15. Bozzali M, Falini A, Franceschi M, Cercignani M, Zuffi M, Scotti G, et al. White matter damage in Alzheimer's disease assessed in vivo using diffusion tensor magnetic resonance imaging. J Neurol Neurosurg Psychiatry. 2002; 72:742–746. PMID: 12023417.
crossref
16. Takahashi S, Yonezawa H, Takahashi J, Kudo M, Inoue T, Tohgi H. Selective reduction of diffusion anisotropy in white matter of Alzheimer disease brains measured by 3.0 Tesla magnetic resonance imaging. Neurosci Lett. 2002; 332:45–48. PMID: 12377381.
crossref
17. Ringman JM, O'Neill J, Geschwind D, Medina L, Apostolova LG, Rodriguez Y, et al. Diffusion tensor imaging in preclinical and presymptomatic carriers of familial Alzheimer's disease mutations. Brain. 2007; 130(Pt 7):1767–1776. PMID: 17522104.
crossref
18. Stricker NH, Schweinsburg BC, Delano-Wood L, Wierenga CE, Bangen KJ, Haaland KY, et al. Decreased white matter integrity in late-myelinating fiber pathways in Alzheimer's disease supports retrogenesis. Neuroimage. 2009; 45:10–16. PMID: 19100839.
crossref
19. Sexton CE, Kalu UG, Filippini N, Mackay CE, Ebmeier KP. A meta-analysis of diffusion tensor imaging in mild cognitive impairment and Alzheimer's disease. Neurobiol Aging. 2011; 32:2322.e5–2322.e18.
crossref
20. Bosch B, Arenaza-Urquijo EM, Rami L, Sala-Llonch R, Junqué C, Solé-Padullés C, et al. Multiple DTI index analysis in normal aging, amnestic MCI and AD. Relationship with neuropsychological performance. Neurobiol Aging. 2012; 33:61–74. PMID: 20371138.
crossref
21. Nir TM, Jahanshad N, Villalon-Reina JE, Toga AW, Jack CR, Weiner MW, et al. Effectiveness of regional DTI measures in distinguishing Alzheimer's disease, MCI, and normal aging. Neuroimage Clin. 2013; 3:180–195. PMID: 24179862.
crossref
22. Zhuang L, Sachdev PS, Trollor JN, Reppermund S, Kochan NA, Brodaty H, et al. Microstructural white matter changes, not hippocampal atrophy, detect early amnestic mild cognitive impairment. PLoS One. 2013; 8:e58887. PMID: 23516569.
crossref
23. Patil RB, Ramakrishnan S. Analysis of sub-anatomic diffusion tensor imaging indices in white matter regions of Alzheimer with MMSE score. Comput Methods Programs Biomed. 2014; 117:13–19. PMID: 24986110.
crossref
24. Chen H, Wang K, Yao J, Dai J, Ma J, Li S, et al. White matter changes in Alzheimer's disease revealed by diffusion tensor imaging with TBSS. World J Neurosci. 2015; 5:58–65.
25. Bozzali M, Cercignani M, Sormani MP, Comi G, Filippi M. Quantification of brain gray matter damage in different MS phenotypes by use of diffusion tensor MR imaging. AJNR Am J Neuroradiol. 2002; 23:985–988. PMID: 12063230.
26. Coleman MP, Freeman MR. Wallerian degeneration, wld(s), and nmnat. Annu Rev Neurosci. 2010; 33:245–267. PMID: 20345246.
crossref
27. Walhovd KB, Fjell AM, Amlien I, Grambaite R, Stenset V, Bjørnerud A, et al. Multimodal imaging in mild cognitive impairment: metabolism, morphometry and diffusion of the temporal-parietal memory network. Neuroimage. 2009; 45:215–223. PMID: 19056499.
crossref
28. Kantarci K, Petersen RC, Boeve BF, Knopman DS, Weigand SD, O'Brien PC, et al. DWI predicts future progression to Alzheimer disease in amnestic mild cognitive impairment. Neurology. 2005; 64:902–904. PMID: 15753434.
crossref
29. Müller MJ, Greverus D, Dellani PR, Weibrich C, Wille PR, Scheurich A, et al. Functional implications of hippocampal volume and diffusivity in mild cognitive impairment. Neuroimage. 2005; 28:1033–1042. PMID: 16084115.
crossref
30. Fellgiebel A, Dellani PR, Greverus D, Scheurich A, Stoeter P, Müller MJ. Predicting conversion to dementia in mild cognitive impairment by volumetric and diffusivity measurements of the hippocampus. Psychiatry Res. 2006; 146:283–287. PMID: 16530394.
crossref
31. Fellgiebel A, Yakushev I. Diffusion tensor imaging of the hippocampus in MCI and early Alzheimer's disease. J Alzheimers Dis. 2011; 26(Suppl 3):257–262. PMID: 21971465.
crossref
32. Rose SE, Janke AL, Chalk JB. Gray and white matter changes in Alzheimer's disease: a diffusion tensor imaging study. J Magn Reson Imaging. 2008; 27:20–26. PMID: 18050329.
crossref
33. Douaud G, Menke RA, Gass A, Monsch AU, Rao A, Whitcher B, et al. Brain microstructure reveals early abnormalities more than two years prior to clinical progression from mild cognitive impairment to Alzheimer's disease. J Neurosci. 2013; 33:2147–2155. PMID: 23365250.
crossref
34. Jack CR Jr, Bernstein MA, Fox NC, Thompson P, Alexander G, Harvey D, et al. The Alzheimer's Disease Neuroimaging Initiative (ADNI): MRI methods. J Magn Reson Imaging. 2008; 27:685–691. PMID: 18302232.
crossref
35. Csernansky JG, Wang L, Swank J, Miller JP, Gado M, McKeel D, et al. Preclinical detection of Alzheimer's disease: hippocampal shape and volume predict dementia onset in the elderly. Neuroimage. 2005; 25:783–792. PMID: 15808979.
crossref
36. Smith SM, Jenkinson M, Johansen-Berg H, Rueckert D, Nichols TE, Mackay CE, et al. Tract-based spatial statistics: voxelwise analysis of multi-subject diffusion data. Neuroimage. 2006; 31:1487–1505. PMID: 16624579.
crossref
37. Smith SM, Nichols TE. Threshold-free cluster enhancement: addressing problems of smoothing, threshold dependence and localisation in cluster inference. Neuroimage. 2009; 44:83–98. PMID: 18501637.
crossref
38. Apostolova LG, Mosconi L, Thompson PM, Green AE, Hwang KS, Ramirez A, et al. Subregional hippocampal atrophy predicts Alzheimer's dementia in the cognitively normal. Neurobiol Aging. 2010; 31:1077–1088. PMID: 18814937.
crossref
39. Cho Y, Seong JK, Shin SY, Jeong Y, Kim JH, Qiu A, et al. A multi-resolution scheme for distortion-minimizing mapping between human subcortical structures based on geodesic construction on Riemannian manifolds. Neuroimage. 2011; 57:1376–1392. PMID: 21658456.
crossref
40. Schönheit B, Zarski R, Ohm TG. Spatial and temporal relationships between plaques and tangles in Alzheimer-pathology. Neurobiol Aging. 2004; 25:697–711. PMID: 15165691.
crossref
41. Bobinski M, Wegiel J, Wisniewski HM, Tarnawski M, Reisberg B, Mlodzik B, et al. Atrophy of hippocampal formation subdivisions correlates with stage and duration of Alzheimer disease. Dementia. 1995; 6:205–210. PMID: 7550600.
crossref
42. Bobinski M, Wegiel J, Tarnawski M, Bobinski M, Reisberg B, de Leon MJ, et al. Relationships between regional neuronal loss and neurofibrillary changes in the hippocampal formation and duration and severity of Alzheimer disease. J Neuropathol Exp Neurol. 1997; 56:414–420. PMID: 9100672.
crossref
43. Shi F, Liu B, Zhou Y, Yu C, Jiang T. Hippocampal volume and asymmetry in mild cognitive impairment and Alzheimer's disease: metaanalyses of MRI studies. Hippocampus. 2009; 19:1055–1064. PMID: 19309039.
crossref
44. Tondelli M, Wilcock GK, Nichelli P, De Jager CA, Jenkinson M, Zamboni G. Structural MRI changes detectable up to ten years before clinical Alzheimer's disease. Neurobiol Aging. 2012; 33:825.e25–825.e36.
crossref
45. Cappellani R, Bergsland N, Weinstock-Guttman B, Kennedy C, Carl E, Ramasamy DP, et al. Subcortical deep gray matter pathology in patients with multiple sclerosis is associated with white matter lesion burden and atrophy but not with cortical atrophy: a diffusion tensor MRI study. AJNR Am J Neuroradiol. 2014; 35:912–919. PMID: 24335548.
crossref
46. den Heijer T, der Lijn Fv, Vernooij MW, de Groot M, Koudstaal PJ, van der Lugt A, et al. Structural and diffusion MRI measures of the hippocampus and memory performance. Neuroimage. 2012; 63:1782–1789. PMID: 22960084.
crossref
47. Shipton OA, El-Gaby M, Apergis-Schoute J, Deisseroth K, Bannerman DM, Paulsen O, et al. Left-right dissociation of hippocampal memory processes in mice. Proc Natl Acad Sci U S A. 2014; 111:15238–15243. PMID: 25246561.
crossref
48. Basser PJ, Pierpaoli C. Microstructural and physiological features of tissues elucidated by quantitative-diffusion-tensor MRI. J Magn Reson B. 1996; 111:209–219. PMID: 8661285.
crossref
49. Kale RA, Gupta RK, Saraswat VA, Hasan KM, Trivedi R, Mishra AM, et al. Demonstration of interstitial cerebral edema with diffusion tensor MR imaging in type C hepatic encephalopathy. Hepatology. 2006; 43:698–706. PMID: 16557540.
crossref
50. Weston PS, Simpson IJ, Ryan NS, Ourselin S, Fox NC. Diffusion imaging changes in grey matter in Alzheimer's disease: a potential marker of early neurodegeneration. Alzheimers Res Ther. 2015; 7:47. PMID: 26136857.
crossref
51. Rulseh AM, Keller J, Tintěra J, Kozžísšek M, Vymazal J. Chasing shadows: what determines DTI metrics in gray matter regions? An in vitro and in vivo study. J Magn Reson Imaging. 2013; 38:1103–1110. PMID: 23440865.
crossref
52. Kamman RL, Go KG, Brouwer W, Berendsen HJ. Nuclear magnetic resonance relaxation in experimental brain edema: effects of water concentration, protein concentration, and temperature. Magn Reson Med. 1988; 6:265–274. PMID: 3362061.
crossref
53. Bartzokis G, Cummings JL, Sultzer D, Henderson VW, Nuechterlein KH, Mintz J. White matter structural integrity in healthy aging adults and patients with Alzheimer disease: a magnetic resonance imaging study. Arch Neurol. 2003; 60:393–398. PMID: 12633151.
54. Bartzokis G, Sultzer D, Lu PH, Nuechterlein KH, Mintz J, Cummings JL. Heterogeneous age-related breakdown of white matter structural integrity: implications for cortical “disconnection” in aging and Alzheimer's disease. Neurobiol Aging. 2004; 25:843–851. PMID: 15212838.
crossref
Fig. 1

Overall scheme of the analysis. A: T1-weighted images were segmented using Freesurfer to extract the hippocampus. The template model from the normal group was used to construct the group surface model and determine intergroup morphometry differences. B: DTI maps were processed using the TBSS pipeline up to the nonlinear register in an MNI space. Using a surface model of the hippocampus generated from T1-weighted images as a mask, we compared hippocampal diffusivity differences among groups. ADNI: Alzheimer's Disease Neuroimaging Initiative, DTI: diffusion-tensor imaging, FA: fractional anisotropy, FSL: functional MRI of the brain software library, ROI: region of interest, TBSS: Tract-Based Spatial Statistics.

jcn-13-144-g001
Fig. 2

Hippocampal volumes in each group. Bilateral hippocampal volumes in EMCI were not significantly smaller than those in CN. While the left hippocampal volumes in EMCI were significantly smaller than those in LMCI, they did not differ significantly from those in CN (*p<0.05, p<0.001). CN: cognitive normal, EMCI: early mild cognitive impairment, LMCI: late mild cognitive impairment.

jcn-13-144-g002
Fig. 3

Morphometry changes. Delineation of hippocampal subfields in the average template from CN (leftmost). Hippocampal surface analysis showed significant atrophy in bilateral CA1 regions and the right ventral subiculum in EMCI compared to CN, and in bilateral CA1 and CA2–CA4 regions and the subiculum in LMCI (uncorrected p<0.05). CN: cognitive normal, EMCI: early mild cognitive impairment, H: head, LMCI: late mild cognitive impairment, T: tail.

jcn-13-144-g003
Fig. 4

Microstructural changes in each group. Clusters showing changes in DTI indices: MD (A), AxD (B), and RD (C). All comparisons except those in EMCI and LMCI were corrected for multiple comparisons. A and C: MD and RD were higher in EMCI than in CN in the bilateral CA2–CA4 regions, and higher in LMCI in the bilateral CA2–CA4 and subiculum regions. B: AxD was higher in EMCI than in CN in the right CA2–CA4 regions, and higher in LMCI in the bilateral CA2–CA4 and subiculum regions (purple, MD; red, AxD; blue, RD). A: anterior, AD: Alzheimer's disease, AxD: axial diffusivity, CN: cognitive normal, DTI: diffusion-tensor imaging, EMCI: early mild cognitive impairment, LMCI: late mild cognitive impairment, MD: mean diffusivity, P: posterior, RD: radial diffusivity, S: superior.

jcn-13-144-g004
Fig. 5

Linear relationships between DTI metrics and clinical scores. Clusters showing linear relationships with DTI indices: MD (A), AxD (B), and RD (C). RD versus MMSE and MADAS-Cog scores (purple, MD; red, AxD; blue, RD). Scatter plots showing the correlations between result clusters and clinical scores (green, EMCI; blue, LMCI; red, AD). A: anterior, AD: Alzheimer's disease, AxD: axial diffusivity, DTI: diffusion-tensor imaging, EMCI: early mild cognitive impairment, LMCI: late mild cognitive impairment, MADAS-Cog: Modified Alzheimer's Disease Assessment Scale-Cognitive subscale, MD: mean diffusivity, MMSE: Mini Mental State Examination, P: posterior, RD: radial diffusivity, S: superior.

jcn-13-144-g005
Table 1

Demographics of the subjects

jcn-13-144-i001
CN (n=20) EMCI (n=17) LMCI (n=20) AD (n=20) Post-hoc comparisons
Female 11 (55.0) 4 (23.5) 6 (30.0) 10 (50.0)
Age (years) 69.9±3.3 67.8±5.3 69.2±4.8 68.3±4.3
Education (years) 16.6±2.8 16.2±2.6 16.1±2.7 15.7±2.4
GCDR 0.0 0.5 0.5 0.8±0.3 CN<EMCI=LMCI<AD
MMSE 28.9±1.1 28.4±1.4 27.2±1.9 23.5±1.9 CN=EMCI=LMCI<AD
MADAS-Cog* 7.3±3.1 14.7±6.7 20.4±6.1 28.3±9.8 CN<EMCI<LMCI<AD
Logical Memory I: immediate recall 13.3±3.0 10.5±2.3 5.8±3.1 3.5±2.0 CN<EMCI<LMCI<AD
Logical Memory II: delayed recall 11.8±3.3 9.2±1.4 2.5±2.9 1.6±2.0 CN<EMCI<LMCI=AD
Florbetapir+* 3 (17.6) 5 (31.3) 14 (82.4) 20 (100.0) CN=EMCI<LMCI<AD
42 (µg/mL)* 210.9±54.3 186.8±56.5 161.8±55.3 124.1±25.7 CN=EMCI<LMCI<AD
p-tau (µg/mL)* 29.7±9.2 36.2±31.7 59.1±30.1 76.0±40.0 CN=EMCI<LMCI=AD

Data are n (%) or mean±SD values. There were no gender, age, or education intergroup differences. Two-sample t-tests (p<0.01) between groups were used for post-hoc analysis. MMSE scores in CN, EMCI, and LMCI did not show significant differences. Logical Memory II: delayed recall in LMCI and AD did not show a significant difference. Florbetapir and CSF biomarkers in CN and EMCI did not show a significant difference.

*Missing data: (MADAS-Cog) 3 CN, 1 EMCI, 2 LMCI, 1 AD. (Florbetapir) 3 CN, 1 EMCI, 3 LMCI. (CSF biomarkers) 7 CN, 2 EMCI, 3 LMCI, 3 AD.

AD: Alzheimer's disease, CN: cognitive normal, EMCI: early mild cognitive impairment, GCDR: global Clinical Dementia Rating, LMCI: late mild cognitive impairment, MADAS-Cog: Modified Alzheimers Disease Assessment Scale-Cognitive subscale, MMSE: Mini Mental State Examination.

Table 2

Summary of DTI analysis results

jcn-13-144-i002
MD AxD RD
CN<EMCI*
 Right 1,186 mm3 (CA2–CA4) 1,357 mm3 (CA2–CA4) 448 mm3 (CA2–CA4)
 Left 182 mm3 (CA2–CA4) N/S 234 mm3 (CA2–CA4)
CN<LMCI*
 Right 2,056 mm3 (CA2–CA4 & subiculum) 2,160 mm3 (CA2–CA4 & subiculum) 1,738 mm3 (CA2–CA4 & subiculum)
 Left 1,574 mm3 (CA2–CA4 & subiculum) 1,357 mm3 (CA2–CA4 & subiculum) 1,355 mm3 (CA2–CA4 & subiculum)
CN<AD*
 Right 4,067 mm3 (whole) 3,964 mm3 (whole) 3,871 mm3 (whole)
 Left 3,915 mm3 (whole) 3,834 mm3 (whole) 3,788 mm3 (whole)
LMCI<AD*
 Right 283 mm3 (CA1) 205 mm3 (CA1) 324 mm3 (CA1)
 Left N/S 220 mm3 (CA1) N/S
EMCI<LMCI
 Right 852 mm3 (CA1) 1,131 mm3 (CA1) 676 mm3 (CA1)
 Left N/S N/S N/S
MMSE
 R −0.5254 −0.5271 −0.5259
p 2.71E–5 2.52E–5 2.66E–5
MMSE*
 Right 275 & 642 mm3 648 mm3 274 & 275 mm3
 Left 3,619 mm3 3,568 mm3 3,568 mm3
MADAS-Cog
 R 0.5779 0.5778 0.5760
p 5.86E–6 5.88E–6 6.41E–6
MADAS-Cog*
 Right 524 & 591 mm3 426 & 602 mm3 520 & 538 mm3
 Left 4,373 mm3 4,005 mm3 4,431 mm3

Summary of DTI VBM and correlations with clinical analysis. Comparisons show the cluster extent with increased diffusivity, and the corresponding regions are specified. For correlation analysis, the correlation coefficient (R), associated p value, and cluster extent are specified.

*FWE-corrected p<0.05, Uncorrected p<0.05.

AD: Alzheimer's disease, AxD: axial diffusivity, CN: cognitive normal, DTI: diffusion-tensor imaging, EMCI: early mild cognitive impairment, FWE: family-wise error, LMCI: late mild cognitive impairment, MADAS-Cog: Modified Alzheimer's Disease Assessment Scale-Cognitive subscale, MD: mean diffusivity, MMSE: Mini Mental State Examination, N/S: not significant, RD: radial diffusivity, VBM: voxel-based morphometry.

TOOLS
Similar articles