

 PDF
PDF ePub
ePub Citation
 Print
Print


INTRODUCTION
Stroke is a leading cause of death and disability worldwide. Globally, 16 million people suffer an incident stroke every year.1 The stroke incidence and mortality increase sharply with age, with 0.8, 1.1, and 3.8 million estimated annual global deaths among adults aged <60, 60–69, and ≥70 years, respectively.1 Total anterior circulation stroke (TACS) accounts for 17–21% of all strokes.23 TACS is classified as the most severe form of stroke according to the Oxford Community Stroke Project classification defined by Bamford et al.:4 In 675 TACS patients with first-ever stroke, after 30 days (n=85) approximately 40% had died, 56% had become dependent, and only 4% remained independent.
Despite overall improvements in stroke prevention and treatment since the late 20th century,567 the rate of in-hospital mortality following TACS remains high.8 We recently evaluated the potential for readily available data on patient-related factors such as age, sex, stroke subtype, and patient's prestroke disability to predict stroke outcome,691011 which revealed a paucity of data on the clinical significance of such factors in relation to mortality following TACS. This is important because knowledge about the prognostic factors predictive of in-hospital mortality at the point of admission could be used to inform clinical management decisions and individualize patient care.
In this prospective cohort study, we examined readily available data on patient-related factors (age, sex, stroke subtype, lateralization, and prestroke disability) and data on preexisting comorbid conditions in relation to in-hospital mortality with the aim of developing a risk scoring system to provide prognostic information on in-hospital mortality in this patient group.
METHODS
The study participants comprised a prospectively identified cohort consisting of 2,971 patients with ischemic or hemorrhagic TACS who were consecutively admitted to a university hospital in the east of England, UK (with a catchment population of ~750,000) between November 1996 and June 2012. TACS was defined as a significant ischemic or hemorrhagic event affecting the territories of the middle and/or anterior cerebral arteries.
TACS was diagnosed during a hospital admission by the presence of all three of the following signs: 1) unilateral weakness (and/or sensory deficit) affecting at least two of the face, arm, and leg, 2) homonymous hemianopia, and 3) higher cerebral dysfunction (e.g., dysphasia and/or visuospatial disorder). In the absence of lateralization (i.e., unilateral weakness), the diagnosis was based on neuroradiological findings such as the arterial territory involved and the extent of the injury in conjunction with other circumstantial evidence (e.g., eye deviation or obvious neglect).
The study participants were drawn from the routinely collected Stroke & TIA Register (first TACS diagnosis), and the study itself was conducted in accordance with the principles of the Declaration of Helsinki (1964). Ethical approval was obtained from the Research Ethics Committee of the Newcastle and Tyneside National Health Service (NHS); the UK publicly funded health-care system (approval no. 12/NE/0170), and the study protocol was approved by the Steering Committee of the Stroke and TIA Register.
Data collection
The data collection methods of the register have been reported previously.12 For the present study, demographic data including sex, age, stroke subtype, prestroke modified Rankin Scale (mRS) score (measure of prestroke disability as detailed in the footnote of Table 1, and modified by the UK-TIA investigators), 13 stroke lateralization (right, left, or undetermined hemispheric dominance), and prestroke residence were collected directly from the clinical stroke register. Data on pre-existing comorbid conditions were retrieved from the hospital's patient administration database as described previously [identified from codes in the 10th revision of the International Classification of Disease (ICD-10) based on clinical findings].12 A status of dead or alive at discharge was recorded to capture incidents of in-hospital mortality. Additional checks of linkage with the hospital administration database were performed to further validate the cohort.
Statistical analysis
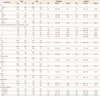
Logistic regression models were used to estimate the odds ratios for in-hospital mortality for characteristic variables. Adjusted odds ratios (AORs) were also calculated by including factors in a multivariate model. The variables listed in Table 1 were selected for inclusion using forward selection with a significance cutoff of 10%. From this model we constructed a score by rounding the logarithm of the AOR to the nearest integer value. Our statistical approach for developing a TACS scoring scale was similar to the approach used by Lim et al.14 in their study of community acquired pneumonia. Factors for inclusion in our study were agreed upon a-priori. Thirteen patient-level parameters selected from the current literature as potentially important for patient prognosis following stroke691011 were examined, including information on age, sex, stroke subtype (infarct or bleed), prestroke residence, disability status (mRS score), and presence of comorbid conditions. Variables from the a-priori defined potential variables listed in Table 1 were selected for inclusion in the TACS scoring system using forward selection with a significance cutoff of 10%.
Variations in mortality rates were examined using chi-square analysis for the period from 1997 to 2011 (full data for 1996 and 2012 were not available). The diagnostic parameters, sensitivity, specificity, positive predictive value (PPV), and negative predictive value (NPV) for in-hospital deaths were estimated for each score compared with a score of 0. The overall diagnostic accuracy was measured using the area under the receiver operating characteristic (ROC) curve.
RESULTS
This study included 2,971 patients [42.1% males aged 76.9±10.8 years (mean±SD) and 57.9% females aged 81.5±9.3 years) who sustained a TACS between November 1996 and June 2012. The median age of our cohort was 81 years [range=20–102 years; interquartile range (IQR)=74–86 years]. Fifty percent (n=1,480) of the study participants were fully independent (prestroke mRS score=0) prior to their stroke. Ischemic stroke was more prevalent (82%, n=2,445) than hemorrhagic stroke (18%, n=526).
Multivariate analysis showed that factors associated with in-hospital mortality (Table 1) were male sex (AOR=1.19, p=0.05), a prestroke mRS score of 3 or 4 (AOR=1.54 and p=0.002, and AOR=1.73 and p=0.004, respectively), advanced age (AOR=2.56 for 65–84 vs. ≥85 years, p<0.001; AOR=4.96 for 65–84 vs. <65 years, p<0.001), hemorrhagic stroke subtype (AOR=1.70, p<0.001), absence of lateralization (AOR=1.75, p=0.001), and congestive heart failure (CHF; AOR=1.61, p=0.004). There was no significant trend (p=0.12) in TACS mortality rates across time (1997–2011) (Supplementary Fig. 1 in the online-only Data Supplement).
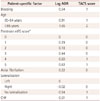
We developed a 6-point TACS scoring system (Table 2) based on the results of our multiple logistic regression model for in-patient mortality. Based on the TACS Score [T=type (hemorrhage=1 point) and territory (nonlateralization=1 point), A=age (65–84 years=1 point, ≥85 years=2 points), C=CHF (if present=1 point), S=status before stroke (prestroke mRS score of 4 or 5=1 point], we assigned each patient into one of five risk groups (Table 3). Risk stratification in this way reliably predicted patient outcome, with low-risk patients having the best chance of being discharged alive and high-risk patients having the highest rates of in-patient mortality: score=0, 29.4% mortality; score=1, 46.2% mortality [NPV=70.6, PPV=46.2%]; score=2, 64.1% mortality (NPV=70.6%, PPV=64.1%); score=3, 73.7% mortality (NPV=70.6%, PPV=73.7%), and score=4 or 5, 81.2% mortality (NPV=70.6%, PPV=81.2%). Higher risk was associated with higher PPV, lower sensitivity, and higher specificity. The area under the ROC curve for the logistic regression model based on the covariates was 0.67 [95% confidence interval (CI)=0.65–0.69], compared to 0.64 (95% CI=0.62–0.66) using the numerical score, suggesting that the discriminatory ability was only slightly lower when using the scoring system rather than the original variables.
DISCUSSION
Our study has provided new knowledge about the patient-level characteristic determinants of in-hospital mortality following TACS, which is the most severe form of stroke that commonly affects older people. Major strengths of this study include the largeness of the sample, inclusion of consecutive hospital admissions, and performing statistical analyses that were robustly adjusted for patient-level parameters and other important known prognostic indicators such as components of the validated SOAR (Stroke subtype, Oxford Community Stroke Project classification, Age, prestroke modified Rankin) stroke score.31115 Using our findings we were able to derive a pragmatic scoring system that potentially has utility in the clinical setting and which is based on readily available patient factors at the point of care.
In the UK alone, treatment and productivity losses from stroke cost UKP 8.9 billion per year, with in-patient costs accounting for approximately 50% of this total (and 5% of total UK NHS costs).16 The economic relevance of pragmatic risk stratification in TACS patients is clear. According to the Australian NEMESIS study,17 the average cost per case during the first year was greater for TACS (AUS$ 28,266) than for all other stroke types, including hemorrhage. This was also consistent with data reported by the Belgium Stroke Council.18
The presence or absence of specific patient-related factors such as advanced age, disability status, and pre-existing comorbid conditions may contribute to whether a patient will have a good or poor outcome following stroke.19202122 Although there are currently no robust TACS data with which we can compare the present findings, they do share similarities with those from some previous research studies examining all stroke types. Langhorne et al.23 undertook a prospective, multicenter study and reported that most acute strokes are ischemic in nature (n=277, 89%), and are suffered by those with advanced age (mean=76 years, IQR=70–82 years) and who are independent (prestroke mRS score=0–2; n=229, 74%). Similar findings were reported in 2008 by Arnold et al.10
The rate of in-hospital mortality following TACS increases with age.1 The presence of pre-existing CHF [ICD-10 codes for this condition include CHF (I50.0), left ventricular failure (I50.1), or heart failure unspecified (I50.9)] is associated with higher mortality following TACS. Poor outcome from stroke for such pathologies is well established.24 Our data show that the absence of hemispheric lateralization increased the risk of in-hospital mortality. Nonlateralization is defined as the absence of any signs that could indicate which side of the brain is predominantly affected following stroke; this is generally indicative of severe stroke with cerebral edema that is likely to have a poor overall prognosis.
Several large and influential studies252627 have explicitly linked the prestroke mRS score and poststroke survival. The mRS score as a measure of prestroke disability appears to be a very good prognostic indicator for those with TACS. Our results are broadly consistent with these observations, although the lack of association between prestroke mRS score and in-hospital mortality among patients in our cohort with an mRS score of 5 (indicating severe disability) may reflect the very small number of such patients, as suggested by the wide CI.
The rate of in-hospital death following TACS remained consistent over the duration of this study, suggesting that our cohort was not affected by the year of entry to the study. Despite an overall improvement in prevention and treatment of all-cause stroke,8 the in-hospital mortality following TACS was consistently high for a period lasting more than one decade. It is therefore vital to understand the factors associated with in-hospital mortality following this type of stroke in order to be able to develop strategies for improving patient outcomes.
This is the first report in the literature of a scoring system that allows TACS patients to be stratified according to their risk and for the likely outcome (in-hospital death or survival to discharge) of their event to be predicted. Providing clinicians with such information is important in the context of TACS management given the poor overall patient prognosis. Based on the clinical situation and presence of specific factors, the treating clinician may instigate step-up or step-down care, or initiate palliative support. Further, it is essential for policy-makers, hospital managers, and bed-flow coordinators to have access to prognostic information, including the likelihood of in-hospital mortality when organizing healthcare systems and managing patient flow. Identifying adverse and favorable factors in TACS is vital to optimize the use of resources by appropriately directing the allocation of expertise and funding.
We acknowledge that this study was subject to some limitations. The data were analyzed retrospectively. However, we identified patients and collected clinical data prospectively, and information was recorded in real time, reviewed and double checked for accuracy (only comorbidity data were retrieved at a later date from electronic records; however, electronic records were recorded prospectively). Also, patients who died of stroke prior to arrival to hospital were not included in our analyses, since admitted patients are more relevant to clinical practice.
We have identified the determinants of in-hospital mortality in the most severe form of stroke (TACS) regardless of its pathophysiology. Moreover, we have developed a bedside TACS prognostic scoring system which can predict in-hospital mortality. The reproducibility of the results obtained using this scoring system requires further evaluation; we would propose performing the validation in an independent cohort at an early stage of TACS. Nevertheless, we believe our findings provide the essential framework for future service evaluations and for identifying patients with the highest mortality risk following TACS.

 XML Download