

 PDF
PDF ePub
ePub Citation
 Print
Print


INTRODUCTION
Carpal tunnel syndrome (CTS) is the most common neural entrapment syndrome, and it is characterized by paresthesia, dysesthesia, and weakness of the median-innervated muscles (flexor pollicis brevis, opponens pollicis, and abductor pollicis brevis).1 Although most practitioners consider electrodiagnostic testing (EDX) to be the gold standard for the diagnosis of CTS, some still believe that EDX has a substantial rate of false-negative findings, and so rely instead on clinical findings. EDX can disclose median neuropathy at the wrist but cannot diagnose CTS per se for various reasons, including since there are patients with median slowing at the wrists but who do not have CTS.2 This issue has prompted practitioners to investigate other methods for verifying clinical and EDX findings. Ultrasonography (US) seemed to be the most-cost-effective candidate for this, particularly after visualizing the peripheral nerve, due to advances in ultrasound and probe technology. Buchberger et al.34 is the first to describe the US characteristic features of CTS, and suggested basing the diagnosis of CTS on the following measurements: 1) increased cross-sectional area at the level of the pisiform bone (CSApisiform) and, to a lesser extent, at the level of the hook of hamate; 2) increased swelling ratio (SR; ratio of CSApisiform to CSA at the distal radius level); 3) increased flattening ratio at the level of the hook of hamate (ratio of the transverse-to-anteroposterior diameters); and 4) the presence of palmar bowing (posteroanterior replacement of the palmar flexor retinaculum). The Quality Standards Subcommittee of the American Academy of Neurology have also stated the diagnostic benefits of US.5 Although various other measurement methods have been described, most authors have consistently remarked on the reliability of CSApisiform measurements.678 However, although several studies have investigated this subject, there is still no consensus regarding the optimal cutoff values to apply.
In the present trial we investigated the diagnostic significance of four US measurement methods and compared these measurements with EDX findings and the affection of the sensory and motor system in nerve conduction studies. In uncertain cases it is possible to make a confirmed diagnosis of CTS using the ratio between the median and ulnar distal latencies.9 Zaidman et al.10 stated that the median and ulnar nerves increase in size with height and weight of healthy patients. In this context, our secondary aim was to determine whether it is possible to verify or support a diagnosis of CTS using the median-to-ulnar CSA ratio at the same level.
METHODS
This cross-sectional, controlled trial included 37 healthy volunteers as controls (62 hands) and 31 patients diagnosed with CTS using EDX evaluations (12 unilateral CTS and 19 bilateral CTS; 50 hands). Approval was obtained from the Institutional Ethical Committee. All patients provided written informed consent before participation. Inclusion criteria for the CTS study group were as follows: 1) at least one clinical finding of paresthesia on the palmar side of the first three fingers; a positive Phalen, Tinel, or Flick sign test; or hand paresthesia upon waking; and 2) CTS diagnosis using EDX according to the American Academy of Neurology criteria.5 The inclusion criteria for the control group were as follows: 1) no history or evidence of CTS; 2) negative Tinel, Phalen, and Flick sign tests; and 3) no evidence of paresthesia in the first three fingers. The exclusion criteria for both groups were as follows: 1) history or clinical evidence of mimicking pathologies such as cervical radiculopathy, proximal entrapment, polyneuropathy, or ulnar entrapment; 2) having undergone surgical treatment for CTS; 3) fracture or recent trauma of the wrist; 4) metabolic diseases such as diabetes mellitus, thyroid function disorders, rheumatologic diseases, or other systemic disorders that may cause CTS; 5) anatomical abnormalities that have no standard US measurement methods such as bifid median nerves and aberrant persistent median artery; 6) ulnar entrapment diagnosed using EDX; 7) aged <18 years or >65 years; and 8) Martin-Gruber or any other anastomosis between the ulnar and median nerves.
One healthy volunteer in the control group was excluded because of diabetes, and two hands of different patients were excluded for aberrant persistent median artery and bifid median nerve, which were coincidently discovered upon USG evaluation. One patient was excluded from the CTS group because of hypothyroidism. Members of the CTS group were further distinguished into the sensory affection (S) group and both sensory and motor affection (S+M) group by an EDX practitioner. Additionally, a sensory nerve conduction velocity (SNCV) of <50 m/s for determining sensory involvement and a distal latency of the compound muscle action potential (CMAP) of ≥4 ms for determining motor affection were measured.
EDX evaluation
All nerve conduction studies were performed by an experienced electrophysiologist, when the skin temperature was >32℃ and using a calibrated EMG device (Medelec Synergy N2 EMG System, VIASYS Healthcare, Old Woking, UK). The median motor response was obtained orthodromically using a bar electrode placed on the abductor pollicis brevis muscle and using stimulation with a bipolar stimulator positioned 8 cm proximal to the electrode; both the motor distal latency and peak amplitude were evaluated. Sensory nerve conduction studies were performed antidromically using a bar electrode placed on the third finger and using stimulation with a bipolar stimulator positioned 14 cm proximal to the electrode; the distal latency, peak amplitude, and conduction velocity were evaluated. The CTS patients that were categorized into group S or S+M were referred for US evaluation. Patients with ulnar neuropathy were excluded by performing ulnar nerve conduction studies on all CTS patients.
US evaluation
US was performed by a certified physiatrist using a 7–13 MHz linear array probe with a calibrated device (Aplio 500, Toshiba Medical Systems Corporation, Tokyo, Japan) on the same day as the EDX evaluation. All measurements were performed while the patient was sitting in a relaxed position with the wrists at a neutral position. The physiatrist applied minimal force in order to avoid inducing artificial nerve deformation. Area calculations and distance measurements were performed using the device software, and the following four measurements were recorded:
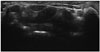
1) CSA was measured at the median nerve and at the most-protuberant portion of the pisiform bone (CSApisiform) three times using continuous boundary tracing, excluding the hyperechoic rim (Fig. 1), and the mean of these measurements was recorded.
2) For evaluating the SR, some investigators have used a constant distance (e.g., 4 cm and 12 cm proximal to the distal end of the radius); we preferred a 4-cm proximal distance.11 Three CSA measurements of the median nerve were made at this level by continuous tracing of the hypoechoic rim, and the mean of these measurements was recorded and the SR was calculated as CSApisiform/median nerve CSA at a distance of 4 cm.
3) Palmar bowing was evaluated by measuring the length of the perpendicular line between the most-bulging point of the flexor retinaculum and the line between the hamate notch and trapezoid tubercle. We used the lower margin of the flexor retinaculum in order to improve the visualization, thereby excluding the thickness of the flexor retinaculum. The mean value of three palmar bowing measurements was recorded.
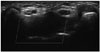
4) The CSApisiform/CSAulnar ratio was obtained by dividing the median nerve CSA measured at the most-protuberant portion of the pisiform bone by the CSA of the ulnar nerve (CSAulnar) at the same level. Because of anatomical variations, the ulnar nerve of some patients was bifurcated at that level. We therefore performed continuous bound tracing to the hypoechoic rims if the nerve was not bifurcated, and in contrary cases we considered bifurcated portions as separate CSAs and so recorded their sum (Fig. 2). The mean values of both measurements were each calculated from three measurements, and the ratio calculated by dividing the means was recorded.
Statistical analysis
Statistical analysis was performed using the Number Cruncher Statistical System 2007 and Power Analysis and Sample Size 2008 statistical software (UT, USA). Student's t-test was used to evaluate statistically descriptive methods [i.e., mean, standard deviation (SD), median, frequency, ratio, minimum, and maximum values] as well as differences between CTS and control groups. One-way analysis of variance was used to compare three or more groups with normally distributed variables. Post-hoc analysis was performed with Tukey's honest-significant-difference test. Qualitative data were compared using Fischer's exact, Fischer-Freeman-Halton, and Yates continuity correction (or Yates chi-square) tests. Pearson and Spearman correlation analyses were used to assess correlations between parameters. Receiver operating characteristic (ROC) curve analysis was used to determine the optimal cutoff value for CSApisiform/CSAulnar. Statistical significance was considered to be present when p<0.05.
RESULTS
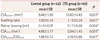
The control group comprised 37 healthy volunteers (5 males and 32 females) aged 45.16±13.11 years (mean±SD) and with a height of 1.62±0.06 m, weight of 72.38±13.82 kg, and body mass index (BMI) of 27.51±5.60 kg/m2. Most (n=34) of the healthy volunteers were right-handed, and 62 hands of the healthy volunteers conformed with the inclusion criteria and so were included in the control group. The CTS group comprised 31 patients (4 males and 27 females) aged of 46.39±7.19 years and with a height of 1.59±0.08 m, weight of 74.77±14.15 kg, and BMI of 29.56±5.75 kg/m2. Most (n=29) of these patients were right-handed, and 12 of the CTS patients were affected unilaterally and 19 were affected bilaterally. Among these patients, 50 hands conformed with the inclusion criteria and so were included in the CTS group. There were no differences between the two groups in terms of sex, mean weight, mean age, mean height, or mean BMI. The demographic characteristics of the CTS patients and healthy volunteers are presented in Table 1.
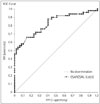
The values of all four measured US parameters (CSApisiform, SR, palmar bowing, and CSApisiform/CSAulnar) were significantly higher in CTS patients than in the controls (Table 2). Because CSApisiform/CSAulnar differed significantly between the two groups, we used ROC analysis to determine an optimal cutoff point for this measurement. A CSApisiform/CSAulnar value of ≥1.79 could be used to diagnose CTS with a sensitivity, specificity, positive predictive value, and negative predictive value of 70%, 76%, 76.6%, and 70%, respectively. The obtained ROC curve showed an area under the curve of 82% and a standard error of 4.2% (Fig. 3).
When the CTS group was divided into groups S and S+M, the CSApisiform values were higher in group S+M than in group S and the control group, and higher in group S than in the control group. SR, palmar bowing, and CSApisiform/CSAulnar were significantly higher in group S+M than in group S and the control group, and they did not differ significantly between the control group and group S. The US parameters measured in the three groups are listed in Table 3.
Correlation analysis between symptom duration and US measurements showed that only CSApisiform/CSAulnar was positively correlated with symptom duration (p<0.05). A negative correlation was found between CSApisiform, palmar bowing (p<0.01), CSApisiform/CSAulnar (p<0.05), and median SNCV. However, the SR was not significantly correlated with SNCV (p=0.052). Analysis of the correlation between median CMAP distal latency and US measurements showed that all four US measurements were positively correlated with CMAP distal latency.
DISCUSSION
In this study we aimed to determine the reliability of four specific US measurements for making CTS diagnoses and how strongly they are correlated with the affection of the sensory and motor system as determined in nerve conduction studies. We also sought to determine whether such a diagnosis can be supported using the median-ulnar CSA ratio. There are still many uncertainties regarding peripheral nerve US and the most appropriate cutoffs to use for related measurements. However, US is considered important for peripheral nerve evaluation and CTS diagnosis, and it is fast and comfortable for patients. Furthermore, US can be used to not only diagnose CTS but also to detect underlying causal anatomical abnormalities. The measurement of CSApisiform is the most-studied method for the diagnosis of CTS.31112131415 In our study, CSApisiform was higher in CTS patients (13.83±4.43 mm2) than in the controls (8.46±1.89 mm2), which is consistent with the results of previous studies.111314 The SR calculated at a distance of 4 cm was also higher in CTS patients (1.15±0.29) than in the control group (1.00±0.18), which is also similar to the findings of previous studies.31116 Likewise, palmar bowing was greater in CTS patients (0.17±0.09 cm) than in the control group (0.13±0.07 cm), as also found previously.313 The CSApisiform/CSAulnar ratio was also higher in CTS patients (2.45±0.98) than in controls (1.88±0.72).
When CTS patients were divided into groups S and S+M according to EDX, the values of all of the measured parameters were significantly higher in group S+M than in group S and the control group. However, CSApisiform was the only parameter that was significantly higher in group S than in the control group, which suggests that only CSApisiform measurements should be used for diagnosis in the early stages of CTS. However, the SR calculated at a distance of 4 cm and palmar bowing measurements can be used if there is motor involvement in the later stages. Because the initial study by Buchberger et al.3 only assessed CTS patients with motor involvement and excluded those with only sensory involvement, the reliability of all currently suggested measurements for the diagnosis of early-stage CTS can not be confirmed. Lee et al.15 studied the correlation between CSA measurements made from the pisiform bone, hook of the hamate bone, and distal radioulnar joint levels and EDX values, and found that proximal swelling of the median nerve at the entrance to the carpal tunnel was correlated with nerve conduction parameters. Kang et al.17 applied EDX to four groups (healthy controls and patients with mild, moderate, and severe CTS), and reported that both the median CSA at the wrist level and the SR gradually increased with the CTS severity. Various parameters can potentially be used for evaluating the median CSA and SR. Many investigators have used CSA at different portions of the carpal tunnel, whereas others have used constant distances from the inlet level for calculating the SR. We preferred to measure the median nerve CSA at a distance of 4 cm. The wrist-to-forearm ratio is another recommended measurement; however, the sensitivity and specificity of the CSApisiform and wrist/forearm ratio are similar.1819 One study found that the wrist-to-forearm ratio was superior,12 whereas Visser et al.20 stated that this ratio is not superior to CSApisiform. Ulaşlı et al. measured CSA at three levels of the carpal tunnel and suggested that a maximum CSA of >10 mm2 is more sensitive for the US diagnosis of CTS. They also calculated the SRs at 4 cm and 12 cm proximal to the inlet, and found both values to be higher in CTS patients than in controls. They recommended using the median nerve CSA at a distance of 4 cm for the SR since they found this to be more practical and gave similar sensitivity and specificity values to measurements made at 12 cm.11 Measuring the median nerve at 12 cm has been considered more difficult than measuring it at 4 cm because the median nerve is deeper and the operator has to change the focus and depth settings on the US device. Considering these factors, we also consider that determining the SR at a distance of 4 cm is more reliable than at a distance of 12 cm.
Yesildag et al.21 found that CSA at the inlet level of the carpal tunnel has a sensitivity of 89% and specificity of 97% when the cutoff was set to 10.5 mm. Keberle et al.16 calculated the SR using a method similar to that used in the current study, and suggested that values >1.3 are critical for the diagnosis of CTS. Furthermore, palmar bowing values have differed between 0.25 cm and 0.4 cm in previous studies,781321 whereas our study detected a mean palmar bowing value of 0.17 cm for CTS patients. This is smaller than in the previous studies because we excluded the flexor retinaculum thickness by performing the measurements at a lower margin in order to improve both the visualization and measurement accuracy.
The cutoff values for each measurement method have varied in previous studies.37814 Confusion can occur when values are measured that fall within these ranges, so supportive measurement methods are still needed in uncertain cases. We believe that determining the median CSA relative to uninvolved nerves such as the ulnar nerve may be more appropriate than determining ratios in the same nerve. These ideas prompted us to evaluate the ratio of median-to-ulnar CSAs. Eom et al.22 recently used US to investigate whether or not the ulnar nerve is affected in patients with CTS. They measured the median-to-ulnar CSA ratio at the wrist, and found a significant correlation with electrophysiology findings. They suggested that further studies should be performed to determine the diagnostic value of the median-to-ulnar nerve CSA ratio for CTS. The results of the present study supported our hypothesis.
While CSApisiform/CSAulnar was higher in CTS patients than in controls, a CSApisiform/CSAulnar value of ≥1.79 in our study had a sensitivity of 70% and a specificity of 76%, which means that its diagnostic usefulness for CTS is lower than those of the other measured parameters. Although EDX and the functionality of the ulnar nerve were not affected in our patients with CTS, the ulnar nerve CSA increased slightly with the CTS severity. This indicates that the ulnar nerve is also affected by carpal tunnel swelling due to these structures being in contact. This condition was also reported by Ginanneschi et al.,23 and it may be the reason for the low sensitivity. Further trials are needed to confirm these results.
Correlation analysis in the current study demonstrated that only CSApisiform/CSAulnar measurements were correlated with symptom duration, while CSApisiform and CSAulnar were not correlated. Because of this inconsistency, we considered that this result could be coincidental. We hypothesized that patients with a longer symptom duration had more morphologic changes, but we were not able to confirm this from our results.
In conclusion, this study has demonstrated that the US measurement of CSApisiform is a reliable method for diagnosing CTS at all stages, whereas SR, palmar bowing, and CSApisiform/CSAulnar measurements are only useful for diagnosing CTS at later stages. All of the US measurement parameters except for SR were correlated with the results from the nerve conduction studies. Furthermore, we demonstrated that CSApisiform/CSAulnar has a low diagnostic value for US-based CTS diagnosis.


 XML Download