

 PDF
PDF ePub
ePub Citation
 Print
Print


INTRODUCTION
Behavioral-variant frontotemporal dementia (bvFTD) and amyotrophic lateral sclerosis (ALS) are neurodegenerative disorders that are increasingly recognized to lie on a disease continuum at the clinical, genetic, and pathological levels.123 Despite the increasing clarity of the underlying clinical, genetic, and pathological commonalities, there remains a lack of knowledge of the neural correlates across the ALS-FTD continuum. The neuroanatomical correlates of degeneration have been established within the FTD subtypes and also to some extent in ALS. However, to our knowledge only one previous study has directly contrasted the gray- and white-matter changes across the whole continuum, and showed that the prefrontal gray- and white-matter changes were substantially greater in bvFTD than in ALS. By contrast, there were substantially more corticospinal white-matter changes in ALS than in bvFTD, while both patient groups showed motor-cortex changes and associated white-matter degeneration.
These findings of motor-cortex changes across the continuum raise crucial questions regarding the degree to which the whole motor-system network is dysfunctional in ALS and FTD. At a neurophysiological level, threshold-tracking transcranial magnetic stimulation (TT-TMS) has shown early cortical hyperexcitability in ALS56 as well as bvFTD.7 Of particular interest was the finding of TMS motor hyperexcitability—which is a functional marker of motor-cortex impairment4—in a high proportion of patients with FTD.7 These findings demonstrate that there are functional changes in the motor cortex in both ALS and FTD. However, the structural gray-matter changes within the motor system (in the supplementary motor cortex, motor cortex, thalamus, striatum, brainstem, and cerebellum) and its connecting white-matter tracts across the continuum remain largely unknown. More importantly, the relationship between measures of functional motor integrity (i.e., TMS) and structural gray- and white-matter changes has not been explored. Further elucidation of this complex relationship is important for understanding motor dysfunction in ALS and FTD.
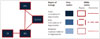
The current study addressed these issues by conducting a region-of-interest (ROI) analysis of the cortical and subcortical motor-system areas as well as their white-matter connections across ALS and bvFTD clinical phenotypes with the aim of identifying the neural basis of motor dysfunction in both disorders (see Fig. 1 for an overview of the regions and tracts included). A particularly important feature of this study was the inclusion of the cerebellum and thalamus and their white-matter connections in the ROI analyses, since these structures have not been investigated in previous ALS and FTD neuroimaging studies. In addition, a subset of patients was assessed for functional integrity of the corticomotor neurons and inhibitory interneurons using TT-TMS. These physiological results were cross-correlated with the results from the gray- and white-matter ROI analyses to investigate the neuroanatomical correlates of motor-cortex hyperexcitability.
We hypothesized that there is a gradation of structural changes in ALS and FTD, with gray-matter changes being particularly prevalent in bvFTD and white-matter changes predominating in ALS. We further hypothesized that functional neurophysiological indices of motor dysfunction would be affected more in ALS, and that these changes would be related to motor-cortex atrophy.
METHODS
Case selection
A total of 79 participants took part in this study. Patients were recruited from the FRONTIER FTD Research Clinic as well as specialist ALS multidisciplinary clinics in Sydney, Australia, which yielded a sample comprising 25 bvFTD patients, 17 ALS, and 37 controls. All FTD patients met current consensus criteria for bvFTD,8 showing the progressive behavioral and/or cognitive decline characteristic of this dementia subset, including some or all of the following features: disinhibition, apathy, inertia, loss of empathy, perseveration, stereotypic behaviors, and dysexecutive syndrome. The patients also met criteria for MRI evidence of atrophy localized to frontal and/or temporal lobes. All of the enrolled ALS patients had "clinically definite" or "clinically probable" ALS according to El Escorial Criteria Revised.9 These criteria required either clinical or electromyographic evidence of combined upper and lower motor-neuron dysfunction in three separate spinal or bulbar regions of innervation. The ALS patients were functionally staged using the ALS Functional Rating Scale-Revised (ALSFRS-R).10 The excluded patients included those with respiratory compromise, as indicated by a forced vital capacity of <70% or symptoms suggestive of nocturnal hypoventilation, as well as those with other neuromuscular or neurological diseases. The bvFTD group did not include any patients who manifested features of ALS. Two bvFTD patients but none of the ALS patients carried the C9orf72 mutation. No other mutations (e.g., MAPT, PGRN, or SOD) were detected in the remaining patients. A group of 37 healthy adults was included as controls, and the three study groups were matched for age, gender, education, and duration of disease. Testing and scanning were conducted at the first clinic visit of each patient.
Ethics statement
All participants or their Person Responsible provided written informed consent in accordance with the Declaration of Helsinki. This study was approved by the South Eastern Sydney Local Health District and the University of New South Wales ethics committees. The genetic status of all patients was unknown.
General cognitive testing
The Addenbrooke's Cognitive Examination Revised (ACE-R) was used to assess the cognitive function of the patients across the following five subscales: attention and orientation, memory, fluency, language, and visuospatial cognition.11 The Cambridge Behavioural Inventory Revised (CBI-R)12 was used to map the neuropsychiatric topography of the patient and the material impact on daily life. This test has been corroborated by the Neuropsychiatric Inventory as an effective measure of neuropsychiatric symptoms.
Imaging acquisition
Subjects were scanned using a 3-T Philips MRI scanner. T1-weighted images were acquired using the following parameters: coronal orientation, matrix=256×256, in-plane resolution=200×161 mm2, slice thickness=1 mm, and TE/TI=2.6/5.8 ms. Diffusion-tensor imaging (DTI) was performed using the following parameters: 32 gradients, TR/TE/TI=8400/68/90 ms, b=1000 s/mm2, five 2.5 mm horizontal slices, end resolution=2.562×562.5 mm3, matrix=96×96, and two repetitions.
Voxel-based morphometry and DTI analyses
An ROI mask was created using the Harvard-Oxford probabilistic cortical and subcortical atlases for gray-matter regions, and the Johns Hopkins University white-matter tractography atlas for white-matter regions. The following regions were included: motor cortex (precentral gyrus, postcentral gyrus, and supplementary motor area), thalamus, striatum (putamen, caudate, and globus pallidus), brainstem, cerebellum, and the associated connecting white-matter tracts between these structures (Fig. 1).
Voxel-based morphometry (VBM) and DTI analyses were performed as detailed previously.4 The significance cutoff for all comparisons between patient and control groups was p<0.05, with correction for multiple comparisons performed using spatial family-wise error (FWE) correction. The interpatient comparisons did not survive FWE correction and were tested at a significance level of p<0.05 with correction for the false discovery rate (FDR), with the exception of the ALS<bvFTD contrast, which did not survive multiple comparison correction and is reported at an uncorrected level of p<0.0001 and a cluster threshold of 20 contiguous voxels.
TMS was applied to 28 patients (15 MND and 13 FTD) within 1 month of MRI scanning. A paired-pulse TT-TMS strategy was applied in accordance with a previously reported technique.5 Motor-cortex excitability short-interval intracortical inhibition (SICI) variables were entered in a covariate-only statistical model with a [1] t-contrast, providing an index of association between decreasing gray-matter volume and lower scores for the experimental measures.
The anatomical locations of significant results were overlaid on the MNI standard brain atlas, with maximum coordinates provided in MNI stereotaxic space. Anatomical labels were determined with reference to the Harvard-Oxford probabilistic cortical atlas. The covariance contrasts were tested at a significance level of p<0.05 with correction for the FDR.
RESULTS
Demographics, functional, cognitive, and behavioral profiles
None of the demographic variables differed significantly between the patient groups and controls. Moreover, the disease duration did not differ significantly between the patient groups (Table 1).
In terms of functional status, 14 of 15 ALS patients were staged using the ALSFRS-R within 1 month of the brain imaging study, and the median ALSFRS-R score was 43 (range 36–46).
The score for the general cognitive measure (ACE-R) differed significantly between the patient groups (p<0.001). Post-hoc comparisons showed that the total ACE-R score was significantly higher for ALS patients than for bvFTD patients, who did not differ significantly from controls. However, the general cognition score was significant lower for bvFTD patients than for controls.
The CBI-R behavioral score differed significantly between the groups (p<0.001), with post-hoc Tukey tests revealing significant differences in all pairwise comparisons (p<0.001). These results confirm that bvFTD patients show more-severe neuropsychiatric disturbances than do ALS patients.
VBM and DTI
Comparisons with controls
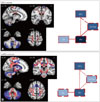
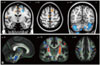
ALS patients showed only minor gray-matter changes relative to controls, mainly in the motor cortex, cerebellum, and thalamus. By contrast, ALS patients showed substantially greater white-matter changes in these regions as well as in the brainstem. Additionally, ALS patients showed substantial corticospinal white-matter tract changes throughout the brain (Fig. 2A).
Compared to controls, severe degenerative changes across all motor-system regions were evident in bvFTD patients, with the cerebellum being particularly affected. Similarly, white-matter changes were widespread and severe in bvFTD, affecting all of the ROIs (Fig. 2B).
Comparison between patient groups
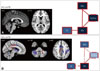
Direct comparisons of ALS and bvFTD revealed minimal gray-matter atrophy in the cerebellum and white-matter changes in the left thalamus in ALS patients (Fig. 3). The bvFTD patients showed substantially more significant atrophy in the motor-cortex, striatal, thalamic, and cerebellar areas, as well as in the connecting white-matter tracts between these structures. A particularly notable observation was the absence of significant differences in the brainstem between the two groups.
Transcranial magnetic stimulation
TT-TMS revealed substantial abnormalities in both the ALS and bvFTD groups, with a lower maximal motor evoked potential (MEP) amplitude, higher MEP/compound-motor-action-potential ratio, and prolonged MEP latency compared to controls (Table 2). The MEP latency was significantly prolonged in bvFTD relative to ALS. The central motor conduction time was significantly prolonged in ALS relative to bvFTD and controls. The maximal cortical silent period in ALS patients was significantly delayed compared to controls, but did not differ from that in bvFTD patients.
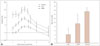
The reduction in SICI differed significantly between the patient groups and controls (Fig. 4A). TT-TMS measures the stimulus intensity required to achieve the target MEP amplitude of 0.2 mV. SICI normally increases with the interstimulus interval, peaking at an interstimulus interval of 3 ms. The increase in stimulus intensity was significantly attenuated in both ALS and bvFTD compared to controls, with no differences between the two patient groups. This pattern was similar for SICI at 1 and 3 ms (Table 2, Fig. 4B).
Finally, intracortical facilitation and the resting motor threshold did not differ significantly among the groups. Similarly, there were no intergroup differences in the neurophysiological index (mean±SD: controls=2.2±0.2, ALS=0.7±0.2, bvFTD=1.0±0.3; all p<0.05).
Neuroimaging covariance analyses of TMS findings
The neuroimaging analyses were restricted to the SICI neural correlate of hyperexcitability, which has been shown to be a reliable and specific marker of motor-cortex dysfunction and ALS pathology.1314 VBM results for the average SICI (blue shading in Fig. 5A) revealed that atrophy in the motor cortex covaried with TMS hyperexcitability in ALS. A particularly notable observation was that for bvFTD patients (yellow/ red shading in Fig. 5A), atrophy in the supplementary motor cortex showed the strongest association with hyper-excitability, with only a limited involvement of motor-cortex areas. Finally, cerebellar atrophy was correlated with the average SICI score in both the ALS and bvFTD groups.
Parallel white-matter analysis using DTI (ALS=blue shading; bvFTD=yellow/red shading) (Fig. 5B) revealed that the average SICI score was significantly correlated with motor-cortex, brainstem, and thalamocerebellar tract white-matter changes in ALS patients, but only with bilateral corticospinal tract changes at the level of the internal capsule in bvFTD patients.
DISCUSSION
The present findings are the first to highlight the presence of dissociation between the functional and structural integrities of the motor system in ALS and bvFTD. Contrary to our hypotheses, white-matter structural changes were not greater in ALS patients than in bvFTD patients. Instead, bvFTD patients showed more atrophy across all of the motor-system regions investigated. In contrast to these structural findings, functional motor-system TMS changes were most pronounced in the ALS group. Cross-correlation analyses of structural and functional deficits revealed that functional changes in the motor system in ALS were mostly associated with motor-cortex and cerebellar atrophy, as well as corticospinal tract degeneration in the brainstem. Supplementary motor-cortex atrophy and corticospinal tract changes at the level of the internal capsule were involved in the generation of the functional deficits evident in bvFTD patients.
The findings for gray and white matter in bvFTD replicate those of previous studies, showing substantial involvement of the thalamus, brainstem, motor cortex, and their underlying white-matter tracts.415161718 However, contrary to our predictions, the degeneration seen in both the gray and white matter in the motor-system network was more wide-spread in bvFTD patients than in ALS patients. While progressive degeneration of the motor cortex, brainstem, and spinal cord is characteristic of ALS,91920 neuroimaging studies have found considerable variability in these regions. Atrophy in the motor cortex is found in 25% of ALS cases,2122 although a recent study highlighted that cortical atrophy in ALS might largely determine the neuropsychiatric and cognitive changes in these patients.23 A review found that corticospinal tract degeneration is more consistently observed in ALS.19 In line with these findings, we found only minor gray-matter changes in the motor cortex, but substantial degeneration of the corticospinal tract in the motor cortex and brainstem. In addition, we replicated previous findings of atrophy in the posterior thalamus in sporadic ALS,24 which have been recently linked with abnormalities in the C9orf72 gene.2526 However, our findings show that such changes might also occur in sporadic ALS; this needs to be confirmed in independent samples in the future.
More importantly, the current study has revealed a dissociation of the structural and functional integrities of the motor system in ALS and FTD. The neurophysiological data obtained using the TT-TMS method—in particular the SICI index (which is a measure of cortical excitability)—replicated the findings of a previous study of ALS and FTD,7 with ALS showing more substantial TMS changes, but with both groups being significantly abnormal compared to age-matched controls. The substantial SICI reduction in ALS despite the significantly greater motor-cortex atrophy in bvFTD patients was striking. This finding raises issues concerning the relationship between macroscopic motor-cortex atrophy and physiological changes. SICI is thought to reflect interneuron motor-cortex changes,1314 which might not parallel macroscopic atrophy. However, it can be assumed that greater macroscopic changes should occur concurrently with greater microscopic changes. Our analysis revealed that motor-cortex atrophy was strongly related to SICI changes in ALS, whereas supplementary motor-cortex changes were correlated with SICI in bvFTD. Thus, although bvFTD patients show greater macroscopic motor-cortex atrophy than do ALS patients, the motor-cortex changes in ALS affect the interneurons targeted by SICI. Future studies contrasting the motor-cortex pathologies in ALS and bvFTD could be greatly beneficial for elucidating whether these patient groups show differences in microscopic motor-cortex changes.
Our cross-correlation analysis also revealed that other upper motor-neuron components or their relay stations can affect SICI signals. More specifically, we found that cerebellar atrophy was strongly associated with SICI changes, particularly in ALS. To our knowledge, this is the first study demonstrating this relationship, and shows that different motor-system areas can modulate upper motor-neuron measures. The connecting white-matter tracts may also influence these measures, including SICI, as suggested by the DTI covariation findings. In particular, changes in the corticospinal tract white-matter integrity in the motor cortex as well as in the brainstem were associated with reduced SICI in ALS, while bvFTD patients showed that the corticospinal tract was only correlated with SICI. Changes in the brainstem and potentially also in the medulla and spinal cord could significantly affect upper motor-neuron measurements in ALS.
Finally, a striking and novel finding was the presence of cerebellar atrophy in both ALS and bvFTD. The cerebellum has been implicated in ALS, with neuroimaging studies demonstrating decreased gray-matter volume in the right cerebellar lobe24 and disturbed connectivity in its white-matter tracts.27 Cerebellar dysfunction is classically associated with motor coordination problems such as ataxia, but little evidence has been reported of ALS or FTD patients showing such symptoms. One clinicopathological FTLD-MND case study found that prominent cerebellar ataxia was associated with microscopic but not macroscopic pathology in the cerebellum. 28 Cerebellar dysfunction has also been associated with neuropsychiatric and cognitive disturbances,29 which is somewhat corroborated by reports that C9orf72 mutations are associated with a higher incidence of psychiatric features30 as well as macroscopic cerebellar atrophy,2531 though no direct link has been established. In keeping with this notion, we found that the cerebellum was more affected in bvFTD than in ALS, with the incidence of neuropsychiatric deficits also being higher in bvFTD. This suggests that cerebellar dysfunction plays a more general role in neurodegenerative disorders than previously supposed.
In terms of clinical relevance, these findings further substantiate the notion of a cognitive and motor continuum across ALS and FTD. However, it is not yet clear whether the physiological motor changes found in early bvFTD are a harbinger of future significant motor symptoms.732 Future longitudinal studies following these motor changes at clinical, imaging, and physiological levels over time should establish whether the motor-system dysfunction seen in bvFTD will eventually lead to full-blown ALS, and elucidate more clearly the relationships between various measures of motor dysfunction. Future studies should also investigate whether the same pattern of functional and structural changes is observed in rarer genetic forms of bvFTD and ALS, such as MAPT, FUS, and SOD1.
In conclusion, this study has revealed gray- and white-matter changes in the motor-cortex—subcortical neural networks in both ALS and bvFTD, and that the cerebellum may contribute to the motor and neuropsychiatric deficits seen in these two disorders. The functional integrity of the motor system was worse in ALS that in bvFTD, despite there being more structural degeneration of the motor system in the latter. Lastly, structural-functional motor-system dissociation was also apparent from cross-correlation analyses of the obtained data sets, which shows that different patterns of structural integrity were related to the functional impairment across groups. These findings will help to elucidate the particular changes in ALS and FTD that cause motor dysfunction, and thereby inform future diagnostic procedures and treatment plans.


 XML Download