

 PDF
PDF ePub
ePub Citation
 Print
Print


INTRODUCTION
Periodic limb movements (PLM) during sleep (PLMS) involve spontaneous and repetitive flexion of the ankle, knee, and hip during sleep, and are present in 90% of patients with restless legs syndrome (RLS).1 Increased risks of cardiovascular disease2 and stroke3 have been reported in patients with RLS, with sympathetic hyperactivity widely suggested as the underlying mechanism.4 Indeed, PLMS have been associated with increased heart rate5 and blood pressure6 during sleep, and are frequently present in patients with daytime hypertension.7 However, further investigation is required to clarify the mechanism underlying PLM, because the causality relationship remains unclear.4
Near-infrared spectroscopy (NIRS) is a nonionizing, noninvasive method of measuring physiological parameters including the oxyhemoglobin concentration (HbO) and the deoxyhemoglobin concentration [Hb].8 Near-infrared light can penetrate several centimeters into tissue, which enables measurement of spontaneous oscillations of [HbO] and [Hb] in brain parenchymal tissue. Because NIRS is portable, comfortable, and relatively insensitive to any movements of the subject, it has been widely used to monitor the cerebral hemodynamics during sleep.9
NIRS signals can be categorized into three frequency bands according to their physiological significance: the first frequency band (0.4-1 Hz) is associated with arterial pulsation; the second band (0.12-0.4 Hz) is referred to as high-frequency oscillations (HFOs), which are affected by respiration;10 and the third frequency band (0.06-0.12 Hz), known as low-frequency oscillations (LFOs), is associated with changes in the cerebral hemodynamics related to neuronal activity, vasomotion,11 and cerebral autoregulation.12 The LFO components of [HbO] and [Hb] signals ([HbO] LFOs and [Hb] LFOs) may represent true changes in the cerebral hemodynamics.13
Only one previous study has used NIRS to evaluate the cerebral hemodynamics changes associated with PLM during sleep.14 Pizza et al.14 analyzed changes in NIRS signals during PLM in three heterogeneous patients, and demonstrated a constant pattern of cerebral hemodynamics changes during PLM. However, their patients had different diseases associated with PLM (RLS, cervical cord ischemia, and migraine), which may represent an important confounder, and they simply analyzed total [HbO] and [Hb] without considering their oscillatory characteristics, which have significance for the cerebral hemodynamics. Alterations in respiration or the heart rate following PLM may have affected the [HbO] and [Hb] signal changes. Moreover, cerebral hemodynamics changes during the other sleep stages were not evaluated, and there was no control group. Therefore, the previously reported results provide no information on whether abnormal hemodynamics changes are related to underlying disease pathophysiology or to PLM.
In the present study we investigated the effect of PLM on the cerebral hemodynamics during PLM, and throughout different sleep stages, in patients with idiopathic RLS with PLMS. We focused on the LFO components of [HbO] and [Hb], and analyzed both their amplitude and phase. The amplitude and phase of cerebral [Hb] and [HbO] LFOs were averaged during the sleep stages and compared between RLS patients with PLMS and healthy controls.
METHODS
Participants
Four female RLS patients, with a PLM index >5 on a polysomnogram (PSG), were included. The diagnosis of RLS was made based on the diagnostic criteria of the National Institutes of Health workshop on RLS.15 A validated Korean-language version of the John Hopkins telephone diagnostic questionnaire16 was administered in a face-to-face interview to exclude conditions that may mimic RLS. RLS severity was determined using the International Restless Legs Scale.17 Four age-matched female subjects who had no sleep disturbance or neurological or psychiatric disorders were included as healthy controls. All of the subjects provided written informed consent, and the experimental protocol was approved by the Institutional Review Board of our local institute.
PSG recordings
PSG recordings were made in all of the participants (controls and RLS patients with PLMS) over a single night in our sleep laboratory. The overnight PSG was recorded using 19 electrodes placed on the scalp (in accordance with the international 10-20 system) for a two-channel electrooculogram, an electromyogram of the submental and anterior tibialis muscles, and an electrocardiogram that used surface electrodes. The electroencephalogram signals were sampled at 200 Hz. A thermistor (to monitor nasal and mouth breathing), cannula (to monitor nasal air pressure), oximeter (to measure oxygen saturation), piezoelectric bands (to determine thoracic and abdominal wall motions), body position sensor, and snoring sensor were also attached. Patients were recorded on videotape using an infrared video camera, and were observed continuously by a PSG technician. Sleep stage was scored in 30-s epochs according to the standard criteria listed in the American Academy of Sleep Medicine sleep scoring manual. Light sleep (LS) was defined as either stage-N1 or -N2 sleep, and slow-wave sleep (SWS) was defined as stage-N3 sleep. PLM were scored according to the American Academy of Sleep Medicine criteria.18
NIRS data acquisition
NIRS data were acquired simultaneously with the PSG data. A custom-manufactured wireless NIRS system was used to measure the cerebral hemodynamics responses.19 This system comprises six LED light sources (three 780-nm sources for detecting [Hb] and three 850-nm sources for detecting [HbO]) and eight silicon photodiode detectors. The light-intensity signals of only six user-defined channels were measured; two channels were selected on the forehead of the subjects to measure the hemodynamics on the left and right sides. The source and detector of the optical probe were separated by 3 cm. The six optical probe sources were multiplexed with an onset time of 10 ms per LED. The sampling frequency was set at 14 Hz.
Analysis of hemodynamics data
We calculated the changes in [HbO] and [Hb] from the light-intensity data based on the following modified version of Beer-Lambert Law:20
where ΔOD is the change in optical density, λ is the wavelength, L is the distance between the source and detector, ɛλ HbO2 and ɛλ Hbr are the extinction coefficients of HbO and Hb, respectively, and B is the differential path length factor (DPF), which compensates for increases in the light path length caused by light scattering in biological tissues. We used DPF values of 6.625 and 6.4 for light at 780 and 850 nm, respectively, which were interpolated from previously reported wavelength-dependent DPF values.21 From Equation 1, ΔHbO and ΔHb can be derived using the following equations:
 The optical density signals were de-trended by third-order polynomial fitting to remove signal drifts not caused by actual changes in the hemodynamics.22 A finite-impulse-response bandpass filter based on the Parks-McClellan algorithm was applied to extract the LFO bands of the hemodynamics responses (i.e., from 0.04 to 0.12 Hz). The measured amplitudes were normalized by dividing by the maximum value for each subject.
(2)
Δ[HbO2]=ελ1HbrΔODλ2Bλ2-ελ2HbrΔODλ1Bλ1(ελ1Hbrελ2HbO2-ελ2Hbrελ1HbO2)L,Δ[Hbr]=ελ2HbO2ΔODλ1Bλ1-ελ1HbO2ODλ2Bλ2(ελ1Hbrελ2HbO2-ελ2Hbrελ1HbO2)L.
We calculated the instantaneous phase difference between oscillations of [Hb] and [HbO] by subtracting the instantaneous phase of [HbO] from the instantaneous phase of [Hb] LFOs. The instantaneous phases of both [Hb] and [HbO] were computed by a complex extension of the original signal s(t) generated by the Hilbert transform:13
where s is the original signal, and š is the Hilbert-transformed original signal. The analytic signal, which represents a complex extension of the original signal, is defined as follows:
Analytic signal a(t) is a complex signal whose real part is the original signal and imaginary part is its Hilbert transform. E(t) is the instantaneous amplitude of the analytic signal and θ(t) is its instantaneous phase. We analyzed the phase differences of LFOs only when the instantaneous amplitudes of the analytic signals-as calculated using the oscillations of ΔOD at 780 and 850 nm-were both above a threshold of 2×10⁻³ cm-1. This threshold was chosen based on the noise values obtained using a tissue-like phantom. We did not analyze data segments that included motion artifacts or signal processing noise, since they can cause a large amount of distortion. All 30-s NIRS data epochs without artifacts were selected, with amplitude and phase differences averaged across each sleep stage from each subject. In RLS patients with PLMS, LS stages containing PLM sequences were included as PLM epochs. We included all PLM sequences regardless of the arousal state, because the arousal events associated with PLM were irregular and had short durations. The number of epochs considered for data processing for each of the eight subjects is reported in Supplementary Table 1 in the online-only Data Supplement.
Statistical analysis
The Mann-Whitney U test was used to compare clinical and PSG characteristics between RLS patients with PLMS and controls. To evaluate changes in the cerebral hemodynamics during the sleep stages, NIRS LFO signals during wakefulness, LS (i.e., LS without PLM in RLS patients with PLMS), SWS, and rapid eye movement (REM) sleep were compared using the Kruskal-Wallis test. In RLS patients with PLMS, we compared the amplitude and phase of [Hb] and [HbO] between LS with and without PLM using the Wilcoxon signed-rank test in order to evaluate hemodynamics changes during LS with PLM. A probability value of 0.05 was considered to be indicative of statistical significance. All of the analyses were performed using the SPSS for Windows software package (version 12.0, SPSS Inc., Chicago, IL, USA).
RESULTS
Clinical and PSG data
The clinical and PSG characteristics in each group are summarized in Table 1. The median age of the RLS patients with PLMS was 53 years (range: 52-56 years), compared to 52 years (range: 43-58 years) for the normal controls. All of the subjects were female. The age, body mass index, total sleep time, sleep latency, wakefulness after sleep onset, sleep efficiency, proportion of time spent in each sleep stage, arousal index, and apnea-hypopnea index did not differ significantly between the groups. RLS patients with PLMS exhibited a median PLM index score of 14.2/h and a median PLM arousal index score of 4.6/h, which were both higher than in the normal controls (p=0.018 and p=0.019, respectively).
Cerebral hemodynamics changes according to sleep stage
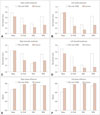
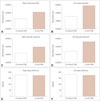
Fig. 1 displays the amplitude and phase differences of the measured [HbO] and [Hb] LFOs during the different sleep stages [wakefulness, LS (LS without PLM in RLS patients with PLMS), SWS, and REM sleep]. Overall, a progressive decreasing trend in the median amplitude of [HbO] and [Hb] LFOs was observed between wakefulness and SWS in both the patient and control groups. In contrast, there was a trend toward a progressive increase in the median phase difference between [HbO] and [Hb] LFOs between wakefulness and deeper sleep stages in both groups. The [HbO] and [Hb] LFO phase differences differed significantly with the sleep stage in the normal control group (p=0.033); however, there was no significant difference in the group of RLS patients with PLMS.
Differences in cerebral hemodynamics between patients and controls
The [HbO] and [Hb] LFO amplitude and phase differences were compared between the patient and control groups according to sleep stage. Significant differences in the amplitude of [HbO] and [Hb] LFOs were observed between the patients and controls during REM sleep. The amplitude of [HbO] LFOs measured in the right frontal area was higher in RLS patients with PLMS than in controls during REM sleep (median amplitude=0.59 vs. 0.37, p=0.043). In contrast, the amplitude of [Hb] LFOs was higher in the left frontal area in RLS patients with PLMS than in controls (median amplitude=0.55 vs. 0.13, p=0.021). No differences between the two groups in [HbO] and [Hb] LFO amplitudes were found during LS (LS without PLM in RLS patients with PLMS) and SWS. There were no significant differences in [HbO] and [Hb] LFO phase differences between the RLS patients with PLMS and controls during any sleep stage (Supplementary Table 2 in the online-only Data Supplement). We compared [HbO] and [Hb] LFO amplitude and phase differences between RLS patients with PLMS during LS with PLM and normal controls during LS. RLS patients with PLMS exhibited higher [HbO] LFO amplitudes in the right frontal area (median amplitude=0.77 vs. 0.33, p=0.043) and higher [Hb] LFOs in the left frontal area (median amplitude=0.67 vs. 0.15, p=0.043) compared to controls with no significant PLM. However, there were no significant phase differences between the two groups (Supplementary Table 3 in the online-only Data Supplement).
Cerebral hemodynamics changes during LS with PLM in RLS patients with PLMS
To assess the effect of PLM during LS in patients with RLS and PLMS, we compared [HbO] and [Hb] LFO phase difference and amplitude changes during LS without PLM with the values obtained during LS with PLM (Fig. 2). Phase differences between [HbO] and [Hb] LFOs tended to decrease when PLM was present in both frontal areas (p=0.068). Furthermore, the amplitude of [HbO] LFOs tended to increase when PLM was present in the right frontal area (p=0.068).
DISCUSSION
The present study has demonstrated the presence of low-frequency spontaneous cerebral hemodynamics oscillatory changes in RLS patients with PLMS. Increases in [HbO] and [Hb] LFO amplitudes were observed in RLS patients with PLMS compared to control subjects during both LS with PLM and REM sleep.
The cerebral hemodynamics activity exhibited dynamic changes according to sleep stage in healthy controls. Several NIRS sleep studies have demonstrated changes in the LFO components [HbO] and [Hb] across sleep stages. One study found that the power of both [Hb] and [HbO] LFO oscillations was lower during sleep than during wakefulness,23 while another found a progressive decline in the amplitude of [HbO] and [Hb] LFOs from wakefulness to SWS.13 No statistically significant changes in amplitude were found in the present study, although we did observe a trend similar to that found in previous studies.
The phase difference between [HbO] and [Hb] LFOs changed according to sleep stage in our normal control group, in line with the findings of previous studies. This result is due mainly to changes in the amplitude of the cerebral blood volume and flow velocity oscillations, rather than to changes in its phase.13 However, the phase did not differ significantly according to sleep stage in RLS patients with PLMS, suggesting that normal oscillatory hemodynamics changes during sleep were disrupted in this group.
PLM was associated with the changes in cerebral hemodynamics. The amplitudes of [HbO] and [Hb] LFO oscillations were elevated in RLS patients with PLMS during LS with PLM-but not during LS without PLM-compared to normal controls during LS. This change can be interpreted in terms of the cerebral blood volume, blood flow velocity, and metabolic rate of oxygen (CMRO2). Increased [Hb] and decreased [HbO] can be interpreted as indicating a decrease in the cerebral blood flow (CBF),24 while increased [HbO] and decreased [Hb] can be considered to reflect a decrease in CMRO225 or an increase in CBF.26 Therefore, our results suggest that increases in CBF and cerebral oxygen metabolism in frontal regions are associated with PLM, indicating hyperarousal during sleep in RLS patients with PLMS. Whether PLM can alter the cerebral hemodynamics in RLS patients with PLMS was further assessed by comparing NIRS signals during LS with and without PLM period. However, the amplitude and phase differences did not differ according to PLM status in the patient group. The effect of PLM on the cerebral hemodynamics may be reduced in RLS patients with PLMS, because RLS itself can increase cortical arousal levels regardless of PLM.
PLMS is known to be associated with frequent arousal and cortical activation. Electrophysiological studies have found increased prefrontal beta-band power and elevated beta oscillations in the motor cortex of patients with PLM.27 The cortical activation associated with PLMS may change the cerebral hemodynamics, and functional imaging studies have demonstrated activation of the subcortical structures-the red nucleus,28 thalamus, and putamen29-that are associated with PLM and are connected to the prefrontal cortex. Together these data indicate that activation of the prefrontal cortex may increase the regional cerebral hemodynamics during PLM, as demonstrated by NIRS in the present study.
The cerebral hemodynamics activity during REM sleep differed significantly between the RLS patients with PLMS and controls. The patients exhibited higher [HbO] LFO amplitudes in the right frontal area and higher [Hb] LFO amplitudes in the left frontal area, both compared to controls. It is of particular interest that the change in hemodynamics occurred even during REM sleep in the RLS patients with PLMS. RLS can also occur during REM sleep, but only one of our patients exhibited PLM during REM, which implies that the difference may not be due simply to PLM. Because sympathetic fluctuations are greater during REM sleep,30 differences in the cerebral hemodynamics may be evident during this stage. Changes in the cerebral hemodynamics may be caused by both the cerebral activation associated with PLM and the sympathetic hyperactivity associated with RLS.
The data reported herein should be interpreted in light of some limitations. First, the number of patients enrolled may have been insufficient to reveal phase differences between [Hb] and [HbO] LFOs. Furthermore, the multiple comparisons may have been confounded by the application of simple nonparametric measures to compare NIRS parameters during each sleep stage (due to the smallness of the sample).
We analyzed the slow spontaneous cerebral hemodynamics during sleep in RLS patients with PLMS. The [Hb] and [HbO] LFO amplitudes were elevated during LS with PLM, and during REM sleep in the patient group. These data indicate that changes in the oscillatory components of blood volume and flow velocity occur during both non-REM and REM sleep in RLS patients with PLMS, which may increase the risk of cerebrovascular disease. Further studies involving larger samples may help to clarify these cerebral hemodynamics changes in RLS patients with PLMS.

 XML Download