

 PDF
PDF ePub
ePub Citation
 Print
Print


INTRODUCTION
Strokes are an important cause of mortality and morbidity worldwide. The consequences of stroke can be severe, leading annually to 5 million deaths and another 5 million people being left permanently disabled.1 While hemorrhagic stroke/intracerebral hemorrhage (ICH) is less common than ischemic stroke, the prognosis of ICH is substantially worse than those conditions with an ischemic etiology. The proportion of stroke patients with ICH was 14.5% in an Australian study, with a 28-day mortality of 45%, similar to data obtained in Europe and the US.2 The threat from ICH appears to be growing (perhaps due to an aging population), as indicated by a 47% increase in its incidence and a 20% increase in the number of deaths during 1990-2010 in the Global Burden Disease Study.3
Several studies in recent years have therefore focused on deriving and validating prognostic scores for detecting early mortality after an ICH in the acute setting. This is particularly pertinent given that the risk of a poor outcome is higher for ICH than for the other stroke subtypes,4 and the use of a prognostic model has been found to confer greater accuracy than merely relying on clinical judgment.5 In the absence of well-established interventions to reduce deaths from ICH, accurate prognostic tools may prove useful for informed decision-making in the acute phase of ICH, including the options of transferring to intensive care, rehabilitation, and palliation. In the research setting, prognostic scores may also prove useful for the risk stratification of participants in clinical trials of interventions for ICH.
Published systematic reviews of prognostic models in ICH date back at least 10 years,67 and the only recent systematic review that we are aware of was reported in a conference abstract in 2010, and has not been reported elsewhere in more detail.8 A comprehensive update seems timely given 1) the recent publication of new studies that have evaluated different prognostic scores and 2) the absence of a unified system that is accepted in routine clinical practice.
Hence, in the present study we aimed to synthesize the recent evidence on prognostic tools in patients presenting with ICH, and to determine the comparative performances of different scores.
METHODS
Eligibility criteria
We selected studies that collected clinical variables (or sets of these variables) used to calculate risk scores predicting early mortality (<6 months) in adult patients at the time of presentation with ICH. We stipulated that studies had to have a sample size of >100 participants, with the main focus being on those presenting with primary ICH. Our specific interest was the reporting of the discrimination ability of the tool, measured based on the area under the receiver operating characteristic curve (AUC) or c-statistic. We aimed to base our systematic review on more-up-to-date evidence, and as such restricted our selection to the past decade; that is, studies published from 2004 to April 2014.
We excluded studies that were aimed solely at determining correlations between mortality and single laboratory (e.g., albumin or troponin) or radiological (e.g., lesion volume) variables. We did not include studies of only functional outcomes. Since our main focus was on stroke patients presenting to healthcare facilities and we wanted to maximize the generalizability of the findings, we excluded studies involving narrow subgroups of ICH patients who had been deemed to require admission to intensive care. We also excluded studies that focused on mortality in specific subsets of patients (e.g., following certain interventions such as thrombolysis) or those that specifically evaluated the prognosis of a stroke affecting a particular brain area (e.g., basal ganglia).
Search strategy
We searched MEDLINE and EMBASE (in April 2014, using the OvidSP interface) using the search terms listed in Supplementary (in the online-only Data Supplement), without any language restriction. We also checked the bibliographies of the included studies for other potentially suitable studies.
Study selection and data extraction
Study screening and data extraction were performed by pairs of reviewers (selected from K.M., C.S.K., K.P., and Y.K.L.) who independently scanned all titles and abstracts for potentially relevant articles, whose full-text versions were retrieved for further detailed evaluation. Any uncertainties and discrepancies were resolved through discussion and with a third reviewer. We also contacted authors if any aspects of their articles required further clarification.
We used a standardized form for data collection that included details of the setting and date of the study, geographical location, selection criteria, and other characteristics of the participants, and outcome measures.
Assessment of study validity
Study validity was assessed by pairs of reviewers independently checking whether there was clear reporting of the times of patient assessments, missing or incomplete data, use of standardized treatment protocols, and whether the study involved a derivation or validation cohort.
Data analysis
Statistical analysis was conducted by an experienced meta-analyst (Y.K.L.) using Cochrane Collaboration RevMan 5.3 software (Nordic Cochrane Centre, Kobenhavn, Denmark).
We chose to base our analysis on the AUC or c-statistic since these are equivalent measures of the discrimination ability for binary outcomes.9 In the present context the discrimination ability refers to how well the model separates patients who subsequently die from those who are survivors. For studies that investigated both derivation and validation components, we chose to analyze data relating to the validation portion. If different mortality time points were used in a particular study, we used 30 days as the first choice and inpatient mortality as the second choice, and where neither was available we accepted a time point of <6 months for analysis. If multiple AUC values were available for a particular prognostic tool, we calculated a weighted pooled average using a random-effects inverse-variance meta-analysis. If the AUCs were listed without standard errors, we determined these values through Hanley's method and the 95% confidence intervals (CIs).10
We assessed heterogeneity using the I2 statistic and by visual inspection of Forest plots. The performance of the prognostic score was judged according to the following AUC thresholds that have been described by other researchers: excellent (AUC ≥0.90), good (AUC ≥0.80 and <0.90), fair (AUC ≥0.70 and <0.80), and poor (AUC <0.70).11
RESULTS
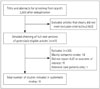
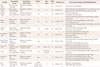
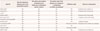
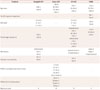
We selected 11 relevant studies from 2,603 articles identified by searching the electronic databases (the flow chart of study selection is shown in Fig. 1).45121314151617181920 The characteristics and results of the included studies are reported in Table 1, and our appraisal of study validity is presented in Table 2. Variables required for the calculation of each prognostic model are listed in Table 3.
The included studies involved 41,555 participants (sample sizes ranged from 154 to 37,509 in the 11 studies) with a mean age of 67 years, while 55% of them were male. Six of the studies addressed the 30-day mortality, three addressed inpatient mortality,131920 and two addressed mortality at 90 or 120 days.45 Four studies recruited patients from two or more healthcare sites.451219 The geographical locations were diverse, and included North America, Europe, Mexico, and East Asia. Data from the study performed in Taiwan were reported in two separate articles, with Hemphill-ICH scores available from one and ICH-Grading Scale (GS) scores from the other, with substantial overlap in the included patients.1621
Validity assessment
Most of the studies had a retrospective design, or performed post-hoc analyses of prospectively collected clinical data. We were able to determine that the prognostic variables were collected early in the course of the presentation in five studies. 516171819 Treatment pathways were seldom reported, with only one study explicitly stating that all participants received similar care.5 Details on losses to follow-up or missing data were reported for seven studies (Table 2).451214151718 Eight studies aimed to perform model validation, two had a mixed derivation-validation design,1820 and one that had a purely derivation design.13 We considered the findings of these derivation studies to be less robust than those that had been submitted for external validation.
Quantitative comparison of AUC
We were able to evaluate the following prognostic models in the comparative quantitative analysis: Hemphill-ICH22 (nine cohorts)4512141516171820 and ICH-GS (four cohorts).4151618
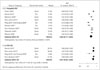
The AUCs from individual studies and the pooled mean AUCs across studies are shown in Fig. 2.
Hemphill-ICH score
The predictive accuracy of the Hemphill-ICH model for mortality has been evaluated in 9 cohorts comprising 3,819 participants worldwide.4512141516171820 Point estimates of the AUC ranged from 0.72 to 0.88, with a weighted pooled average of 0.80 (95% CI=0.77-0.85) across all studies. Subgroup evaluation according to the mortality time point found that data from six cohorts were for the 30-day mortality (pooled AUC=0.81, 95% CI=0.76-0.86),121415161718 while two were for the 90- or 120-day mortality (pooled AUC=0.79, 95% CI=0.70-0.88).45 When we excluded the study with the lowest 30-day mortality rate, the overall AUC remained good at 0.82 (95% CI=0.78-0.85).
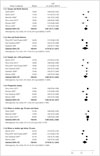
We conducted subgroup analyses looking at the prognostic value of the Hemphill-ICH model according to study design and patient characteristics (e.g., age and geographical location). We found that Hemphill-ICH scores generally performed well across different subgroups (Fig. 3), but there was a possible slight decrease in performance in those studies conducted outside of North America and Europe, or in those where the participants were on average younger than 70 years.
Hemphill-ICH versus ICH-GS scores
An overall comparison of the two subgroups using the Hemphill-ICH and ICH-GS scores showed that the AUC differed significantly (p=0.01) between these two subgroups, with the ICH-GS score exhibiting better overall discrimination performance (Fig. 2). We also assessed four studies that evaluated both the Hemphill-ICH and ICH-GS scores in the same sample of participants.4151618 The greatest difference in the comparative predictive accuracies of the Hemphill-ICH and ICH-GS models was seen in the cohort of Garrett et al.,4 with a reported difference of 0.14 in the AUC, favoring the ICH-GS model. In contrast, the other three studies demonstrated far smaller absolute differences in AUC, with an average difference of 0.03 that was also in favor of the ICH-GS model.
Get With The Guidelines (GWTG) model with or without National Institutes of Health Stroke Scale (NIHSS)
Only one study analyzed the performance of the GWTG score for predicting inpatient mortality,19 that study enrolled 37,509 participants in US and Canada. The GWTG alone (based on age, vascular risk factors, comorbid conditions, and mode of arrival at the hospital) does not require a detailed clinical examination or neuroimaging, but in that study it demonstrated a relatively poor predictive accuracy with an AUC of 0.66. However, combining the GWTG model with the NIHSS (in 10,352 participants) resulted in a markedly improved pooled AUC of 0.82.
Glasgow Coma Scale (GCS)
We identified only one recent study that involved a prognostic validation of the GCS.15 That study recruited 1,364 participants in the UK and found an AUC of 0.87 (95% CI=0.85-0.89), which was similar to the AUC values obtained by applying the Hemphill-ICH and ICH-GS models to the same participants.
Functional outcome risk stratification scale (FUNC)
Garrett et al.4 validated the prognostic accuracy of the FUNC score in 366 patients in the US, and found an AUC of 0.87 (95% CI=0.83-0.90) for 90-day mortality. The AUC for the FUNC indicated similarly good predictive accuracy to that reported with the ICH-GS score in the same participants, whereas the Hemphill-ICH score only exhibited fair performance in that cohort.
Essen-ICH score
The Essen-ICH score was validated in 1 study involving 371 German patients.5 The AUC of 0.83 (95% CI=0.78-0.88) for the Essen-ICH model was similar to those obtained when applying the Hemphill-ICH and Cheung-ICH models to the same sample of patients.
Other prognostic models
We identified data for two prognostic tools [classification and regression trees (CART) and ICH Index] that have yet to be validated but which showed good predictive value (AUCs of 0.86 and 0.92, respectively) during derivation.1320 The CART model is based only on three variables-size of hemorrhage, age, and score on the Japan Coma Scale20-whereas the ICH Index was constructed based on age, GCS score, glucose level, and white cell count but without the use of neuroimaging.13
DISCUSSION
ICH is associated with the highest morbidity and mortality of all types of stroke. We have systematically evaluated recent data obtained by applying several models to predict mortality in ICH, and found the Hemphill-ICH score to have the broadest evidence base. This score has exhibited generally consistent predictive accuracy throughout several studies worldwide covering thousands of patients in eight countries (China, Japan, Germany, the US, Mexico, Argentina, Taiwan, and the UK). Although the Hemphill-ICH score was introduced more than 10 years ago, it is not yet widely adopted in clinical practice. Instead, we found numerous instances where researchers have modified the Hemphill-ICH score to try and improve its predictive accuracy, with varying degrees of success. The availability of several versions of the ICH score can seem bewildering-an important finding of our systematic review is that the ICH-GS score seems the one most likely to offer some consistent advantage over the original Hemphill-ICH score. The slightly improved performance when using the ICH-GS score may stem from the greater detail with which the site and size of the hemorrhage are considered, as well as the inclusion of additional age categories (Table 3). However, we recognize that these changes may make the ICH-GS score more complicated to calculate in practice.
We also identified variations in the complexity and in the requirement for specialist knowledge when using some of the tools (e.g., reproducibility when interpreting hemorrhage volume on CT scans and calculation of subscores such as the NIHSS). The need for specialist expertise may prove to be a barrier in emergency departments where clinicians may prefer a tool that is simply based on clinical variables, such as the GCS and the (as yet unvalidated) ICH Index.1315 Indeed, Parry-Jones et al.15 found that the AUC of the GCS score was as good as that of the ICH score in a UK validation cohort, but we were unable to identify other recent data sets for confirming the generalizability of these findings. This is an interesting point, since the GCS score can be rapidly assessed at the initial presentation and does not require specialist neurological imaging procedures or expertise. Further validation studies of the GCS score and ICH Index would be useful, particularly in resource-poor areas or as initial triage tools in nonspecialized healthcare facilities.
Several prognostic models are associated with additional complexity due to them requiring a detailed neurological examination to estimate the NIHSS score.519 For instance, the GWTG model exhibited a poor AUC score (<0.7) when it was applied alone, but this improved to a good AUC score when it was combined with the NIHSS.19 Having to use both GWTG and NIHSS scores together may prove too laborious for clinicians, particularly given that dedicated online training is required for calculating the NIHSS score.23 The Essen-ICH score also requires calculation of the NIHSS score and this might equally limit its acceptability, particularly given that a previous study found no marked improvement in AUC over that for the Hemphill-ICH score.5
Most of the available studies have not addressed the acceptability and uptake of current prognostic scores in the day-to-day management of stroke patients. While the availability of a prediction rule with good performance is an important prerequisite, patients will not benefit from the proliferation of prognostic scoring models if their uptake and implementation is patchy. It is important to determine what clinicians want or expect from a score and what factors would facilitate their use of it. Furthermore, the expectations of patients and their relatives also need to be considered, such as by determining whether prognostic scoring is acceptable and useful to interactions (as compared to relying on clinical judgment). Shared decision-making is pivotal in modern medicine, but our systematic review shows that none of the current prognostic models are able to achieve excellent performance, and thus the acceptability of imperfect results needs to be assessed. We note that a survey found that 96% of emergency physicians were prepared to use a prognostic tool for stroke or death in patients with transient ischemic attacks, but only if the tool achieved a sensitivity of >97%.24
Our systematic review has limitations. We focused only on larger studies (>100 participants) published during the last 10 years, and emphasized overall mortality-because of the high rate of early mortality in ICH-rather than the functional outcome. Most of the included studies had a retrospective design or were post-hoc analyses of prospectively collected clinical data, and we did not categorize the studies into high- and low-quality subgroups. We selected published studies that used the AUC or c-statistic as their primary measure, and it is possible that studies that found poor performance have not been reported on.
The strengths of our systematic review are that we conducted an exhaustive and up-to-date search of the current evidence, accompanied by critical appraisal and quantitative data analysis. To the best of our knowledge, none of the previous systematic reviews have performed a meta-analysis of discrimination ability. We have summarized the evidence for the relative performances from comprehensive data sets to help guide stroke researchers and clinicians as to which score to use, further develop, or test.
A key question to consider is whether we genuinely need further research that might involve only minor modifications to the Hemphill-ICH model, and which may not provide more than minor incremental benefits to the clinical accuracy. The proliferation of variants of the Hemphill-ICH model may simply cause greater confusion amongst clinicians and thereby have a detrimental effect on clinical implementation. Future studies should focus on the factors that influence the acceptability and adoption of scoring systems, and whether their implementation leads to consistent improvements in patient care relative to simply using subjective clinical judgment.
In conclusions, we have highlighted several prognostic scores that exhibit good performance in ICH, the front runners being the Hemphill-ICH score and the ICH-GS variant, which we believe can usefully guide clinicians in making better-informed treatment decisions. Although further validation studies are needed, the GCS and ICH Index may also be reasonable options in situations where simple and rapid clinical assessment is needed before neuroimaging results become available, such as during triage when a patient initially presents to a healthcare facility.
 XML Download