

 PDF
PDF ePub
ePub Citation
 Print
Print


INTRODUCTION
Hyperkalemic periodic paralysis (hyperKPP) is an autosomal-dominant muscle sodium-ion channelopathy with a high degree of penetrance. It is caused by mutations in the SCN4A gene, which encodes the α subunit of the skeletal muscle voltage-gated sodium-channel Nav1.4.12 HyperKPP is characterized by attacks of generalized or focal flaccid muscle weakness. Although most affected individuals have normal muscle strength between attacks, some develop fixed or chronic progressive weakness, independently of the presence of episodic attacks.345 Fixed weakness in hyperKPP appears to be common in older patients with a long disease duration.34 It has been proposed that Na+ overload in muscle fibers can lead to muscle degeneration that increases with age.6 However, little is known about the development of fixed weakness in hyperKPP, including the pattern of muscle involvement.
Muscle magnetic resonance imaging (MRI) is a very useful method for evaluating muscle involvement, visualizing muscle fat content, and quantifying the fat fraction in muscle disorders.7 Characterization of the muscle involvement patterns in several muscle disorders has improved the diagnostic workup process and guided genetic testing. MRI of muscle can also reveal the replacement of skeletal muscle by fat, which occurs in the late stages of many muscle disorders.8 A previous muscle MRI study found that hyperKPP patients with fixed weakness showed more fatty change in calf muscles compared to those without fixed weakness and healthy controls.6 However, that study could not elucidate the whole-body muscle involvement patterns since only the lower leg was evaluated. In addition, fat-fraction maps of patients with hyperKPP have not been reported previously, particularly such maps obtained by Dixon-based fat and water mapping technique. Thus, the aim of the present study was to characterize the patterns of muscle involvement in hyperKPP patients with the SCN4A mutation T704M with the aid of whole-body MRI.
METHODS
Patients
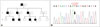
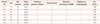
This study was approved by the Institutional Review Board at our institution (IRB no. 4-2013-0167). Written informed consent was obtained from all patients. Seven hyperKPP patients from one family were included in this study. Genetic analysis was performed, and all seven patients were found to have the T704M mutation in the SCN4A gene (Fig. 1). The clinical features of the patients are summarized in Table 1.
Manual muscle strength
Manual muscle strength was measured according to the modified Medical Research Council scale converted to a score from 0 to 10 points as follows to facilitate the purposes of our analysis: 0=0, 1=1, 2=2, 3-=3, 3=4, 3+=5, 4W=6, 4=7, 4S=8, 5-=9, and 5=10.9 Two neurologists (H.E.L. and H.S.L. with 2 years and 1 year of experience in neuromuscular disorders, respectively) who were blinded to the clinical information assessed the scale using consensus. Muscle strength was evaluated during the interictal state on the same day as the MRI scan.
Muscle imaging
In all seven patients, whole-body MRI was performed using a 3.0-T MRI system (Magnetom Trio, Siemens, Erlangen, Germany), which was equipped with multiple phased-array surface coils with a maximum gradient amplitude of 40 mT/m and a maximum slew rate of 200 mT/m/ms. A series of images acquired successively in a coronal orientation at an identical slice level was automatically combined to generate a single coronal composite view using the manufacturer's optional software. No manual realignment was needed.
The following parameters were typically used using data acquisition:
1) Axial in-phase and opposed-phase T1-weighted volumetric interpolated brain examination (VIBE), with relaxation time (TR)=10 ms, echo time 1 (TE1)/echo time 2 (TE2)=2.45/3.68 ms, and field of view (FOV)=24 cm for the forearm, and TR=5.54 ms, TE1/TE2=2.45/3.68 ms, and FOV=50 cm for the thigh and lower leg. Other parameters included slice thickness=5 mm, number of slices=60, acquisition matrix=256×192, flip angle (FA)=13°, and number of excitations (NEX)=1.
2) T1-weighted fast spin echo (FSE) MR images, with TR/TE=550/12 ms and FOV=20 cm for the forearm, TR/TE=557/11 ms, and FOV=50 cm for the thigh, and TR/TE=608/11 ms and FOV=50 cm for the lower leg. Other parameters included slice thickness=5 mm, interslice space=10 mm, acquisition matrix=384×308, FA=14°, and NEX=2.
No paramagnetic contrast agent was injected, and neither cardiac nor respiratory gating was performed. A multi-breathhold option was added to the thoracic sequence steps in spontaneously breathing patients who were able to hold their breath.
After the MRI scan, water and fat maps were reformatted from in-phase (TE1=2.45 ms) and opposed-phase (TE2=3.68 ms) MR images in the console. The fat-fraction map was obtained using the equation [F/(W+F)]×100, where F and W are the signal intensities of the fat and water maps, respectively.
Data analysis
All images were assessed using consensus by two musculoskeletal radiologists with expertise in MRI and who were blinded to the clinical information (Y.H.L. and S.H. with 9 years and 1 year of experience in musculoskeletal MRI, respectively). Analyses of axial in-phase and opposed-phase T1-weighted VIBE MR images of the forearm, thigh, and lower leg were performed by a commercial Picture Archiving and Communication System (PACS) viewer (Centricity® PACS RA1000, GE Healthcare, Barrington, IL, USA). The exact locations of axial images were determined using the coronal images as a reference.
Muscles were assessed for both atrophy and fatty infiltration. Muscle atrophy was defined as an obvious loss of muscle volume, and scored as present or absent. The fatty infiltration as evident in T1-weighted FSE images was assessed according to the distribution of abnormal muscle signal intensities, and the grade of involvement was ranked from 1 to 4 as described previously:10 1, normal appearance; 2, mild involvement of less than 30% of the muscle; 3, moderate involvement of 30% to 60%; and 4, severe involvement of more than 60%. The following muscles were assessed: infraspinatus, supraspinatus, subscapularis, biceps brachii, triceps, flexor carpi ulnaris, flexor carpi radialis, flexor digitorum profundus, flexor digitorum superficialis, brachioradialis, extensor carpi ulnaris, extensor carpi radialis, extensor digitorum communis, supinator, pronator teres, gluteus minimus, gluteus medius, gluteus maximus, iliopsoas, obturatorius internus, obturatorius externus, pectineus, rectus femoris, vastus lateralis, vastus medialis, vastus intermedius, semimembranosus, semitendinosus, biceps femoris, sartorius, gracilis, adductor brevis, adductor longus, adductor magnus, gastrocnemius lateralis, gastrocnemius medialis, soleus, tibialis anterior, tibialis posterior, extensor digitorum longus, and peroneus. In total, 84 muscles were evaluated.
Fatty infiltration was quantified by assessing the fat fraction from fat and water maps derived from the in-phase and opposed-phase VIBE MR images by using region-of-interest (ROI) analysis. The fat fraction was quantified by performing measurements in 5×5 mm2 ROIs. When heterogeneously fatty changes in muscles were observed in in-phase VIBE MR images, the ROIs were positioned in the area with the greatest fatty change per unit area of muscle. Measurement-related errors and intraobserver variability were minimized by measuring the ROIs twice, with the average values being recorded. The dorsal and ventral muscle groups of the forearm were recorded at the middle level of the forearm; the anterior, medial, and posterior muscle groups of the thigh were recorded at the lower-third level of the thigh; and the anterior, lateral, deep posterior, and superficial posterior muscle groups of the lower leg were recorded at the middle-to-lower level of the lower leg.
Genetic analysis
Genomic DNA was extracted from peripheral blood lymphocytes of patients using a standard protocol, and the entire 24 coding exons and the exon-intron boundaries in the SCN4A gene were amplified by the polymerase chain reaction (PCR). The primer sequences and PCR amplification conditions are available upon request. The PCR products were electrophoresed on 1.2% agarose gels, and the amplified genomic DNA fragments were extracted and purified using the QIAquick Gel Extraction Kit (Qiagen, Hilden, Germany) according to the manufacturer's recommended protocol. Both strands were directly sequenced with BigDye terminator chemistry (PE-Applied Biosystems, Foster City, CA, USA), and each electropherogram was analyzed using Chromas 2.33 software (Technelysium, Queensland, Australia).
Statistical analysis
The Mann-Whitney U test and Fisher's exact test were used to compare continuous and categorical variables, respectively. The relationships of the muscle fat fraction with patient age and manual muscle strength were assessed by Pearson correlation coefficients. Statistical analyses were performed using IBM SPSS statistics software (SPSS Windows version 20.0, IBM, Armonk, NY, USA). A two-tailed probability value of p<0.05 was considered statistically significant.
RESULTS
Manual muscle strength
Manual muscle strength was measured on the same day that the MRI scan was performed; the results are presented in Supplementary Table 1 (in the online-only Data Supplement). The manual muscle strength score was 8, 9, or 10 in most muscles across the study patients, and lowest in patient II:1. The muscle strength of patient III:4 was normal in all muscle groups.
MRI findings
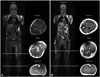
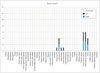
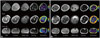
MRI scans were performed on all study participants, and images of selected patients (II:1 and III:4) are shown in Fig. 2. Muscle atrophy was present in three (II:1, II:2, and II:3) of the seven patients. The following muscles were found to be atrophic: gastrocnemius medialis (6 muscles in 14 lower extremities examined), gastrocnemius lateralis (6/14), soleus (4/14), vastus lateralis (4/14), vastus medialis (1/14), vastus intermedius (1/14), and rectus femoris (1/14) (Fig. 3). All atrophic muscles were in the posterior compartment of the lower leg or the anterior compartment of the thigh. No atrophic muscles were present in the upper extremities, and no hypertrophy was found.
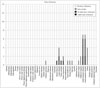
Fatty infiltrated muscles were found in four patients (II:1, II:2, II:3, and III:3), all of which were in the lower extremities, with the muscles in the posterior compartment of the lower leg more frequently and severely affected than those in other parts of the lower extremities (Fig. 4). In patient II:1, moderate fatty infiltration (score 3) was evident bilaterally in vastus lateralis, gastrocnemius medialis, and gastrocnemius lateralis, the left rectus femoris, the left vastus medialis, and the left vastus intermedius, and mild fatty infiltration (score 2) was found in the right gluteus maximus, the right adductor magnus, the right vastus intermedius, the left sartorius, and both solei. In patient II:2, moderate fatty infiltration was evident bilaterally in gastrocnemius medialis and gastrocnemius lateralis, and mild fatty infiltration was found bilaterally in vastus lateralis, the right semitendinosus, the right biceps femoris, the right adductor longus, the right adductor magnus, and both solei. In patient II:3, severe fatty infiltration (score 4) was evident bilaterally in gastrocnemius medialis and gastrocnemius lateralis. In patient III:3, mild fatty infiltration was evident in the left gastrocnemius medialis and gastrocnemius lateralis.
Fat quantification
Fatty infiltration was quantified by assessing the fat fraction from fat and water maps derived from the in-phase and opposed-phase VIBE MR images (Fig. 5). The muscle fat fractions as determined by the two-point Dixon technique are presented in Supplementary Table 2 (in the online-only Data Supplement).
Correlation between muscle fat fraction and patient age
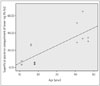
The muscle fat fraction as measured by the two-point Dixon technique increased with patient age in the anterior thigh (r=0.669, p=0.009), in the deep posterior compartment of the lower leg (r=0.617, p=0.019), and in the superficial posterior compartment of the lower leg (r=0.777, p=0.001) (Fig. 6). There were no significant correlations between patient age and fat fraction in muscles of the forearm (ventral and dorsal compartments), the medial and posterior thigh, and the anterior and lateral compartments of the lower leg (Supplementary Table 3 in the online-only Data Supplement).
Correlation between muscle fat fraction and manual muscle strength
There were no significant correlations between manual muscle strength and fat fraction of the muscle groups in the relevant regions (Supplementary Table 4 in the online-only Data Supplement).
DISCUSSION
Fixed weakness and chronic progressive myopathy in patients with hyperKPP are difficult to assess, and there is a need for objective biomarkers to be identified. It is clinically impossible to distinguish fixed weakness from sustained episodic paralysis in hyperKPP patients. Although a muscle biopsy may reveal muscle fiber atrophy with vacuoles,3 this procedure is invasive and inappropriate for the evaluation of muscle involvement patterns and disease progression. In this study we analyzed whole-body muscle MRI findings in patients with hyperKPP. Our results demonstrate that muscle atrophy and fatty infiltration-both of which are suggestive of chronic progressive myopathy-are present in hyperKPP patients, especially in older individuals. Muscle involvement showed a selective pattern, affecting the posterior compartment of the lower leg and anterior thigh muscles, and the muscle fat infiltration in these regions was found to increase with patient age.
Some patients with hyperKPP, especially older individuals, develop chronic progressive myopathy with fixed weakness.3 In a recent survey of 94 genetically diagnosed hyperKPP patients, approximately 30% reported progressive myopathy with muscle dysfunction.4 Among several mutations in the SCN4A gene, the T704M mutation is most commonly associated with fixed weakness and chronic progressive myopathy in patients with hyperKPP.2 Similarly, muscle MRI performed in our study revealed atrophic muscles in three older patients (II:1, II:2, and II:3), although six of the seven patients had reported weakness between attacks. Fatty infiltration was also more frequent and severe in older patients.
Whole-body muscle MRI is a useful technique for investigating the patterns of the muscles involved in patients with myopathy.11 Identifying this pattern can aid the differential diagnosis and guide focused molecular analyses in many muscle disorders. For example, the preferential involvement of calf muscles is a distinct feature of Miyoshi myopathy, which is caused by mutations of the dysferlin gene.1213 Although a previous MRI study demonstrated selective involvement of calf muscles in hyperKPP patients with fixed weakness,6 because that study only examined the lower legs, it could not reveal the muscle involvement patterns in other parts of the body. To the best of our knowledge, whole-body muscle MRI findings have not been described previously in patients with hyperKPP. Our study is therefore the first to demonstrate the highly selective involvement of muscles in the anterior thigh as well as the posterior compartment of the lower leg in hyperKPP patients. In addition, our use of the two-point Dixon method revealed that the fat fractions of muscles in the posterior compartment of the lower leg and the anterior thigh increased with patient age. Because this increase in fat fraction with age was not present in the other regions, the significant correlation between patient age and fat infiltration in the posterior compartment of the lower leg and anterior thigh muscles strengthens our hypothesis of selective muscle involvement. This finding also supports the hypothesis that a portion of patients with hyperKPP develops a chronic progressive myopathy as they age.
The muscle fat fraction was not correlated with manual muscle strength in this study. Chronic progressive myopathy associated with hyperKPP may cause mild muscle weakness. The manual muscle strength score in most patient muscles was 8, 9, or 10. The presence of such mild muscle weakness between attacks in patients with hyperKPP means that manual muscle strength testing cannot be used to evaluate the disease severity and progression. In addition, it is difficult to clinically distinguish fixed weakness from sustained episodic paralysis in patients with hyperKPP, and the results of manual muscle testing are influenced by both patient effort and examiner variability. A previous muscle MRI study that quantified muscle fat in patients with Duchenne muscular dystrophy found that the muscle fat fraction was strongly correlated with disease progression but not with the results of muscle strength tests, obtained either manually or with a dynamometer.14 Thus, muscle fat quantification may provide a better assessment of disease progression and treatment response than clinical functional grading. However, further studies are needed to assess the viability of muscle fat quantification as an objective biomarker for disease progression and therapeutic response in hyperKPP.
This study was subject to several limitations and other issues that should be considered when interpreting these results. First, the number of patients was small and all of them were from a single family. Further, the patient age was not distributed evenly, instead being dominated by those in early adulthood and in their late forties. These factors make it somewhat difficult to generalize the results to the wider population. Follow-up studies with larger samples and more-even age distributions will be necessary to further validate our findings and confirm the pattern of selective muscle involvement that we observed in hyperKPP patients with a long disease duration. Second, this study did not include a control group. The main reasons for this were the high cost and long scan time of whole-body muscle MRI. However, despite the absence of a control group, the selective muscle involvement that we observed does not occur in healthy individuals, and so must be associated with the pathophysiology of hyperKPP. Future studies that compare whole-body muscle MRI findings of patients with different mutations associated with hyperKPP may be necessary to investigate the genotype-phenotype correlation, especially with respect to chronic progressive myopathy. Lastly, in this study we used the two-point Dixon technique for fat quantification. Several variations of the original two-point Dixon technique have been developed (e.g., three-point, four-point, and multipoint methods) to reduce the sensitivity to magnetic heterogeneities and phase errors associated with the two-point Dixon technique.15 However, these variant methods increase the scan time since they require the acquisition of additional images. Thus, scan-time limitations mean that these variant methods are not appropriate for whole-body muscle MRI. Notably, a recent muscle fat MRI study using fat-water separation showed that the muscle fat fraction measured by the two-point Dixon technique is consistent with muscle histological measurements.16 Additionally, human muscle fat quantification results obtained using the two-point Dixon technique were found to be more consistent with those from magnetic resonance spectroscopy than from the three-point or four-point Dixon technique.17
In conclusion, our whole-body muscle MRI findings provide evidence for fixed weakness and chronic progressive myopathy in patients with hyperKPP possessing the SCN4A mutation T704M. We found that selective muscle involvement of the posterior compartment of the lower leg and the anterior thigh is characteristic of the chronic progressive myopathy, particularly in elderly patients, and these results may be useful for the differential diagnosis and targeted molecular analysis in hyperKPP.
 XML Download