

 PDF
PDF ePub
ePub Citation
 Print
Print


INTRODUCTION
Despite the controversial definition of the course of benign multiple sclerosis (BMS), it is generally accepted as a subtype of multiple sclerosis (MS) that has a stable course and slow progression, and confers a low degree of functional disability over many years after the disease onset.1234 BMS is diagnosed largely on functionality, as defined according to the Expanded Disability Status Scale (EDSS),5 over a certain disease duration.4 Diagnosis of BMS is receiving increased attention and becoming more important due to recent recommendations of early therapy for MS and cost-effectiveness issues, including the uncertain long-term benefits of the currently available therapies. Watchful waiting is recommended for BMS rather than the early treatment approach.67 While correct identification of BMS is crucial for such treatment decision making, the diagnosis of BMS remains mainly retrospective.
Data on optical coherence tomography (OCT)-based measures of MS have been accumulating since its first application to the study of MS patients with a history of optic neuritis (ON) in 1999.8 The thickness of the retinal nerve fiber layer (RNFL) has been studied using OCT in MS patients both with9 and without ON,101112 and with different disease courses, from an isolated syndrome1314 to active and progressive MS.1516 OCT as a potential tool for monitoring axonal loss and the active MS course is currently being investigated in, therefore being applied to clinical trials.1718 Axonal loss around the optic disc, as reflected by a reduced RNFL thickness, and neuronal loss around the macula, as reflected by a reduced ganglion cell layer (GCL) thickness, have been consistently observed in MS, regardless of ON history, the degree of patient disability (measured using the EDSS), or early or late examination during the course of the disease.1213 However, very few studies have applied OCT to BMS.1920
BMS, which is traditionally defined as mild disability (EDSS score of ≤3) over a longer disease duration (i.e., >10 years), accounts for less than 15% of all MS types.1234 No solidly predictive factors for the BMS course have yet been identified.23 Two OCT studies have demonstrated that the RNFL is thinner in BMS than in healthy control subjects (HCs), regardless of the ON history.1920 In a longitudinal study, patients with BMS were more frequently affected by ON and had more pronounced RNFL thinning compared to patients with typical MS.19 However, data on OCT measures in BMS without ON are lacking, and as yet there are also no data on the macular GCL and other macular measures in BMS.
The aim of this study was to measure the peripapillary RNFL thickness together with macular measures including the GCL-inner plexiform layer (GCL-IPL) thickness as well as central macular thickness (CMT), total macular volume (TMV), and average macular thickness (AMT) in BMS compared to relapsing-remitting MS (RRMS) and HCs. The rates of thinning of these OCT measures in these two MS subgroups were also estimated relative to ON history, patient age, and MS duration.
METHODS
Subjects
Thirty-six patients with clinically definite MS and 34 age- and sex-matched HCs were included. The study protocol was approved by the Local Ethics Committee. Individuals with a history of conditions that may be related to ocular pathology (glaucoma, retinal disease, retinal surgery, diabetes mellitus, and acute ON) during the previous 6 months, other concomitant neurologic diseases, and systemic steroid treatment during the previous month were excluded. The diagnosis of clinically definite MS was based on the 2005 revision of the McDonald Criteria.21
All patients were selected from a cohort of MS patients who are regularly followed at the Division of Neurology, Linköping University Hospital. All MS patients had been examined at least once with magnetic resonance imaging (MRI) of the brain and most of the spinal cord, and by routine cerebrospinal fluid (CSF) examinations including cell count, CSF/serum albumin ratio, IgG index (i.e., CSF/serum IgG: CSF/serum albumin ratio), and presence of oligoclonal IgG bands in the CSF not observed in the serum examined (side by side) by agarose isoelectric focusing followed by antibody staining and peroxidase amplification. All 36 patients had MRI abnormalities compatible with MS, and 2 or more oligoclonal IgG bands only in the CSF.22 The EDSS5 was administered to each patient no more than 2 weeks before OCT. The disease duration was calculated as the time from the clinical onset of MS.
Of the 36 patients, 25 had RRMS and 11 had BMS (defined by an EDSS score of ≤2 after 10 years24 or ≤3 after 20 years of MS onset).4 A history of acute unilateral ON was based on clinical records, including the results of ophthalmology consultations and visual evoked potentials. All 25 patients with RRMS and 1 of the 11 patients with BMS received disease-modifying therapy.
Optical coherence tomography
Retinal imaging was performed with a spectral domain (SpD) high-definition OCT system (Cirrus HD-OCT model 4,000, Carl Zeiss Meditec, Dublin, CA, USA), as described in detail elsewhere.23 OCT measures were made in the peripapillary and macular areas, and were obtained using the Optic Disc Cube 200×200 protocol centered on the optic disc and the Macular Cube 512×128 protocol centered on the fovea, respectively. Scans with a signal strength of less than 7/10 were excluded from the data analyses.
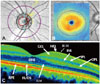
The average thickness of the peripapillary RNFL was measured along 3.4-mm-diameter circles around the optic disc (Fig. 1A). The AMT and CMT were measured between the inner limiting membrane (ILM) and the retinal pigment epithelium (RPE) around the macula in concentric 6-mm and 1-mm-diameter circles, respectively (Fig. 1B and C). The TMV was measured within the 6×6 mm ILM-RPE tissue around the fovea centralis. GCL thickness was measured as the sum of the thicknesses of the GCL and IPL using the Macula Cube 512×128 protocol around the fovea (6×6 mm; the GCL cannot be reliably separated from the thin IPL even with SpD HD-OCT.
Statistical analysis
All data analyses were performed using Statica version 10 (Statsoftz, Tulsa, OK, USA). Group comparisons of demographic factors were analyzed using the Mann-Whitney U test (for age, disease duration, and EDSS score) and Pearson's chisquare test (for gender and number of MS patients with a history of ON). The threshold for statistical significance was defined as p<0.05.
Comparison of OCT measures between HCs (n=34, 68 eyes) and all MS patients (n=36, 72 eyes) was performed using a t-test. MS patients were divided into RRMS (n=25, 50 eyes) and BMS (n=11, 22 eyes). OCT measures from HCs, RRMS, and BMS patients were evaluated using ANOVA followed by the Bonferroni test with adjustment for age. OCT measures from RRMS and BMS patients without or with ON were further analyzed after adjusting for age and disease duration. Multivariable linear regression models were used to assess relationships between OCT measures, and age and disease duration in the MS subgroups.
RESULTS
Characteristics of the study population
The characteristics of the HCs (n=34) and patients with MS are summarized in Table 1. The distributions of age and sex did not differ significantly between the HCs and all MS patients. Among the 36 MS patients, 25 had RRMS and the remaining 11 had BMS. At the time of examination, the 36 MS patients had at most relatively mild disabilities (EDSS score of ≤3). The patients with BMS were significantly older than those with RRMS and HCs (p<0.01), and had a longer MS duration (mean 21 vs. 6 years, p<0.01). In total, 12 (33%) of the 36 MS patients (7 patients with RRMS and 5 with BMS) reported having had ON (i.e., ON RRMS and ON BMS, respectively). Two of these 12 patients with RRMS and 1 with BMS had experienced signs and symptoms of ON occurring first in 1 eye and then in the second eye after an interval of 3-5 years. Although a greater proportion of patients with BMS (45%) had ON compared to RRMS (28%), the difference did not reach statistical significance.
RNFL and GCL-IPL are significantly thinner in RRMS and BMS than in HCs
Lower values of peripapillary RNFL thickness, GCL-IPL thickness, macular TMV, and AMT were found in the group of 36 MS patients in comparison with the 34 HCs (p<0.01 for all measures). There was no difference in macular CMT between HCs and all MS patients (Table 2A).
Multiple comparison adjusting for age and disease duration was used to further analyze differences in OCT measures between HCs (n=34, 68 eyes) and RRMS (n=25, 50 eyes) and BMS (n=11, 22 eyes) patients. All OCT measures except for CMT in RRMS remained significantly lower (p<0.001 for all) compared to HCs. The RNFL thickness and GCL-IPL thickness, but not CMT, TMV, or AMT were significantly lower in the BMS patients compared to the HCs (p<0.01 for both). None of the OCT measures differed between RRMS and BMS eyes (Table 2A).
Relatively preserved macular TMV, AMT, and GCL-IPL thickness in non-ON BMS
When subgrouping MS based on history of ON, lower values of all OCT measures except for CMT were observed in ON MS (15 eyes) (Table 2B) compared to HCs (68 eyes) and non-ON MS (57 eyes) (Table 2C). However, only the RNFL thickness and GCL-IPL thickness were lower in non-ON MS compared to HCs (Table 2C). Regardless of the MS course, all OCT measures except CMT were significantly reduced in the eyes with a history of ON, and there were no differences between the ON-affected RRMS and BMS subtypes after adjusting for age and MS duration (Table 2B).
Multiple comparison adjusting for age revealed significantly reduced TMV, AMT, and GCL-IPL thickness in the non-ON RRMS group, but not in the non-ON BMS group compared to HCs (Table 2C). After adjusting for age and disease duration, macular measures for TMV, AMT, and GCL-IPL thickness, but not peripapillary RNFL thickness, differed between non-ON RRMS and non-ON BMS (Table 2C). In the non-ON RRMS subgroup, TMV, AMT, and GCL-IPL thickness were significantly reduced compared to the non-ON BMS subgroup (p<0.05 for all comparisons). These results indicate that ON, age, and MS duration all affected OCT measures.
The thinning rates of the RNFL and GCL-IPL are associated with MS duration in non-ON RRMS
All OCT measures were included as dependent variables in the subgroup analyses. Age, disease duration, and EDSS score were included as independent variables. In non-ON RRMS, the thinning rates of the RNFL and GCL-IPL were associated with disease duration (p<0.05), but not with either age or EDSS score (Table 3). The thinning rates of the RNFL and GCL-IPL in non-ON RRMS were -0.54±0.24 (mean±SE) and -0.43±0.21 µm/year, respectively, and were substantially greater in non-ON RRMS than in non-ON BMS (-0.11±0.27 and -0.24±0.24 µm/year, respectively).
OCT measures were not associated with age, disease duration, or EDSS score in either MS subgroup with a history of ON.
DISCUSSION
A reduced RNFL thickness in RRMS and BMS compared to HCs is demonstrated herein. In agreement with other recently reported results, BMS and RRMS exhibited a similar degree of RNFL thinning.1920 However, similar to the results of Lange et al.,20 patients with non-ON BMS displayed a lesser degree of RNFL thinning compared to non-ON RRMS. Furthermore, although the RNFL tended to be thinner in non-ON BMS and non-ON RRMS compared to HCs, the difference did not reach statistical significance. These negative findings may be attributable to the small number of studied patients. In contrast, both ON-affected BMS and RRMS patients exhibited a significantly reduced RNFL compared to HCs, there being no significant difference in the degree of RNFL thinning between these two MS subgroups. Accordingly, the yearly thinning rate of RNFL appears to be lower in BMS than in RRMS without ON, while it did not differ between the two groups with a history of ON.
The present results indicate that the non-ON-affected eyes in BMS exhibited a lesser disease progression compared to both non-ON- and ON-affected eyes in RRMS. This observation could imply less axonal loss, stable disease activity, and a clinically lower degree of functional deficit in BMS in general. Longitudinal follow-up of RNFL thickness with OCT in non-ON eyes in MS may help in the monitoring of subclinical RNFL axonal loss, surveying the MS course, and estimating the disease prognosis.121314 Detection of a lower yearly RNFL thinning rate with OCT in MS could be a biomarker of a future diagnosis of BMS,1920 and may help in the decision-making regarding therapies.18 On the other hand, a RNFL thinner in ON-affected MS eyes could serve as evidence of demyelination, but cannot help in distinguishing between the degree of axonal loss or the extent of disease progression, thus being of little or no use in the prediction of the MS course.
This study investigated several macular measures that have not previously been reported in BMS studies, including CMT, TMV, AMT, and GCL-IPL thickness. SpD OCT enables the measurement of macular integrity around the fovea. Ganglion cells are concentrated in the macula, while about 90% of the optic disc is composed of axons (i.e., retinal nerve fibers).24 Recent studies have shown that measurement of TMV is as sensitive as RNFL thickness in MS patients without or with a history of ON,13 and that the reduction in TMV is more pronounced in both primary and secondary progressive MS than in RRMS.13 Thinning of the GCL-IPL has been observed in both early and active MS,1525 and is associated with intracranial volume in both RRMS and HCs,2627 and with impairment of color vision.28 It is thought that GCL thickness may be useful as an imaging marker of trans-synaptic degeneration in the visual pathway after brain lesions.29
It is no surprise that reduced macular measures, and especially of the GCL-IPL thickness in RRMS, were observed in the present study. Macular measures of MTV, AMT, and GCL-IPL thickness, but not CMT, were significantly reduced in RRMS compared to HCs and BMS. Only the GCL-IPL thickness, and none of the other macular measures, was significantly reduced in BMS compared to HCs. As for the RNFL thickness in eyes affected by ON, all macular measures except CMT were significantly lower in BMS when compared to HCs. There were no differences between RRMS and BMS for any of the macular measures, including GCL-IPL thickness, in ON-affected eyes. CMT is mainly accounted for by the outer nuclear layer and photoreceptors, with very little GCL and almost no axons. This probably explains why CMT is not a sensitive measure in MS.
Values of TMV and AMT were slightly higher and the GCL was slightly thinner in non-ON BMS than in HCs. TMV and AMT are accounted for by large amounts of non-neuronal components in addition to the neuronal component of the GCL. The amount of retinal non-neuronal tissue increases with age,30 which may explain higher values of TMV and AMT in non-ON BMS compared to HCs. By contrast, all macular measures were similar in ON RRMS and ON BMS. In addition, the yearly GCL-IPL thinning rate was lower in BMS than in non-ON RRMS, thus further supporting the lower disease activity in BMS.
Macular measures, and in particular of the GCL-IPL thickness, are important as complements to measurement of RNFL thickness. In the case of a neuroinflammatory process affecting the optic nerves or in intracranial hypertension with optic nerve swelling, the macula and fovea areas can be spared or less affected.1527 Thus, the GCL-IPL thickness is more reliable and more reproducible than the RNFL thickness.28 It has been suggested that GCL-IPL thinning is associated with an active MS course, is a more sensitive parameter for evaluating MS disease activity, and is related to brain volumes.28 A greater rate of GCL-IPL thinning has been observed in both active and early MS.131527 In addition, GCL-IPL thinning is strongly related to visual function and vision-related quality of life in MS both with and without a history of acute ON.29 These observations suggest the relevance of the GCL-IPL thickness as an OCT-based measure that can compensate for the results of pseudonormalized RNFL thickness, or vice versa. Moreover, our study and studies of others show strong correlations between the RNFL thickness and the GCL-IPL thickness.152326 It therefore appears necessary to include both axonal measures of RNFL thickness and neural measures of the GCL-IPL thickness in future OCT examinations, particularly in clinical trials.
This cross-sectional study was subject to certain limitations. First, only small numbers of patients with BMS without or with ON could be included in the study. A more accurate characterization of OCT measures, and in particular of the RNFL and GCL-IPL thicknesses, is necessary in larger numbers of patients with BMS. Second, the results need to be confirmed in a longitudinal study. All patients enrolled in the present study are thus being followed up every 6-12 months, irrespective of their disease course. Third, other clinical parameters such as cognitive impairment and fatigue were not analyzed quantitatively in our patients.
In summary, RNFL thickness in non-ON BMS eyes is relatively preserved and may reflect a lower subclinical disease activity. The observed lower yearly thinning rate of RNFL thickness in this subgroup may have the same implication. Macular measures including the GCL-IPL thickness are also well preserved, with a lower thinning rate in non-ON BMS compared to non-ON RRMS. Thus, a combination of the RNFL thickness and the GCL-IPL thickness may serve as a biomarker of BMS and help with clinical decision-making in MS.


 XML Download