

 PDF
PDF ePub
ePub Citation
 Print
Print


INTRODUCTION
Despite the superior diagnostic power1 of skin biopsy, there is frequent hesitation in diagnosing pigmented skin lesions (PSLs) in Asian populations2. This is because most PSLs in Asians are benign lesions, and because of cultural preferences, Asian patients are usually hesitant to undergo invasive procedures. Therefore, Asian dermatologists mostly rely on visual examination in differentiating benign-looking PSLs. The brightness, color, distribution of the lesion, thickness, and textural properties of the surface of the lesion constitute the basis of diagnostic criteria. Dermatologists are trained to be familiar with the above features through repeated careful observations of various PSLs, both with the naked eye and by using magnifiers3,4. Despite several researches being carried out for establishing an accurate and reproducible diagnostic methodology for PSLs, most of them require a lot of personal experiences; thus, they are lacking objectivity. For instance, dermoscopy, which is an effective diagnostic aid in morphologically distinguishing malignant skin lesions from benign PSLs, is a time-consuming and effort-demanding technique to learn.
As there are few reports exploring the characteristics of PSLs in an objective manner5,6, we developed a computer-aided image analysis (CAIA) software to extract the morphological features into numerical parameters. We statistically analyzed those objective parameters to reveal the similarities and differences among benign PSLs, and categorized them into several groups according to similar properties. The categorization was correlated with the already known histology of each entity. Through the analytical study, we intended to enhance the credibility of non-invasive examination for diagnosing benign PSLs.
MATERIALS AND METHODS
Image acquisition
For patients who have PSLs on the face, we took magnified digital images in the clinic. An inexpensive commercial digital magnifying camera with polarized light source (AM-413TL; Dino-Lite, New Taipei City, Taiwan) was used to obtain JPEG (joint photography experts group) images in an 8-bit RGB (red-green-blue) format with 1,280×1,024 pixels. The magnification power was set to be 20 for every image. It was ensured that every PSL was at the center of the image, and the entire lesion was observed in the full-screen view. Three distinct PSLs were considered-senile lentigo, common melanocytic nevus, and common seborrheic keratosis. The gold standard in classification was the clinical diagnosis made from the consensus of 2 highly experienced dermatologists. Only well-focused images-23 images for lentigo, 22 images for common melanocytic nevi, and 45 images for seborrheic keratosis-were adopted for further analysis.
Image classification
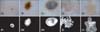
After reviewing the original set of images, we noticed that nevus and seborrheic keratosis could be divided into subgroups according to differences in their gross morphology. The group of seborrheic keratosis was classified into 3 distinct subcategories. Lesions with definite black pigmentation were classified as pigmented seborrheic keratosis (p-SK). Lesions that had a thick scale and elevated base were classified into hyperkeratotic seborrheic keratosis (h-SK). Finally, lesions that were flat and bright brown were classified into flat brownish seborrheic keratosis (f-SK). It is also possible to define f-SK as sebolentigine, which is a conventional term. Among 45 seborrheic keratosis lesions, 7 were p-SK, 9 were h-SK, and 29 were f-SK. Unlike seborrheic keratosis, the images of nevus and lentigo revealed relatively uniform gross morphology-small, round, bright brownish color (Fig. 1A~E).
Computer-aided image analysis
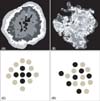
Before the main analysis, 90 PSL images were preprocessed, including surface fitting7, hair and artifact removal, and automated separation of the lesion from the background by using conventional algorithms8. Thereafter, 13 features (3 morphological, 3 color histogram, 6 textural, and 1 topological) were extracted from each PSL. Morphological analysis included calculation of the area, perimeter, and roundness (a rounder shape yields a higher value). Color histogram analysis consisted of measurement of mean brightness (0 means darkest, 255 means brightest)9. Textural analysis included evaluation of contrast (how distinctly a pixel is different from nearby pixels) and correlation (how well the pixel brightness matched the expected value deduced from the linear regression of nearby pixels)10. These were derived from the analysis of the second-order histogram, also called the co-occurrence matrix. A novel notion of concentricity was used as a topological parameter from the color segmentation process. The K-means algorithm enables the CAIA software to divide the pixels of a PSL image into 4 groups, according to their Euclidean distance from each other11. In other words, similarly colored pixels are placed into 1 of the 5 groups. By marking each pixel with a tag of 1 out of the 5 groups, the PSL becomes a 5-color segmented image. Some of the color-segmented images looked very similar to concentric rings, whereas the others did not show any definite pattern. Therefore, to measure the degree of concentricity numerically, we created a novel concept in which concentricity is defined as a number between 0 and 1, and is calculated considering the extent to which the bigger segment encircles the smaller segment. If an image exhibits a concentric pattern, the bigger segment will serve as a hull and smaller 1 as a core, thus giving a rise to a higher concentricity value (Fig. 2). A high concentricity means that the image resembles a concentric ring.
Statistical analysis
According to the 5 subcategories (lentigo, nevus, p-SK, h-SK, and f-SK), the 13 feature parameters were analyzed by using analysis of variance (ANOVA) with the post-hoc test to verify the differences between the subcategories. The statistical significance level was set at 0.05 and the confidential interval at 95%. Data were analyzed with PASW Statistics software version 18.0 (IBM Co., Armonk, NY, USA).
RESULTS
Morphological analysis
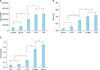
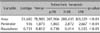
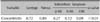
ANOVA revealed significant differences among all the 3 morphological features (Table 1). The order of subcategories in each feature parameter, from high to low, was determined by using the post-hoc test. In terms of area and perimeter, f-SK and h-SK were the largest, p-SK was intermediate, and nevus and lentigo were the smallest (Fig. 3A). The order in terms of roundness, from high to low, was nevus, p-SK, lentigo, f-SK, and h-SK. There was no statistically significant difference between typical nevus and p-SK.
Color histogram analysis
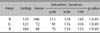
The 5 subcategories were significantly different from each other considering the mean brightness in the R, G, and B color fields (Table 2). f-SK and lentigo had the highest mean brightness, followed by h-SK. The mean brightness was low in p-SK and typical nevus. This means that f-SK and lentigo had the brightest surface, whereas p-SK and nevus had the darkest surface (Fig. 3B).
Textural analysis
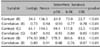
Significant differences were observed in both textural parameters-contrast and correlation in the R, G, and B color fields (Table 3). The contrast was the highest in nevus, followed by the groups of h-SK and p-SK. The lowest contrast was shown by lentigo and f-SK. According to the correlation, the 5 subcategories could be divided into 2 distinct groups: the higher correlation group comprising nevus and p-SK, and the lower correlation group comprising SK, h-SK, and lentigo.
Topological analysis
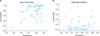
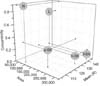
Concentricity showed significantly different values among the 5 subcategories (Table 4). The 5 subcategories were divided on the basis of the statistical significance into 3 distinct groups. Typical nevus had the highest concentricity, followed by lentigo. p-SK, h-SK, and f-SK showed the lowest values (Fig. 3C). The correlation analysis between the parameters of roundness and concentricity revealed a significant correlation only in nevus and lentigo, but not in the seborrheic keratosis group (Fig. 4). The segmented images of the 5 subcategories agreed with the above result. Nevus was well segmented into concentric rings, whereas seborrheic keratosis was in a noise-like random pattern (Fig. 1F~J).
DISCUSSION
The attempt to build an objective method for differentiating the various PSLs prompted us to develop a CAIA software. Along with the conventional feature extraction algorithms, including morphological, color, and textural analysis12,13, the software also utilized a novel concept of concentricity. The concentricity of a PSL is determined according to the pattern of color-segmented images. If the pattern is similar to concentric circles, the concentricity would be close to 1, while the random noisy image would be close to 0. A previous unpublished pilot study with fewer images (5 samples each of nevus, lentigo, and seborrheic keratosis) revealed that each PSL had its own characteristic feature. Especially, the concentricity was significantly lower in seborrheic keratosis than in nevus and lentigo. On the basis of the pilot analysis, we were encouraged to expand our research to correlate the CAIA parameters not only with the subjective differential diagnosis but also with the already known histopathology of the corresponding PSL.
In terms of histopathology, benign PSLs are classified into 1 group whose pigmentation is mainly attributed to the proliferation of melanocytes or nevocytes14, and another group that has proliferated keratinocytes with melanin granules within15. The first group includes nevus and lentigo, whereas the second group includes seborrheic keratosis. In this study, we tried to correlate the CAIA results with the pathogenesis.
The nevus is a hamartoma consisting of nevocytes. Nevocytes are believed to originate from melanocytes, and they are morphologically similar. However, unlike melanocytes, nevocytes abnormally proliferate and form nests16. As the nest starts from a center and grows radially, the cells inside would have different characteristics from those outside. More important, as the nest is a 3-dimensional sphere, the central part of the nest would contain more nevocytes and melanin pigment than the peripheral part when projected into a 2-dimensional plane. This explains why the color-segmented image of nevus has a concentric circle pattern.
Lentigo is a macular hyperpigmentation that shows only increased number or activity of epidermal melanocytes but without any nest formation17. Histopathological examination revealed rete ridge elongation with focal proliferation of melanocytes in some of the lentigo and slightly increased basal pigmentation in the others. CAIA revealed that nevus is much darker than lentigo. This finding implies that melanin production would be significantly higher in nevus than in lentigo. As there is no cell nest in lentigo, the concentricity is not as high as that of nevus.
Seborrheic keratosis is a common epidermal growth that originates from keratinocytes. Although its major pathogenesis does not entail the proliferation and hyperactivity of melanocytes, previous histopathological studies revealed that the amount of melanin in seborrheic keratosis is greater than normal18. CAIA confirmed numerically that seborrheic keratosis is darker than normal skin, and even darker than lentigo, which is a melanocytic lesion. The fact that the keratinocytes outnumber melanocytes by >10 times might explain why the CAIA parameter area is larger in seborrheic keratosis than in other melanocytic lesions.
In both clinical and histological viewpoints, many forms of lesions constitute a wide spectrum of seborrheic keratosis. We divided seborrheic keratosis into 3 categories according to gross morphology. In the first group, p-SK is characterized by prominent melanin pigmentation. One variant of p-SK is melanoacanthoma, which shows a marked increase in the number of melanocytes19. In the second and third group, f-SK and h-SK are formed from the dominant proliferation of keratinocytes. f-SK, which is also clinically known as 'sebolentigine', contains less melanin than p-SK; therefore, it has a brighter tone. h-SK is a distinct entity with a characteristic thick scale. CAIA revealed that all of the 3 subgroups shared the common properties of larger area and lower concentricity. Interestingly, the concentricity of p-SK was significantly higher than that of f-SK and of h-SK. This finding suggests that p-SK has a cellular composition profile closer to melanocytic lesions than f-SK and h-SK. However, as the melanocytic proliferation in p-SK is much weaker than in melanocytic lesions, and does not form a definite nest, the concentricity of p-SK is lower than that of nevus and of lentigo. In terms of mean brightness, there was clear order among the 3 subgroups; p-SK was the darkest, and was as dark as nevus; h-SK was the second darkest; and f-SK was the least dark. The increased proportion of melanin accounts for the dark tone of p-SK. However, h-SK is darker than f-SK because h-SK has a thicker scale covering the surface, not because it has more melanin pigment.
Conceptually, concentricity would be related to another CAIA parameter-roundness. Interestingly, a meaningful relation between concentricity and roundness was found only in the melanocytic lesions. The analysis revealed that the rounder the shape and the more regular the border of nevus or lentigo, the higher is its concentricity. However, this correlation was not valid in seborrheic keratosis. This finding also supports the above hypothesis that the difference in pathogenesis causes morphological and topological differences.
In conclusion, we confirmed that there are agreements between the dermatologists' subjective judgments about the characteristics of PSLs and the parameters derived from our CAIA software. By matching the CAIA results with the histopathology of each corresponding PSL, we noticed that the proportion of melanocytes to keratinocytes in the proliferation process greatly influenced the morphological differences among the PSLs (Fig. 5). Our collaborative work, involving both clinical dermatology and computer science, would be helpful in investigative studies to reveal the pathogenesis of various PSLs, and as a diagnostic aid in everyday clinical practice.
 XML Download