

 PDF
PDF ePub
ePub Citation
 Print
Print


INTRODUCTION
Melanocytes are specialized cells that produce melanin pigments, thereby contributing to the appearance of skin color1. Melanins are a complex group of heterogeneous biopolymers, which can be classified into black/brown and red/yellow pheomelanins. Because each individual melanocyte can produce eumelanins and/or pheomelanins, it is the ratio of those pigments that determines skin color2. It is well established that melanins are synthesized from tyrosine through several biochemical steps, in which many pigmentation-related enzymes are coordinately involved. Tyrosinase is a rate-limiting enzyme that catalyzes the initial step, in the conversion of tyrosine to DOPA and DOPA quinone3,4. Although the importance of other enzymes and factors in pigmentation has been recognized, tyrosinase is still regarded as the most important determinant in the pigmentation process.
Adenosine is a nucleoside, in which adenine is attached to a ribose sugar molecule (ribofuranose), via a β-Ng-glycosidic bond. It is a precursor of adenosine triphosphate and adenosine diphosphate, which are the most important molecules for energy transfer in organisms. Adenosine also serves as a building block for cyclic adenosine monophosphate (cAMP), an important second messenger in signal transduction. In pigmentation, cAMP is known to act as an intermediate second messenger, relaying an external α-melanocyte-stimulating hormone (α-MSH) signal, to trigger induction of microphthalmia-associated transcription factor (MITF) in the nuclei of melanocytes5,6. Since its structural backbone is very similar, we initially hypothesized that adenosine may also have a positive effect on pigmentation. So far, four subtypes of adenosine receptors have been identified and named: A1, A2a, A2b and A37,8. Growing evidence indicates that adenosine exerts a variety of biological effects, via G proteincoupled receptors. Examples include modulation of innate immunity, vascular pathologies, and hematopoiesis9,10,11. Although the important roles of adenosine in various biological systems are increasingly being investigated, its effect on melanogenesis has not yet been elucidated. In this study, we investigated the effect of adenosine on melanogenesis, using the well-established B16 melanoma cell and zebrafish models. We report here that adenosine inhibits melanogenesis, through negative regulation of tyrosinase.
MATERIALS AND METHODS
Materials
Dulbecco's modified Eagle's medium (DMEM) was purchased from WelGENE Inc. (Daegu, Korea). The adenosine, L-DOPA, 1-phenyl-2-thiourea, and 3-[4,5-dimethylthiazol-2-yl]-2,5-diphenyltetrazolium bromide (MTT) were purchased from Sigma-Aldrich (St. Louis, MO, USA). Antibiotic-antimycotic, fetal bovine serum (FBS) and trypsin-ethylenediaminetetraacetic acid solution were obtained from Gibco-Invitrogen (Carlsbad, CA, USA).
Cell culture
B16 murine melanoma cells were routinely maintained in DMEM, containing 10% heat-inactivated FBS, penicillin (100 units/ml), and streptomycin (100 µg/ml), at 37℃ in 5% CO2 incubator.
Cell viability test
The MTT assay was performed, to determine the viability of B16 cells. Cells were cultured in 12-well plate, and treated with adenosine at the indicated concentrations for 24 hours. The MTT solution was added at the concentration of 250 µg/ml, and further incubated for 2 hours. The plates were spun, supernatants were discarded, and purple-colored precipitates of formazan were dissolved in 150 µl of dimethyl sulfoxide. The color absorbance of each aliquot was recorded at 540 nm, with a Bio-Rad 3,350 microplate reader (Bio-Rad Laboratories Inc., Hercules, CA, USA).
Melanin contents and tyrosinase activity
For determination of melanin content, cell extracts were prepared with Pro-Prep protein extraction solution (Intron, Seongnam, Korea). After centrifugation, pellet was dissolved in 1 ml of 1 N NaOH, at 100℃ for 30 minutes. The sample was then vigorously vortexed, to solubilize the melanin pigment. The optical density of the supernatant was measured at 400 nm, and the results are expressed as a percentage of the control. For determination of tyrosinase activity, cells were sonicated in protein extraction solution, and then the lysate was clarified by centrifugation. After quantification, 250 µg of total protein in 100 µl of lysis buffer was transferred into the 96-well plate, and 100 µl of 1 mM L-DOPA was added. After incubation for 60 minutes at 37℃, the absorbance was measured at 475 nm. The tyrosinase activity was expressed as a percentage of the control. All experiments were done at least three times, with similar results.
Western blot
Cell extracts were prepared with Pro-Prep protein (Intron). After voltexing, extracts were centrifuged for 10 minutes at 15,000 rpm. Total proteins were measured by the bicinchoninic acid method (BCA assay; Pierce, Rockford, IL, USA). Samples were run on SDS-poly acrylamide gels, transferred onto nitrocellulose membranes, and incubated with appropriate antibodies, for overnight at 4℃, with gentle agitation. Blots were then incubated with peroxiase-conjugated secondary antibodies for 2 hours at room temperature, and visualized by enhaced chemiluminescence (Intron). The anti-ACTIN antibody was purchased from Santa Cruz Biotechnology (Santa Cruz, CA, USA).
Effect on pigmentation of zebrafish embryo
Adult zebrafish were obtained from a commercial dealer, and 10 to 15 fish were kept in 5 L acrylic tank with the following conditions: 28.5℃, with a 14/10 hours light/dark cycle. Zebrafish were fed three times a day, 6 days a week, with Tetramin flake food, supplemented with live brine shrimps (Artemia salina). Embryos were obtained from natural spawning, which was induced in the morning, by turning on the light. The collection of embryos was completed within 30 minutes. The effect of adenosine on the pigmentation of zebrafish embryo was determined according to a previous report12.
Statistical analysis
Each experiment was performed at least three times, with results expressed in each case as the mean±standard deviation. Significant difference was determined by Student's t-test. The p-values of <0.05 were taken to be significant. All statistical analysis were performed using PASW Statistics 18.0 (IBM Co., Armonk, NY, USA).
RESULTS
Cytotoxicity in B16 cells after adenosine treatment
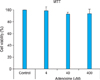
We performed an MTT assay, to evaluate the cytotoxicity of adenosine in B16 cells. Adenosine-treated groups exhibited slightly lower viability than controls, when adenosine was applied at concentrations up to 400 µM. However, these differences were not significant (p>0.05), which suggests that adenosine causes no notable cytotoxicity in B16 cells (Fig. 1).
Regulation of pigmentation by adenosine
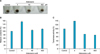
We determined the effect of adenosine on pigmentation, by assessing the melanin content and tyrosinase activity. Cell extracts were prepared after adenosine treatment by centrifugation, and pellet colors were then compared (Fig. 2A). A low concentration of adenosine (4 µM) seemed to increase pigmentation; while pigmentation decreased, as the concentration of adenosine was increased to 400 µM. Quantification of pellet colors using a spectrometer revealed similar results (Fig. 2B). Consistent with these results, tyrosinase activity was increased at low doses of adenosine, while high doses of adenosine decreased enzyme activity (Fig. 2C).
Adenosine inhibited melanogenesis-associated molecules
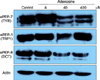
From our previous experiment, we knew that a high concentration of adenosine decreased tyrosinase activity in B16 cells. We assessed the protein levels of tyrosinase, tyrosinase related protein-1 (TRP1), and dopachrome tautomerase (DCT), which are the major proteins in melanogenesis, by Western blotting. A low dose of adenosine (4 µM) increased tyrosinase protein levels slightly; however, TRP1 and DCT levels were not affected. High doses of adenosine resulted in a remarkable decrease in the tyrosinase protein level, and a slight decrease in the DCT level (Fig. 3).
Pigmentation of zebrafish after adenosine treatment
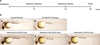
Ten hours after fertilization, we added adenosine to the growth medium, and incubated the embryos for a further 14 hours. Then, the medium was replaced with fresh medium containing adenosine, and incubation was continued until 33 hours post-fertilization (Fig. 4A). Adenosine inhibited zebrafish pigmentation in a dose-dependent manner (Fig. 4B).
DISCUSSION
To investigate the effect of adenosine on melanogenesis, we used B16 murine melanoma cells. In cell viability test, adenosine did not show cytotoxic effects, up to a concentration of 400 µM. As shown in Fig. 2A, a low dose of adenosine (4 µM) appeared to increase pigmentation. However, at high doses, the pellets seemed to be slightly paler. Consistent with these results, tyrosinase activity was increased at a low dose of adenosine, while high doses of adenosine decreased enzyme activity. These results suggest that adenosine has a biphasic effect on B16 cell pigmentation. The protein levels of pigmentation enzymes are shown in Fig. 3; low-dose adenosine (4 µM) increased tyrosinase protein levels slightly, whereas TRP1 and DCT levels were unaffected. High doses of adenosine resulted in a remarkable decrease in the tyrosinase protein level, and a slight decrease in the DCT level.
A recent paper showed enhancing of the pigmentation of B16 melanoma cells, and in human skin explants, via activation of A3 adenosine receptors, by using IB-MECA13. Unlike IB-MECA, which is the agonist of A3 adenosine receptor, the adenosine that we used is not a receptor subtype specific agonist. IB-MECA showed enhanced pigmentation in B16 cells at low dose (up to 40 µM), but we treated adenosine to B16 cells from low to high dose (up to 400 µM), and examined the biphasic effect of adenosine on pigmentation. Our data provide biphasic activity of adenosine on pigmentation, according to the concentration.
Adenosine is a building block of cAMP, a well-known intracellular second messenger involved in various cellular events. In pigmentation, cAMP is known to act as an intermediate second messenger, relaying an external α-MSH signal, to trigger induction of MITF, in the nuclei of melanocytes5,6. At a low dose (4 µM), adenosine increased the tyrosinase level and melanin content, in B16 melanoma cells. By contrast, high-dose adenosine showed the opposite effect, decreasing the tyrosinase level and melanin content. At this time, it is hard to explain these opposing effects on B16 melanoma cells, which effects depended on the working concentration. One possible explanation is that the binding of adenosine to its cognate receptors on membranes may have different characteristics, according to its concentration. For example, at a high concentration, adenosine prefers to bind to A1 and/or A3 receptors, which are coupled to Gi proteins, which inhibit adenylate cyclase activity. At low concentrations, adenosine tends to bind to A2a and/or A2b, which are coupled to Gs proteins, which stimulate adenylate cyclase activity. However, the precise mechanism underlying this phenomenon remains to be determined.
To determine the effect of adenine on pigmentation at the organism level, we adopted the zebrafish, a recently developed pigmentation-testing model12. Unlike the in vitro cell culture data, low-dose adenosine did not significantly affect the body pigmentation of zebrafish; however, at a high concentration, pigmentation was markedly inhibited. These results suggest that adenosine may have an inhibitory effect on pigmentation.
In summary, we have shown that adenosine can decrease pigmentation, by negatively regulating tyrosinase. Considering the limited reports of its efficacy and safety, further studies should investigate the mechanism of action of adenosine, before its clinical application.
 XML Download