

 PDF
PDF ePub
ePub Citation
 Print
Print


INTRODUCTION
The assessment of cutaneous sensitivity to ultraviolet (UV) radiation is an important process of diagnosing photosensitivity disorders and establishing phototherapy protocols. Traditionally, the minimal erythema dose (MED) has been regarded as a key factor to evaluate the degree of photosensitivity and to determine the starting doses for phototherapy1. Narrowband UVB (NBUVB) phototherapy has been widely used in the treatment of various skin diseases, such as psoriasis, vitiligo, and atopic dermatitis, and it has excellent treatment outcomes2. The protocols for NBUVB phototherapy usually consist of the initial starting doses and incremental doses based on the MED values or skin phototypes. Although some authors developed phototherapy protocols based on the correlation between the MED range and skin type in patients receiving NBUVB phototherapy3, the patients may encounter some problems, such as deep erythema responses or burn reactions. Moreover, considering the fact that most Koreans have darker complexions (skin types III and IV) and show seasonal variations in facultative skin colors, MED determination by naked eyes can be a relatively subjective procedure, and an overestimated value can cause adverse reactions during NBUVB phototherapy.
However, MED measurement on skin erythema sites is a subjective process because the emitting doses from light sources are arbitrarily allocated by operators and the MED value is not measured, but merely recorded. Until recently, there have been only a few reports regarding objective methods to measure erythema responses, especially in MED evaluations. Since the Commission Internationale de I'Eclair age (CIE) recommendation for color scale was published in 1976, spectrophotometers have adopted the CIE L*a*b* system, in which the L* value gives the relative lightness ranging from total black (L*=0) to total white (L*=100); the a* value represents the balance between red (positive value) and green (negative value); and the b* value represents the balance between yellow (positive value) and blue (negative value)4. Besides the 3 parameters mentioned above, delta E numerically represents the difference between 2 colors, and it could be obtained by the application of the following formula: Δ E=[(ΔL*)2+(Δa*)2+(Δb*)2]1/2. The ranges indicated the degree of difference as: 3.0 to 6.0, appreciable difference; and 6.0 to 12.0, much difference5.
Although many previous studies reported that spectophotometric values are useful to assess skin types, skin colors, and cutaneous sensitivity to phototherapy, they described only limited spectophotometric values, such as L* value, a* value, and b* value.
Therefore, to determine a new meaning of the relationships among spectrophotometric values, we examined any difference between the MED values and the measured L*a*b* values in phototesting sites of patients receiving NBUVB phototherapy. The correlations between MEDs and various spectrophotometric parameters will be discussed.
MATERIALS AND METHODS
Study population
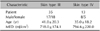
Twenty-five patients with psoriasis and 23 patients with vitiligo were recruited from the Department of Dermatology, Dong-A University Medical Center in the Korea between March 2005 and June 2009. The patients included 25 males and 23 females, 5 to 74 years of age (average, 36.1 years). All patients were surveyed by questionnaire in order to assess their Fitzpatrick skin types. The exclusion criteria included lactating or pregnant women, patients with porphyria or known photoallergic or photosensitivity disorders, excessive sun exposure for the past 3 months, immunosuppressive treatment and systemic disease, personal history of malignant melanoma, patients with tendency to melasma, and any conditions associated with a risk of poor protocol compliance (Table 1). This study was approved by the institutional review board of Dong-A University Medical Center, and was conducted in accordance with the guideline of the 1975 Declaration of Helsinki. Written informed consent was obtained from all patients before screening procedures and entry to the study.
Phototesting
An UV cabinet (Waldmann UV1000KL; Waldmann Co., Villingen-Schwenningen, Germany) attached to a fluorescence lamp emitting a 311 nm continuous wave (Waldmann F85/100W, TL-01; Waldmann Co.) was used. All patients were phototested on the mid-back with NBUVB at 10 sites among 12 doses at a range of 400 to 1,230 mJ/cm2 (400, 450, 490, 540, 600, 660, 720, 800, 880, 1,000, 1,120, and 1,230 mJ/cm2) with reference to a crude correlation formula (MED×0.7=minimal perceptible erythema). The phototested sites, including the MED sites, were evaluated and photographed after 24 hours.
Spectrophotometric measurement
Three color attributes of the skin (L*, a*, and b* values) were measured by a spectrophotometer (CM-2600d; Konica Minolta Holdings Inc., Tokyo, Japan) at an irradiated site and the buttocks skin as a constitutive skin color. The measurement using the spectrophotometer was performed 3 times, and the mean values were used in this study. To measure this instrument, we chose the specular component included (SCI) values in a large liquid crystal display display by operating navigation. SCI is a method in which measurements are taken with the specular reflection included. For this reason, SCI minimizes the influence of the surface condition of a sample, and is especially suitable for color quality control and computer color matching, comparable to specular component excluded (SCE), in which SCE is a measurement taken excluding the specular reflection. This type of measurement provides results similar to those observed visually. With respect to L*, a*, b* parameters in the spectrophotometer, L* indicates lightness; the increase indicates more brightness; and the decrease indicates more darkness. Color directions are indicated as a* (red-green) and b* (yellow-blue). As the a* and b* values increase, the saturation of the color increases2. The patients were enrolled as subjects if delta E ranged >3.0 (ΔE, 3.0 to 12.0).
Statistical analysis
One-way analysis of variance (ANOVA) was used to compare the MED of different skin types (III and IV); the MED from the psoriasis and vitiligo patient groups; L* and a* and b* values at MED sites in different skin types; L* and a* and b* values at MED sites from the psoriasis patients, the vitiligo patients, and the normal control group; a* values and b*/L* values in different skin types (III and IV); b*/L* values depending on 2 different ranges of delta E (3.0~6.0 or >6.0), which is again divided into 2 different skin type groups. Correlations between MED and each of L*, a*, b* values; correlations between L* and a*, L* and b*, b* and a* values at MED sites; and correlation between a* values and b*/L* values in different skin types were analyzed using Pearson's correlation coefficient. The analysis was performed using the SPSS program (version 15.0; SPSS Inc., Chicago, IL, USA). The p-values less than 0.05 were considered statistically significant.
RESULTS
Minimal erythema dose values in narrowband ultraviolet B phototesting
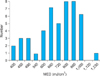
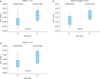
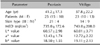
In 48 patients (25 patients with psoriasis and 23 patients with vitiligo), the MED was measured in a range of 400 to 1,230 mJ/cm2 (Fig. 1). Of 48 patients, there were 17 male patients and 18 female patients with skin type III. The patients were 14 to 74 years of age, and the MED values were 400 to 1,000 mJ/cm2 (average, 718.0±174.1 mJ/cm2) in skin type III. There were 8 male patients and 5 female patients with skin type IV. The patients were 13 to 72 years of age, and the MED values were 450 to 1,230 mJ/cm2 (average, 794.6±220.0 mJ/cm2) in skin type IV. Between skin types III and IV, the values of MED showed no notable difference statistically (p=0.212; Table 1). Among the psoriasis patients, there were 21 with skin type III and 4 with skin type IV (15 males and 10 females, 14 to 74 years of age); the MED values were 400 to 1,000 mJ/cm2 (average, 735.0±172.6 mJ/cm2). Among the vitiligo patients, there were 14 with skin type III and 9 with skin type IV (10 males and 13 females, 5 to 74 years of age); the MED values were 450 to 1,230 mJ/cm2 (average, 743.0±208.0 mJ/cm2). No noticeable differences in the MED values were shown between the psoriasis and vitiligo patients (p=0.888; Table 2).
Measurement of skin color by spectrophotometer
1) L*, a*, and b* values at minimal erythema dose sites in different skin types
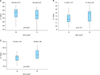
The type III patient group had a mean L* value of 60.62±2.73, a mean a* value of 12.35±1.37, and a mean b* value of 18.36±1.45. Type IV patients had a mean L* value of 59.44±3.43, a mean a* value of 13.16±2.03, and a mean b* value of 19.96±1.86. Among various spectrophotometric parameters, only b* values had a statistically significant difference between the type III and IV groups (p=0.003; Fig. 2).
2) Correlations between minimal erythema dose and L* values or minimal erythema dose and a* values, and minimal erythema dose and b*values
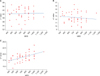
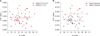
The mean L* value in the MED-NBUVB sites (400 to 1,230 mJ/cm2) was 60.30±2.95 (range, 52.16 to 64.89). The mean a* value in the MED-NBUVB sites (400 to 1,230 mJ/cm2) was 12.57±1.60 (range, 9.53 to 16.42). The mean b* value in the MED-NBUVB sites (400 to 1,230 mJ/cm2) was 18.80±1.70 (range, 14.31 to 23.64). There was no significant correlation between MEDs and L* values (Pearson correlation coefficient, 0.013; p=0.928; L*=60.1+0.0021 MED). There was little correlation between MEDs and a* values (Pearson correlation coefficient, -0.119; p=0.421; a*=13.3 to 0.00101 MED). There was a positive correlation between MEDs and b* values (Pearson correlation coefficient, 0.512; p<0.05; b*=15.4+0.00464 MED; Fig. 3).
3) Correlations between L* and a*, L* and b*, b* and a* values
The Pearson correlation coefficient between L* and a* values was -0.623 in all the patients, indicating that there is a statistically significant inverse correlation between the 2 values (p<0.05). The type IV patient group had a more prominent inverse correlation (Pearson correlation coefficient, -0.838; p<0.05) on the L*a* scatter plot compared to the type III group (Pearson correlation coefficient, -0.461; p=0.05). However, the Pearson correlation coefficient between the L* and b* values was 0.206, and the Pearson correlation coefficient between b* and a* values was -0.293 (Fig. 4). Although the b* L* curve and the b*a* curve seem to show significant correlation, we did not find a significant correlation on either of the 2 scatter plots.
4) Correlation between a* values and b*/L* values in different skin types
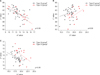
First, we compared the b*/L* values between type III and IV patients, and the b*/L* values in the latter group (n=13) were higher than those in the former group (n=35; 0.33605±0.02789 in the type IV group and 0.30328±0.02525 in the type III group; p<0.05; Fig. 5). This trend was also shown in the 2 subgroups of patients in whom delta E ranged from 3.0 to 6.0 or >6.0. In the group of patients in whom delta E ranged from 3.0 to 6.0, the trend was 0.33153±0.02218 in the type IV group and 0.30583±0.02338 in the type III group (p<0.05). In the other group (delta E>6.0), the trend was 0.34131±0.03486 in the type IV group and 0.30196±0.02657 in the type III group (p<0.05; Fig. 5).
Second, to determine a relationship between the erythema response and tanning status at the MED sites, we investigated the correlation between a* values and b*/L* values in all of the patients. The entire group of patients showed no significant correlation (Pearson correlation coefficient, 0.055; p=0.714) on the a*·b*/L* scatter plot.
Additionally, we investigated the correlation between a* values and b*/L* values under the 2 conditions; one group in whom the delta E ranged from 3.0 to 6.0 (n=18, delta E 3.0 to 6.0) showed no significant correlation (Pearson correlation coefficient, 0.015; p=0.953) on the a*·b*/L* scatter plot, and the other group in whom the delta E was > 6.0 (n=29) showed a very weak correlation (Pearson correlation coefficient, 0.115; p=0.553) on the a*·b*/L* scatter plot (Fig. 6). In addition, the correlation between a* values and b*/L* in skin phototype III showed no significant correlation (Pearson correlation coefficient, -0.112; p=0.520) on the a*·b*/L* scatter plot. The skin phototype IV group showed no significant correlation (Pearson correlation coefficient, 0.006; p=0.985) on the a*·b*/L* scatter plot (Fig. 6).
DISCUSSION
In a spectrophotometer, artificial light is delivered to a target and the reflected light is sent to a diffraction grating that is separated by waves. The reflexibility value of the separated light is measured by photodiode array detector and integrated to the formed reflexibility value curve. The values obtained from the spectrophotometer can also be converted into spectrophotometric values in the L*a*b* system according to the regulation of the CIE, and various skin reactions, such as erythema and tanning. These are analyzed through the plotting of 3 values in the plane of separate axes. The spectrophotometer detects subtle changes in skin colors, which are almost undetectable with the naked eye. Moreover, errors in the level of erythema and pigmentation of the skin caused by the subjective determination of examiners could be overcome by the application of the spectrophotometer because the evaluation of cutaneous sensitivity of UV radiation is such an important factor in the setting of phototherapy6. Fitzpatrick's classification for sun-reactive skin types is based on the history of an individual's tendency to sunburn and to tan. Westerhof et al.7 found that constitutional skin color objectively measured by a chromameter is a better predictor of skin response to UV, and the steepness of the dose-response curve for erythema is a better measurement of the skin response to UV irradiation.
There have been several studies that investigated the correlation between skin types and MED ranges. Andreassi et al.8 reported that a good correlation was found between MEDs and skin types, in spite of a variation in MED ranges according to the skin types. In clinical situations, the ranges of MED values do not reflect the skin types in Fitzpatrick's classification system. There have been many studies for MED determination in a more objective way using a spectrophotometer. Many important facts in the spectrophotometric aspect are clinically accepted about various parameters, such as L*a*b*. In general, the a*value shows a significant linear correlation with the dermatologist's perception of erythema, and the b*value shows a significant correlation with the perception of tannning9. Clarys et al.10 reported that the L*value decreases and the b* value increases depending on the degree of tanning. Youn et al.6 examined a correlation between MEDs and colorimeteric values measured in constitutive skin color sites and found that the L* value decreases significantly as the MED increases. They pointed out that the objectively measured skin color was useful for predicting skin sensitivity to NBUVB.
In this study, we enrolled the subjects only if the delta E was >3.0 (ΔE, 3.0 to 12.0) because various parameters could be more valuable when the delta E value was >3 in the spectrophotometric measurement, as we reported previously5. To find out any valuable facts about erythema, pigmentation, and tanning, especially in MED sites of different skin-type subjects, we first compared L*a*b* values separately according to skin types to obtain gross differences in each of various parameters. Second, we compared MEDs and each of the spectrophotometric values (L*or a*) to find their correlation. Third, we compared b*/L* values for tanning status in different skin types. Last, we investigated the correlation to each of the other spectrophotometric values and a correlation between a* and b*/L* to clarify a relationship between erythema response and tanning status.
Considering our results, the higher b* values in type IV skin individuals reflect that skin tanning develop more prominently in type IV persons than in type III, because the skin pigmentation status was formed in a cumulative manner even 24 hours after NBUVB irradiation. This result is in accordance with the previous results in which the b* value would be a good indicator of tanning1. Our results about the correlation between MEDs and b* values may signify that the skin pigmentation status is deepened with the higher MEDs.
Clarys et al.10 reported that L*values decrease and b*values increase when the degree of tanning is higher. Thus, we examined the difference of b*/L* values between skin type III and skin type IV. The average b*/L* value in the type IV group was significantly higher than in the type III group. The a* value is well known as an index of erythema, and our data showed that the b*/L* value is thought to be an index of tanning. Therefore, we investigated any relationship between the a* value and the b*/L* value to determine a correlation between erythema response and tanning ability in all patients and subgroups divided by skin types or delta E. Although an inverse correlation between the L* value and a* value has already been mentioned, we did not find a correlation between the a* value and b*/L* value. Although Westerhof et al.11 reported that the a* value reflects the perceptive erythema or MED measured by the optical method, the a* values measured in MED sites did not show any remarkable pattern in this study. Therefore, although the MED determination by naked eyes may be influenced by the background tanning and reflected light in practical situations, our data suggested that the a* value, measured by spectrophotometer, does not influence the degree of tanning and vice versa.
The constitutive skin color is composed of various chromophores, such as melanin, carotenoids, and oxy-/deoxyhemoglobin. UV-induced erythema with tanning is also added to that skin color12. An objective measurement of erythema in MED site does not simply mean spectrophotometric measurement of the corresponding parameter (a* value).
Additional parameters (b*, L*) and various combination items (b*/L*, ΔE) are also needed to describe the degree of tanning and to discern the perceptive color differences. However, the limitation of this study is that the all subjects are composed of Koreans, who predominantly have brown-colored skin (skin types III and IV). The CIE L*a*b* values of brown-colored skin correspond to a brownish color that is distributed almost uniformly around the center of the color system. Thus, the results of L*a*b* values could be controversial because of their limited choice of subjects in our study. Therefore, to overcome such limitation, we recommend that further studies with various skin types be performed.
In conclusion, the spectrophotometer can be applied as a measurement instrument with basic parameters in the field of photomedicine. We can develop various combinations of items to investigate photobiological phenomena, including erythema, tanning, and perceptive color differences. This effort can indicate more reliable spectrophotometric values to estimate erythema, pigmentation, and tanning in photomedicine. Moreover, such advanced knowledges likely to be useful to dermatologists, and the spectrophotometer is a more useful instrument to assist in setting phototherapy and measuring erythema, pigmentation, and tanning of various skin disorders on an objective basis. It can also be helpful in deciding skin phototypes and in posttreatment evaluation of vascular laser and whitening agents.
 XML Download