

 PDF
PDF ePub
ePub Citation
 Print
Print


INTRODUCTION
The skin is the largest organ of the body, covering an area of approximately 1.4~2.0 m2 and with a weight that can reach around 4 kg. It plays a variety of functional roles, including protection, preservation, temperature regulation, and Vitamin D synthesis. Skin is composed of many cell types, among which keratinocytes, melanocytes and fibroblasts are regarded as the most abundant and functionally important. Keratinocytes constitute a majority of the epidermis, and form cornified layers that help to contain body fluids and provide barrier protection from the environment1. Keratinocytes are ectodermally derived and play an essential role in the formation of hair, nail and sebum. Melanocytes are derived from the neural crest and located in the lower epidermis and hair follicles, where they generate melanin to provide coloration and protection from ultraviolet damage2. Fibroblasts, the major cells of the dermal portion, are derived from mesenchyme and synthesize essential extracellular matrix (ECM) components to provide structural support3.
The characteristics of each skin cell are determined by cell type-specific gene expression patterns. Thus, in order to understand the specification of each cell type, it is necessary to identify the genes whose expressions are confined to specific cells. To profile the gene expression, several noteworthy methods have been developed. DNA microarray technology is a powerful tool to facilitate massive screening of expression for thousands of genes4. One major application of this technology is the sequence-specific detection and quantification of mRNA expression. Oligonucleotide DNA microarray allows the identification of mRNA whose level is within a wide linear range. Furthermore, owing to the high specificity of DNA sequence detection, oligonucleotide DNA microarray is used for DNA sequencing5. In parallel with oligonucleotide DNA microarrays, cDNA microarray has also been developed6,7. This technology, in contrast to oligonucleotide microarray, uses cDNA molecules to interrogate mRNA samples. The fabrication of cDNA microarray differs in many ways from that of oligonucleotide microarray. Specifically, cDNA microarray is generated by spotting cDNA molecules of different lengths onto a given matrix of glass, nitrocellulose or nylon6,7. By pre-treating the surface of the microarray slide with polylysine or aminosilane, the specific hybridization of DNA strands to the target may be enhanced, while at the same time the enhanced hydrophobicity of the matrix helps to avoid non-specific attachment of target molecules. Using the cDNA microarray technique, in this study we attempted to compare the gene expression profiles between keratinocytes, melanocytes and fibroblasts. Our data provide important insight into the specification of each skin cell.
MATERIALS AND METHODS
Cell culture and RNA isolation
Normal human skin samples were obtained from circumcisions. Keratinocytes, melanocytes and fibroblasts were isolated from the foreskins of five donors. Specimens were briefly sterilized in 70% ethanol, minced, and then treated with dispase overnight at 4℃. The epidermis was separated and placed in a solution containing 0.05% trypsin and 0.02% EDTA for 15 minutes at 37℃. For keratinocytes, cells were resuspended in keratinocyte-serum free medium (K-SFM) supplemented with bovine pituitary extract and recombinant human epidermal growth factor (Invitrogen, Grand Island, NY, USA), as previously reported8. Third passaged keratinocytes (60~75% confluency) were used in this experiment. For melanocytes, cells were resuspended in Medium 154 and human melanocyte growth supplement (Cascade Biologics, Portland, OR, USA). During the primary culture of human melanocytes, 200 µg/ml of G418 (geneticin sulfate, Duchefa, Haarlem, The Netherlands) was added to the growth medium to suppress the proliferation of fibroblasts9. Primary dermal fibroblasts were obtained by the explant culture method, and maintained in Dulbecco's modified Eagle's medium (DMEM) supplemented with 10% fetal bovine serum (Invitrogen).
cDNA microarray
Total RNA samples were extracted using RNeasy Mini Kits (Qiagen, Hilden, Germany) according to the recommended protocol. The quality of all RNA samples was evaluated using agarose gel electrophoresis. Keratinocytes, melanocytes and fibroblasts were primary cultured from five foreskin specimens. Total RNAs were extracted, pooled to reduce the individual variations, and then used for cDNA microarray. For cDNA microarray analysis, aliquots of 100 µg of total RNA were labeled with Cy3 or Cy5 monoreactive dyes (Amersham, Buckinghamshire, UK) using a Superscript cDNA system (Gibco BRL, Grand Island, NY, USA). Labeled Cy3 and Cy5 cDNA probes were then cleaned using a Qiaquick nucleotide removal kit (Qiagen). The purified probes were dried and resuspended in 40 µl of hybridization buffer containing 5X SSC, 0.1% SDS, 20 µg of Cot-1 DNA (Gibco BRL), 20 µg of poly(A) RNA, and 20 µg of yeast tRNA (Gibco BRL). The probes were denatured at 95℃ for 3 minutes before being applied to the microarray slides. Hybridization was performed at 42℃ for 16 hours, and the microarray slides were washed once with 2X SSC, 0.1% SDS at 42℃ for 4 minutes, once with 0.1X SSC, 0.1% SDS at room temperature for 10 minutes, and three times with 0.1X SSC at room temperature for 1 minute. The microarray slides were then washed with distilled water and spin-dried.
Microarray scanning and normalization of the data were performed using a GenePix 4000B scanner and GenePix Pro 3.0 software (Axon Instruments, Union City, CA, USA). Poor-quality spots (sum of median <500) were filtered from the raw data before analysis. For each hybridized spot, the background intensity was subtracted and normalized by the global median normalization method10. The ratio of Cy5 and Cy3 fluorescence intensity was assigned as the gene expression value (GEV) for determination of the relative gene expression level. The cDNA microarray experiments were repeated twice, and the average of two GEVs for each gene was used for further analysis. Genes with a fourfold or more differential expression were analyzed. To further analyze the gene expression patterns, the self-organizing map (SOM) method was used, and the node number for SOM clustering was set at 3. Gene expression pattern clustering (hierarchical clustering and SOM) was performed using the programs Cluster version 2.12 and TreeView version 1.5011.
Statistical analysis
The fluorescence intensities from the microarray results were measured as indicators of the gene expression levels. We used foreground intensities after transforming the values by a logarithm of base two as expression values for the subsequent analysis. The majority of microarray data analysis was conducted using R software (http://www.rproject.org). We normalized the expression values of the 15,704 genes within a slide by the regional Lowess method12. To identify the differentially expressed genes among different cell types, we adopted the analysis of variance (ANOVA) model approach. To control for an inflated false positive rate due to multiple testing, we adjusted individual p-values using Benjamin-Hochberg's method, which controls the false discovery rate (FDR)13. To group genes according to their relative expression patterns among three different cell types, we used the combined approach with K-means clustering and Linear Discriminant Analysis (LDA). At first, we clustered genes using K-means algorithm with as many as 20 centroids for groups to obtain as many homogeneous pattern groups as possible. From the clustering result, we classified genes into three groups as follows: (1) upregulated in fibroblasts, (2) upregulated in keratinocytes, (3) upregulated in melanocytes. To provide a graphical view of the expression patterns of these three groups, we drew a heatmap using R. Finally, gene ontology analysis was performed to find the over-representative functions of genes in each group using GOstat (http://gostat.wehi.edu.au/)14.
Real-time polymerase chain reaction (PCR)
Total RNA was extracted using an RNeasy kit and cDNA was made using a reverse-transcription kit. PCR was performed on a Rotor-Gene 2000 real-time amplification operator (Corbett Research, Mortlake, Australia). Primers were designed using Primer 3 and all primers were verified by BLAST to ensure that each sequence was unique for the specific target gene. The PCRs contained a final concentration of 1×SYBR Green PCR Master Mix (Applied Biosystems, Warrington, UK), 10 µM specific primers, and 2.5 ng of cDNA. The expression of genes was calculated according to the threshold cycle value, normalized using the value of the sample with the lowest level of each product, and the data were expressed as the ratio of each gene to cyclophilin.
RESULTS AND DISCUSSION
Gene expression profiles
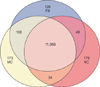
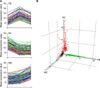
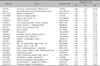
To analyze the gene expression profiles between keratinocytes, melanocytes and fibroblasts, we performed cDNA microarray analysis, in which a loop design was adopted. That is, the gene expression levels were compared between two cells types using Cy5 and Cy3 probes: keratinocytes (Cy5) vs melanocytes (Cy3), melanocytes (Cy5) vs fibroblasts (Cy3), and fibroblasts (Cy5) vs. keratinocytes (Cy3). For accuracy of analysis, dye swap experiments were also performed. We used 17 K cDNA microarray for hybridization, and obtained 12,028 relevant genes whose expression was detected in at least one of three cell types (Fig. 1). By comparing the relative expression levels by ANOVA test with cutoff limitation as a fourfold change, we obtained 478 genes that revealed differential expression in each of the three cell types. We further analyzed the gene expression pattern by SOM and classified the genes into three major gene clusters (Fig. 2). These clusters correspond to groups of coordinately regulated genes that represent expression signatures for fibroblasts, keratinocytes or melanocytes. Cluster 1 includes 126 genes that were expressed at high levels in fibroblasts, but at low levels in keratinocytes and melanocytes (Table 1). Cluster 2 contains 179 genes that were highly and specifically expressed in keratinocytes (Table 2). Cluster 3 includes 173 genes transcripts that were expressed at the highest levels in melanocytes (Table 3).
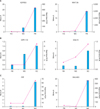
The expression of randomly selected genes from three SOMs was verified using real-time PCR analysis. There were good correlations between the average SOM values and the real-time PCR results for each gene. The expression of insulin-like growth factor binding protein 3 (IGFBP3) and WNT 5A, which were classified into cluster 1, was highly expressed in fibroblasts, but expressed at very low levels in keratinocytes and melanocytes (Fig. 3A). G protein-coupled receptor 110 (GPR110) and Guanine nucleotide binding protein (G protein), alpha 15 (Gq class) (GNA15), which were classified into cluster 2, were verified as a highly expressed in keratinocytes by real-time PCR analysis (Fig. 3B). Real-time PCR analysis convincingly confirmed that two genes belonged to cluster 3 and were overexpressed in melanocytes: Pirin (iron-binding nuclear protein) (PIR), and Basic helix-loop-helix domain containing, class B, 3 (BHLHB3) (Fig. 3C).
Cluster 1
Cluster 1 includes those genes that were highly expressed in fibroblasts and had relatively low expression levels in keratinocytes and melanocytes. Fibroblasts are derived from mesechyme and are responsible for the tensile strength of skin tissue by synthesizing various connective tissue matrix proteins and a number of soluble factors15. They are also implicated in skin photoaging16. Relative to young or normal skin, the dermis of photoaged skin shows both qualitative and quantitative differences in dermal collagen, elastins, and other structural components produced by fibroblasts17. In our cDNA microarray, the genes that were highly expressed in fibroblasts contained many ECM components such as collagen 1A2, 6A3, and 3A1 (Table 1), indicating that the experiments were methodologically appropriate. As noted, the physiologic role of collagen fibers in the skin is to provide the tensile properties that allow the skin to serve as a protective organ against external trauma. Collagen 1A2 is a fibrillar forming collagen that is found in skin, bone tendon and ligament18. Defects in this gene have been linked with defects in skin ranging from hyperextendability to poor wound healing19. Collagen 6A3 assembles into a relatively thin microfibrillar network, which may perform an anchoring function by stabilizing the assembly of the broad collagen fibers as well as the basement membranes20. Mutations in type VI collagen genes can lead to congenital muscular dystrophy, with no apparent phenotype in the skin but with limited joint hypermobility21. Collagen 3A1 predominates in human skin during embryonic life22. Mutations in Collagen 3A1 cause the vascular type of Ehlers-Danlos syndrome.
Other examples in this cluster include procollagen C-endopeptidase enhancer and lumican. The former stimulates the C-proteinase activity that is required for conversion of procollagen to collagen23. A lack of this enzyme results in impaired tensile strength of collagen fibers in the skin. Lumican belongs to the corneal leucine-rich repeat proteoglycan family, which play a critical role in generating and maintaining a transparent matrix within the corneal stroma24. So far, it is unknown whether lumican is expressed in dermal fibroblasts and further investigation of this topic is required.
Cluster 2
This cluster contains genes that were highly expressed in keratinocytes as compared with other two cell types. The keratinocytes are the ectodermally derived cells that constitute more than 80% of the epidermal cells. All keratinocytes contain cytoplasmic keratin intermediate filaments in their cytoplasm and form desmosomes or modified desmosomal junctions with adjacent cells. In accordance with the fact that keratin filaments are the hallmark of the keratinocytes, in our cDNA microarray results keratin 5 was highly ranked in this cluster (Table 2). Keratin 5 is a well-established biomarker for basal keratinocytes, and it has been demonstrated that mutations in this gene cause a blistering disorder of human skin, epidermolysis bullosa simplex25-27. It has been known that many of the keratinocyte-specific genes are located at the region of epidermal differentiation complex (EDC) in chromosome 1q21, and that EDC contains a large number of genes related to cornified envelope formation such as loricrin, involucrin, filaggrin, and the S100 family (or annexins)28. In our cDNA microarray, however, expression of those cornified envelope-related genes was not detected and/or they were ranked as low expressed genes. Because we used keratinocytes cultured in low calcium medium, which does not permit keratinocyte differentiation and thereby represents the basal layer characteristics, the low level expression of those genes was somewhat plausible.
In our cDNA microarray, three annexins (A2, A3, and A8) were ranked as being highly expressed genes in keratinocytes. Annexin A3, also called "lipocortin 3" or "placental anticoagulant protein 3" (PAP-III), is a member of the lipocortin/Anx family that binds to phospholipids and membranes in a calcium-dependent manner29. Annexin A3 has been shown to have anticoagulant and antiphospholipase A2 properties in vitro30 and to promote the calcium-dependent aggregation of isolated specific granules from human neutrophils31. Annexin A8 proteins are involved in injury response, inflammation, and in tumor suppression32. Although the functional roles of Annexin A3 and A8 have not yet been identified, it is interesting that an earlier report indicates that Annexin 1 and 2 bind to calcium, then exert their effects as the pro-differentiating factors in keratinocytes in vitro33. From this, we speculate that Annexin A3 and A8 may have similar effects on keratinocytes. Elucidation of the putative roles of those gene products will be an interesting topic for further study.
In our cDNA microarray, many of the genes related to the cell-cell junction were identified as being especially highly expressed in keratinocytes. Compared to the other two cell types, keratinocytes are packed in the epidermis in a condensed way, reflecting the importance of cell to cell contacts. For example, keratinocytes have numerous juctional structures, including desmosome, hemidesmosome and adherens junctions and tight junctions. The desmosomal plaque is composed of several intracellular plakin proteins, including phlakophilin and plakoglobin. Desmosome mechanically couples adjacent keratinocytes. Moreover it plays a significant role in epidermal differentiation and is part of the cornified cell envelope. Mutations in phlakophilin and plakoglobin cause ectodermal dysplasia/skin fragility syndrome and Naxos syndrome, respectively34,35. Hemidesmosome, anchoring filaments and anchoring fibrils are components of the dermal-epidermal junction basement membrane. Bullous pemphigoid antigen-1 (BPAg-1) is the major component of the hemidesmosomal inner plaque. Deletions in BPAg-1 cause epidermolysis bullosa simplex. Integrin is a large class of transmembrane ECM binding proteins that provide cell attachment and subsequent signal transduction. Integrin α6β4 has a high affinity for laminin 5, and is therefore essential to integration of hemidesmosome with the underlying basement membrane and stroma. Mutations in α6 or β4 chains result in dermal-epidermal instability36,37. Laminin 5 has been localized to the anchoring filaments and is essential in keratinocyte adhesion. Mutations in α3 or γ2 chains of laminin 5 result in severe Herlitz' junctional epidermolysis bullosa38. In this experiment, α3 and γ2 chains of laminin 5 and integrin α6 chains showed signature expression in the keratinocytes.
Cluster 3
This cluster contains genes that were highly expressed in melanocytes and expressed at very low levels in fibroblasts and keratinocytes. Melanocytes are dendritic, pigment-synthesizing cells derived from neural crust, for which pigmentation-related genes are excellent signature biomarkers39,40. In accordance with this fact, in our cDNA microarray results, pigmentation-related genes such as tyrosinase, microphthalmia associated transcription factor (MITF), tyrosinase-related protein 1, ocular albinism I, silver, oculocutaneous albinism II, and melan-A were ranked as the highly expressed genes in melanocytes. Besides this, we found several genes that have not been previously known in melanocytes such as glutaminylpeptide cyclotransferase (QPCT), which has been well-studied in bovine pituitary41. The putative role of this gene remains to be determined.
In our results, Disheveled (Dvl) (the 65th gene in the upregulated genes in the melanocytes) was identified as a signature gene in melanocytes. Dvl is required for Wnt signals, which enhance the induction of melanoblasts from neural crust cells42. Wnts are secreted glycoproteins that play a critical role in melanocyte fate decision by activating the Frizzled family. Activation of Frizzled receptor by Wnt triggers the activation of Dvl, which in turn inactivates glycogen synthase kinase 3β (GSK3β). As a consequence, the level of β-catenin increases, allowing its translocation to the nucleus and facilitates the activation of genes by Tcf/Lef transcription factors. A key target of Tcf/Lef/β-catenin in early melanocyte precursors is MITF43,44. Therefore, we speculate that a high expression of Dvl is required for proper specification of melanocytes.
In summary, we compared the gene expression profiles between keratinocytes, melanocytes and fibroblasts. We found many novel signature genes for each cell type, the functions of which have not yet been reported. Although the precise functional roles of such genes remain to be determined, our data add new information on which to base further investigation into the regulatory mechanism underlying the specification of skin cells.


 XML Download