

 PDF
PDF ePub
ePub Citation
 Print
Print


INTRODUCTION
Phototherapy using ultraviolet B (UVB) has widely been used in the treatment of dermatologic diseases. Narrow-band UVB (NBUVB), which emits a concentrated UVB source of 311 nm, has been shown to have a profound therapeutic effect for the treatment of psoriasis1.
The mechanism by which UVB treats clinical dermatoses is thought to be through the induction of apoptosis. Studies of broad-band UVB (BBUVB)-treated keratinocytes have demonstrated that apoptosis is a direct consequence of dose and exposure time234. NBUVB is also capable of inducing apoptosis in keratinocytes, though at significantly higher doses of energy than BBUVB5. NBUVB 1,000 mJ/cm2 induces apoptosis in approximately 50% of keratinocytes. This rate far exceeds the observed value of 1% for apoptosis in suprabasal keratinocytes under normal, physiological conditions67.
Transforming growth factor (TGF) is crucial for normal epidermal growth and differentiation. More than 30 members of the TGF-β family have been identified and grouped into several categories: prototypic TGF-β (TGF-β1 to TGF-β3), bone morphogenetic proteins, growth/differentiation factors, and activins. The TGF name for this family of molecules is somewhat of a misnomer because TGF- β has antiproliferative effects on most cell types. The time course for growth arrest by UVB and TGF-β1 are different: UVB-mediated growth arrest is known to occur within 3 hr after UVB irradiation8, while treatment with TGF-β1 results in growth arrest in approximately 52 hr9. In keratinocytes, secreted TGF-β1 was downregulated less than 50% by UVA, while there was no significant alteration by UVB after irradiation with 20 and 40 J/cm2 and 10 and 20 mJ/cm2, respectively10. The effect of TGF-β isoforms on keratinocytes during NBUVB irradiation at a dose that causes apoptosis has not been well-definedβ. In the present study, we investigate the differences in TGF-β isoform expression in keratinocytes after exposure to NBUVB.
MATERIALS AND METHODS
Keratinocyte preparation and narrow-band ultraviolet B irradiation
Normal human keratinocytes were isolated from neonatal foreskin and were grown in medium 254 (Cascade Biologics Inc., Portland, OR, USA) with human keratinocyte growth supplement (Cascade Biologics Inc.) and 1% penicillin-streptomycin-amphotericin B (10,000 U/ml, 10,000µg/ml, and 25 µg/ml, repectively; GIBCO BRL., Grand Island, NY, USA) in a humidified atmosphere containing 5% CO2 at 37℃. Isolated keratinocytes were cultivated at 37℃ and 5% CO2 in Epilife (Cascade Biologics, Inc., USA). Subconfluent primary cultures were passaged in secondary cultures, the tertiary passaged cells were used, and media was renewed every other day. During irradiation, culture dish lids were removed, and culture medium was removed and replaced with PBS (phosphate Buffered Saline, pH 7.4, GibcoBRL, USA). All experiments were independently repeated twice.
Keratinocytes were irradiated with NBUVB using a fluorescent lamp which emitted a peak wavelength of 312 nm (TL-01; Philips). Culture media was switched with PBS 72 h prior to irradiation in order to keep the cells in a quiescent phase. Conditioned media was returned to the dishes after UVB irradiation. Keratinocytes were exposed to various doses of irradiation (800, 1000 and 1200 mJ/cm2)6. The control group was maintained under the same conditions without UV irradiation. Irradiation doses were measured using a UV meter (Waldmann Medizintechnik, Schwenningen, Germany) for NBUVB.
Measurement of TGF-βs by ELISA
Culture media was harvested and stored at 80℃ until ELISA was performed. TGF-β1 and TGF-β2 were quantified using a human TGF-β ELISA kit (R & D Systems, Minneapolis, MN, USA). The absorbance at 450 nm was determined in a microplate reader (E max; Molecular Devices, Sunnyvale, CA, USA).
RNA isolation
At the end of the final experimental period, total cellular RNA was purified from cultured cells by the RNA-Bee solution (Tel-test, Inc, Friendswood, TX, USA). The cells were lysed with 1.0 ml RNAzol B solution and extracted by adding 0.1 volume chloroform. After centrifuging at 12,000 g (4℃) for 15 min, the supernatant was transferred to a new 1.5 ml tube, and an equivalent amount of isopropranol was added. The samples were precipitated for 15 min at 4℃. After centrifugation, total RNA was measured at 260 nm using a spectrophotometer.
Reverse transcriptase-polymerase chain reaction (RT-PCR)
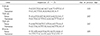
First-strand complimentary DNA (cDNA) synthesis was performed using a cDNA synthesis kit (Promega, Madison, WI, USA) according to the manufacturer's protocol. cDNA synthesis was performed by reverse transcription in a total volume of 20µl reaction mixture containing 1 g RNA, 2µl of 10×reaction buffer (100 mM Tris-HCl, pH 9.0, 500 mM KCl, 1% Triton X-100), 4µl of 25 mM MgCl2, 2µl of 10 mM of each deoxynucleotide triphophate (dNTP), 0.5 g random primer, 20 U of RNase inhibitor, and 15 U AMV reverse transcriptase. The mixture was incubated at 25℃ for 10 min, 42℃ for 1 hr, then heated to 95℃ for 5 min and chilled on ice. The PCR reaction was performed in a mixture of 50µl containing 2µl cDNA, 5µl of 10×reaction buffer (100 mM Tris-HCl pH 8.3, 500 mM KCl, 15 mM MgCl2), 4µl of 2.5 mM of each dNTP, 20 pmol of each primer (Table 1), and 2 U Taq DNA polymerase (Bioneer, Korea). All reactions were carried out in a thermal cycler (Perkin Elmer 9600, Norwalk, CT, USA) with an initial denaturation step of 95℃ for 4 min. 30 cycles were then performed of denaturing at 95℃ for 1 min, annealing at 58℃ (for TGF-β1) and 55℃ (for TGF-β2, TGF-β3, and β-actin) for 1 min, and extension at 72℃ for 1 min. The run was terminated at 72℃ for 5 min, and the temperature was then reduced to 4℃ for sample storage until further processing. The negative controls−water instead of cDNA and the products of the reverse transcription (RT) reactions without reverse transcriptase−were subjected to polymerase chain reaction (PCR) and were confirmed to have no false-positive reactions. 10µl of PCR products were separated by electrophoresis on a 2% agarose gel containing 0.5 g/ml ethidium bromide and visualized by image analysis (Gel Doc 1,000 gel documentation system, Bio-Rad, Hercules, CA, USA). The size marker was DNA molecular weight marker 100 bp ladder (Takara, Japan), and PCR band intensity was measured by a densitometer (Model GS-700 imaging densitometer, Bio-Rad) and expressed as intensities relative to β-actin. The expression levels of TGF-βs mRNA were measured after 24 hr and 48 hr.
RESULTS
Expression of TGF-β1 protein during NBUVB in human keratinocyte culture
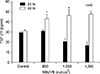
As shown in Fig. 1, a representative ELISA of human keratinocyte, TGF-β1 protein levels were significantly increased at 800, 1000, and 1200 mJ/cm2 compared with the control group at 48 hr. However, TGF-β1 protein levels were decreased at 1,000 and 1,200 mJ/cm2 at 24 hr compared to control (p<0.05). TGF-β1 protein levels were not significantly increased or decreased at 800 mJ/cm2 at 24 hr compared to control (p>0.05).
Expression of TGF-β2 protein during NBUVB in human keratinocyte culture
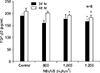
As shown in Fig. 2, TGF-β2 protein levels were significantly decreased at 1,000 and 1,200 mJ/cm2 compared with the control group at both 24 hr and 48 hr. However, TGF-β2 protein levels were not-significantly decreased at 800 mJ/cm2 at 24 hr and 48 hr compared to control (p>0.05).
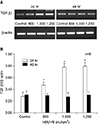
Expression of TGF-β1 mRNA during NBUVB irradiation in human keratinocyte culture
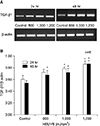
Fig. 3A is a representative RT-PCR of extracted RNA which shows that the predicted TGF-β1 mRNA band was detected in all samples. The combined densitometric analysis of the RT-PCR analyses is shown graphically in Fig. 3B. After NBUVB irradiation, TGF-β1 mRNA levels were increased at 800, 1,000, and 1,200 mJ/cm2 compared with the control group (p<0.05) at 24 hr and 48 hr. However, TGF-β1 mRNA levels were not significantly increased at 800 mJ/cm2 at 24 hr (p>0.05). Both TGF-β1 mRNA and protein levels were significantly increased at 48 hr.
Expression of TGF-β2 mRNA during NBUVB irradiation in human keratinocyte culture
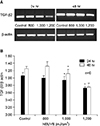
Fig. 4A is a representative RT-PCR of extracted RNA which shows that the predicted TGF-β2 mRNA band was detected in all samples. The combined densitometric analysis of the RT-PCR analyses is shown graphically in Fig. 4B. TGF-β2 mRNA levels were decreased at 800, 1,000, and 1,200 mJ/cm2 compared with the control group at 24 hr and 48 hr. However, TGF-β2 mRNA levels were not significantly decreased at 800 mJ/cm2 at 24 hr (p>0.05).
Expression of TGF-β3 mRNA during NBUVB irradiation in human keratinocyte culture
Fig. 5A is a representative RT-PCR of extracted RNA which shows that the predicted TGF-β3 mRNA band was detected in all samples. The combined densitometric analysis of the RT-PCR analyses is shown graphically in Fig. 5B. TGF-β3 mRNA levels were significantly increased at 800, 1,000, and 1,200 mJ/cm2 at 24 hr (p<0.05). However, TGF-β3 mRNA levels did not differ from expression levels compared to control at 800, 1000, and 1,200 mJ/cm2 at 48 hr (p>0.05).
DISCUSSION
TGFs are potent multifunctional autocrine- and paracrine-acting regulators of morphogenesis, angiogenesis, adhesion, chemotaxis, immune response, and extracellular matrix formation11. TGF-β plays an important role not only in cell growth control but also in inflammation and immunoregulation. Furthermore, TGF-β affects extracellular matrices by inducing the synthesis and secretion of many extracellular matrix proteins, increasing the expression of many integrins, and regulating the synthetic activity of secreted proteases and protease inhibitors121314. Exogenous TGF-β1 has induced differentiation and apoptosis of normal proliferating human oral keratinocyte15. In addition, pretreatment with TGF-β1 enhanced UV-mediated c-Jun amino-terminal kinase activation, which is involved in UV-mediated apoptosis in a spontaneously immortalized human keratinocyte cell line (HaCaT)16.
There are at least five different isoforms of TGF-β. These isoforms have been shown to be differentially expressed spatially and temporally in vivo throughout embryogenesis17, tissue repair18, and carcinogenesis1920, suggesting distinct roles for the individual isoforms in vivo. Recent studies have revealed different functions for each TGF-β isoform in keratinocyte proliferation and differentiation. For example, TGF-β1 was localized to the upper differentiated layers, the stratum granulosum and corneum, whereas TGF-β2 and weaker TGF-β3 immunostaining was present in all suprabasal layers of normal keratinizing epithelium21. Different isoforms of TGF-β are also associated with different proliferation or differentiation states of the epidermis22.
Our results showed that TGF-β1 mRNA and protein levels were increased after 48 hrs of NBUVB at 800, 1,000 and 1,200 mJ/cm2. The increased expression was in proportion to the irradiating NBUVB dose. Therefore, it may be suggested that the mechanism of treatment of NBUVB take place through induced differentiation of epidermal keratinocyte due to increased TGF-β1.
TGF-β1 mRNA levels were increased and TGF-β1 protein levels were decreased after 24 hr, but both increased after 48 hrs. These results were consistent with a study that reported cell growth arrest approximately 52 hrs after treatment with TGF-β19. The discrepancies between relative mRNA and protein expression patterns suggest the possibility of post-transcriptional regulation of TGF-β1 expression in selected cells or tissues.
Concentration of TGF-β2 in psoriasis-related studies were a similar level to those in a normal person23. There was no correlation between PASI (Psoriasis Area and Severity Index) and plasma TGF-β223, which can be explained by the predominant expression of TGF-β2 in the lower epidermal layer24. However, decreased TGF-β2 has been shown to be associated with excessive proliferation of keratinocytes and increased risk of psoriasis in normal epidermis, which implicates the role of TGF-β2 in skin proliferation and differentiation19. Compared with normal skin, psoriatic skin lesions showed decreased TGF-β2 staining in the epidermis, especially in the middle and lower epidermis. This suggests that the decrease of TGF-β2 in the epidermis of psoriatic skin may contribute to epidermal hyperplasia, a hallmark of psoriasis25. In this study, TGF-β2 mRNA levels were decreased at 800, 1,000 and 1,200 mJ/cm2 compared with the control group at 24 hr and 48 hr. The decrease was inversely proportional compared to TGF-β1 with respect to both dose and time. Thus, we propose opposing roles for TGF-β1 and TGF-β2. In keratinocytes, TGF-β1 contributes to delayed re-epithelialization and increased keratinocyte proliferation, while TGF-β2 has little effect on any parameters of repair, and exogenous TGF-β3 has little effect on re-epithelialization. In fibroblasts, some studies report the opposing roles of TGF-β1 to TGF-β3 and TGF-β1 to TGF-β2262728. In mice with encephalomyelitis, there was an inverse relationship between expression of TGF-β1 that is enhanced in mice with encephalomyelitis, and TGF-β3 that is enhanced in E2-protected mice. The TGF-β3 isoform displayed anti-proliferative properties towards encephalitogenic cells in vitro. Thus, TGF-β1 and TGF-β3 isoforms were suggested to play opposing roles29. In our study, we could not measure the protein levels of TGF-β3, and the mRNA levels of TGF-β3 were increased at 24 hr. Therefore, it was unclear if TGF-β1 played an opposite role to TGF-β3. However, because the mRNA levels of TGF-β3 were increased at 24 hr and similar levels were seen at 48 hr, it can be assumed that TGF-β3 is inhibited through autoregulation and that it functions opposite to TGF-β2.
Our results suggest a possible role for TGF-β1 after NBUVB irradiation and opposing roles for TGF-β1 and TGF-β2 isoforms in NBUVB irradiation. Further evaluation is needed in order to clarify functions of TGF-β isoforms.
 XML Download