Abstract
Background and Objectives:
Controversy remains regarding whether the age at which patients undergo adenoidectomy is increasing or decreasing. Thus, the aim of this study was to analyze patient age at adenoidectomy over the past 30 years.
Subjects and Method:
Retrospective analysis of adenoidectomy patients treated between 1984 and 2013 who were con-firmed to have adenoid hypertrophy on physical examination and radiologic findings was performed. Patients were divided into three groups by decade, the 1980s, 1990s, and 2000s. The numbers of patients, mean/median age, maximum age, and sex ratio were analyzed for each group.
Go to : 
REFERENCES
1). Brodsky L, Koch RJ. Bacteriology and Immunology of normal and diseased adenoids in children. Arch Otolaryngol Head and Neck Surg. 1993; 119:821–9.

2). Leach J, Olson J, Hermann J, Manning S. Polysomnographic and clinical findings in children with obstructive sleep apnea. Arch Otolaryngol Head Neck Surg. 1992; 118:741–4.

3). Richtsmeier WJ. Human interferon production in tonsil and adenoid tissue culture. Am J Otolaryngol. 1983; 4:325–33.
4). Schulman ST. Streptococcal pharyngitis: diagnostic consider-ations. Pediatr Infct Dis J. 1994; 13:567–71.
5). Liang C, Ruiz AG, Jensen EL, Friedman NR. Indications, clinical course, and postoperative outcomes of urgent adenotonsillectomy in children. JAMA Otolaryngol Head Neck Surg. 2015; 141:236–44.

6). Ramos SD, Mukerji S, Pine HS. Tonsillectomy and adenoidectomy. Pediatr Clin North Am. 2013; 60:793–807.

7). Ophir D, Gilboa S, Halperin D, Marshak G. Obstructing adenoids in adolescents: changing trends. J Otolaryngol. 1993; 22:91–3.
8). Kim KS, Lee JS, Youn JS, Kim SG. Change of age on adenoidectomy through 10 years. Korean J Otorhinolaryngol-Head Neck Surg. 1996; 39:508–12.
9). Park SK, Choi ES, Hwang BH, Eom JW. Change of age on adenoidectomy in 1990s. Korean J Otorhinolaryngol-Head Neck Surg. 2002; 45:149–53.
10). Young IS. Adenoidectomy: how often is tonsillectomy later? J Lar-yngol Otol. 1962; 76:791–6.
11). Rynnel-Dagöö B, Ahlbom A, Schiratzki H. Effects of adenoidectomy: a controlled two-year follow-up. Ann Otol Laryngl. 1978; 87:272–8.
12). Hsu WC, Kang KT, Weng WC, Lee PL. Impacts of body weight after surgery for obstructive sleep apnea in children. Int J Obes (Lond).
13). Kim YS, Park MJ. Time Trend in height, weight, BMI and waist circumference of Korean adolescents; from the Korean National Health and Nutrition Examination Survey (KNHNES), 1998, 2001 and 2005. J Korean Soc Pediatr Endocrinol. 2007; 12:142–9.
14). Modrzynski M, Zawisza E. An analysis of the incidence of adenoid hypertrophy in allergic children. Int J Pediatr Otorhinolaryngol. 2007; 71:713–9.

15). Kapusuz Z, Ozkırış M, Okur A, Saydam L. The prevalence of adenoid hypertrophy in adults in a rural area of Turkey. Kulak Burun Bogaz Ihtis Derg. 2012; 22:225–7.

16). Yeo NK, Jang YJ, Lee BJ, Chung YS. Correlation between the size of adenoid and the preoperative and postoperative symptoms after tonsillectomy and adenoidectomy. J Rhinol. 2007; 14:82–87.
Go to : 
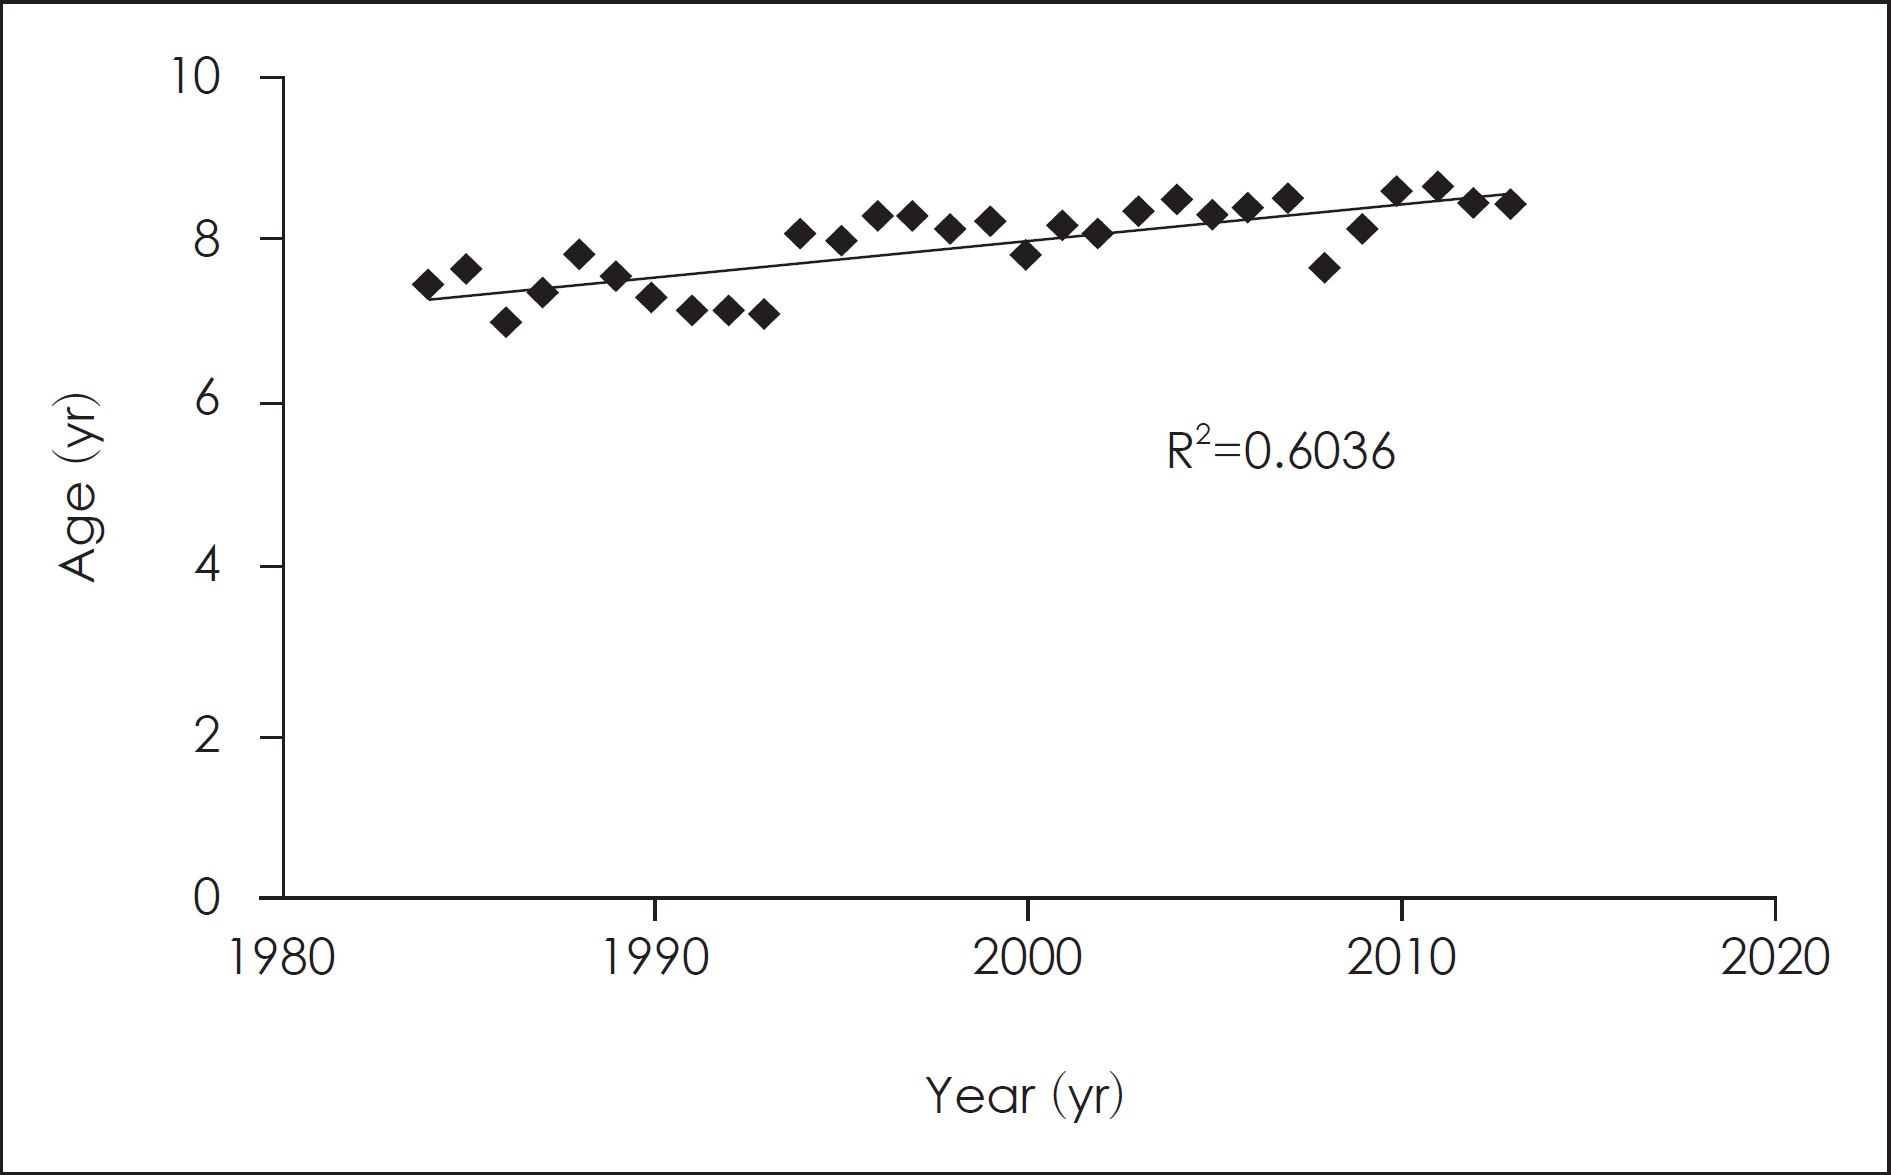
 | Fig. 1.The change of mean age during 30 years. The mean age for the 1980s, the 1990s, and the 2000s groups was 7.38, 8.16, and 8.35 years old, respectively. The 1990s and 2000s groups showed a significant increase in mean age ( p<0.001) com-pared to the 1980s group, but there was no significant difference between the 1990s and the 2000s groups ( p=0.432). |
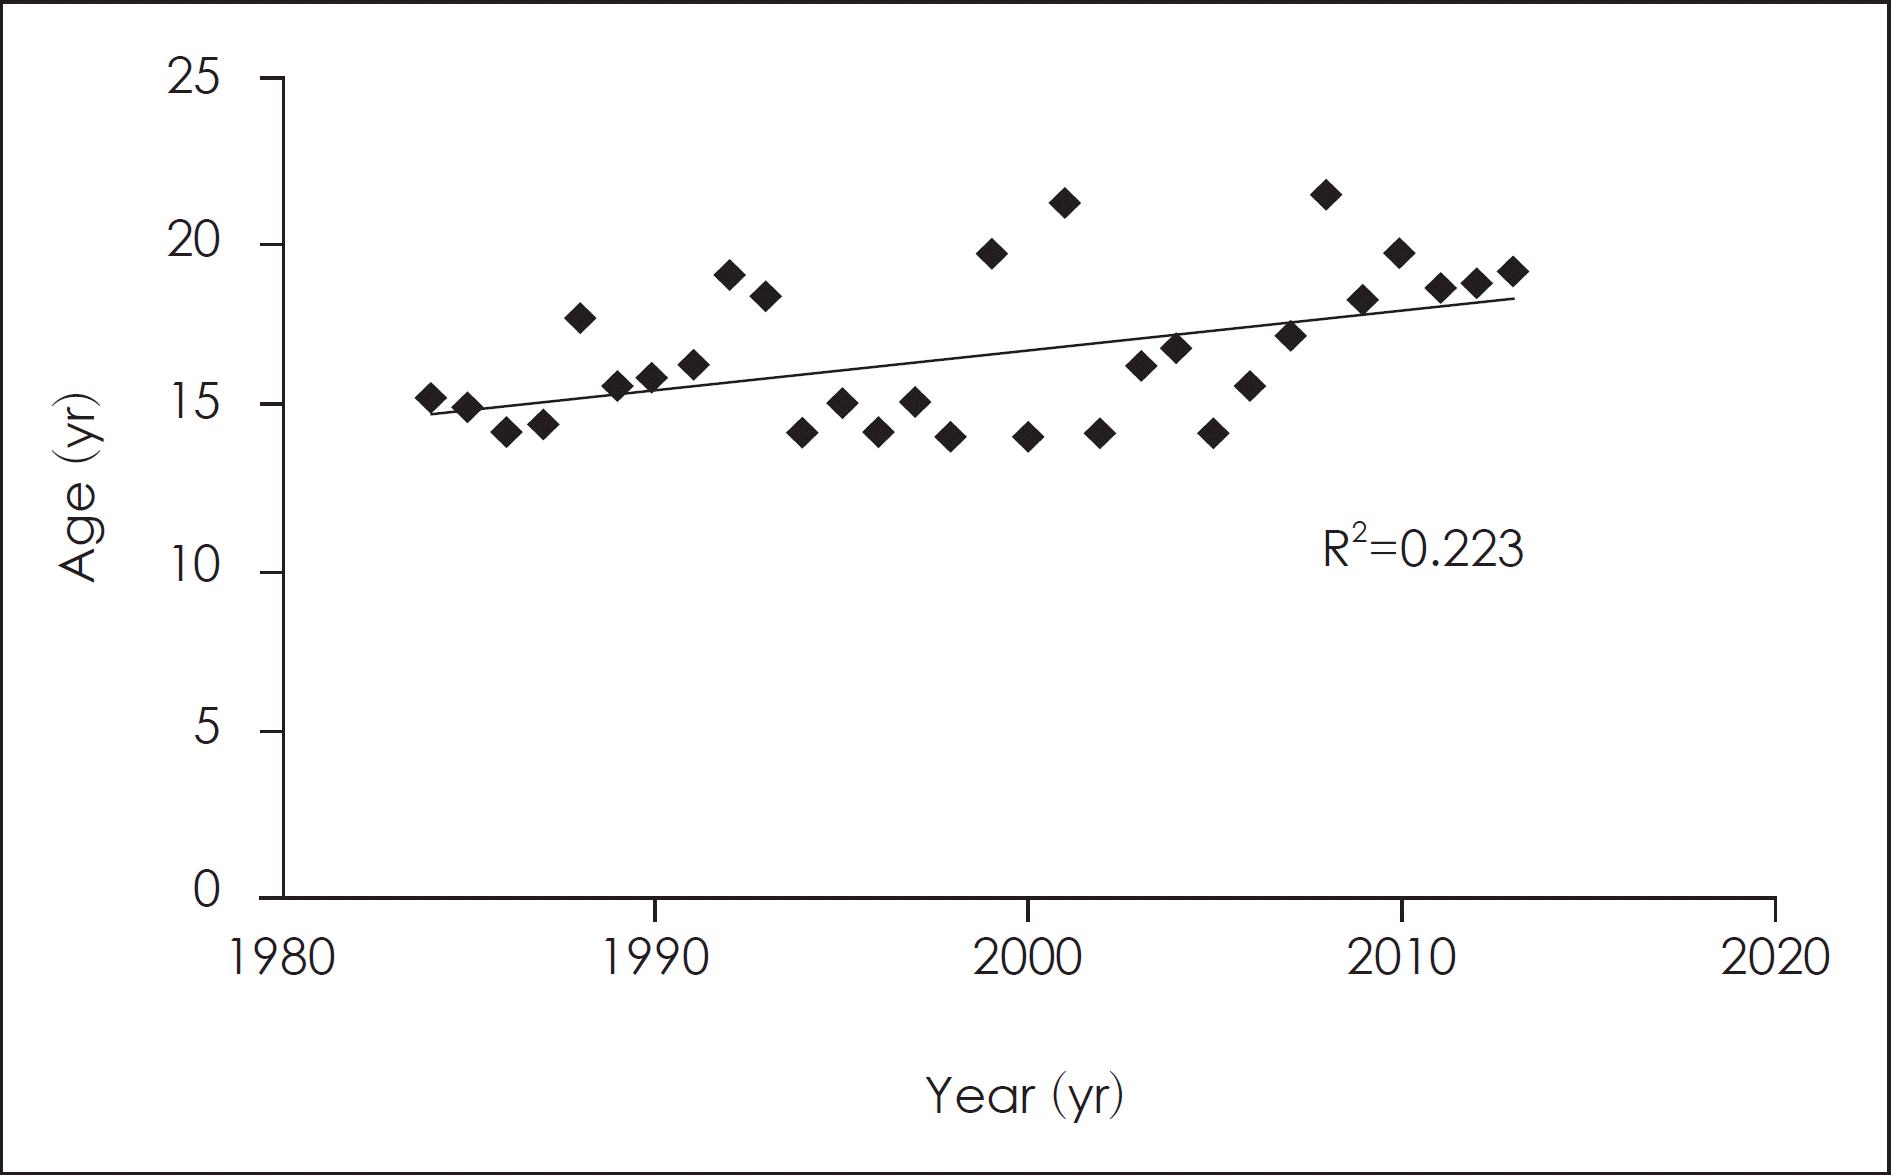
 | Fig. 2.The change of the highest age during 30 years. The highest age for the 1980s, the 1990s, and the 2000s groups was 18.92, 21.08, and 21.42 years old, respectively. There was the tendency to increase in highest age in each group during 30 years. |
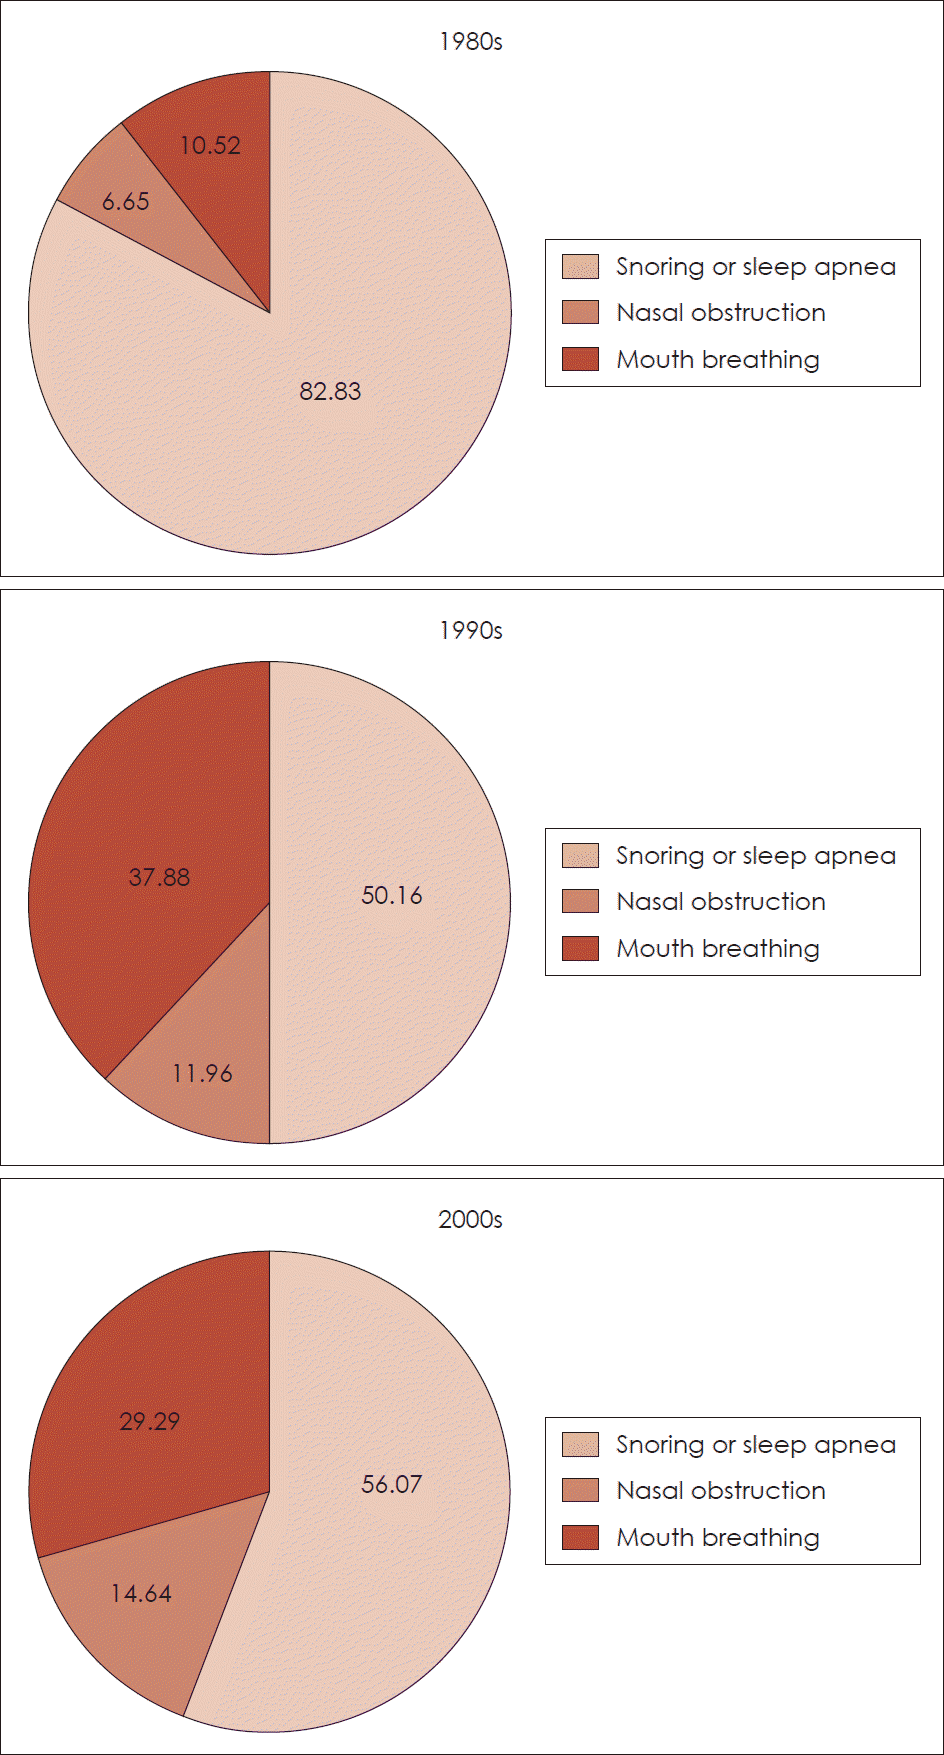
 | Fig. 3.The change of chief complaint during 30 years. The main chief complaint for the 1980s was snoring or sleep apnea. There was the tendency to decrease the ratio of snoring or sleep apnea in chief complaint during 30 years. On the other hand, the ratio of nasal obstruction or mouth breathing in chief complaint increased after 1990s. |
Table 1.
Parameters of age distribution in the 1980s
Table 2.
Parameters of age distribution in the 1990s
Table 3.
Parameters of age distribution in the 2000s


 PDF
PDF ePub
ePub Citation
 Print
Print


 XML Download