

 PDF
PDF ePub
ePub Citation
 Print
Print


INTRODUCTION
Accurate diagnosis is the cornerstone of good clinical care and provides the basis for proper treatment. Meta-analysis is a statistical technique for combining results from different studies on the same topic and is becoming a popular method for resolving discrepancies in diagnostic test accuracy [1,2]. Meta-analysis of studies examining diagnostic accuracy can provide more precise assessments when small studies addressing the same test and patients are available [3]. The small sample sizes and correspondingly inadequate statistical strength of these individual studies can be overcome by combining the results from several studies to increase the statistical strength and precision in estimating effects [1]. This technique examines the discrepancies in the results of different studies by addressing inter-study heterogeneity, thus providing a more precise measurement of diagnostic test accuracy [4]. Meta-analysis of diagnostic tests is considered decisive evidence [5] and is becoming an important tool for understanding diagnostic test accuracy.
Meta-analysis of diagnostic tests summarizes the accuracy, e.g., the sensitivity and specificity, of diagnostic tests [2]. This review describes the basic steps in a meta-analysis to evaluate test accuracy [6]: 1) describing the results of individual studies, 2) searching for heterogeneity, 3) testing for the threshold effect, 4) deciding on the model for statistical pooling, 5) dealing with heterogeneity, and 6) interpreting meta-analysis results of diagnostic tests (Table 1).
DIAGNOSTIC TEST ACCURACY
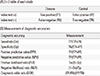
Diagnostic test accuracy refers to the ability of a test to distinguish between patients with disease and those without. The test accuracy may be measured in a number of ways and is commonly reported using several statistical parameters: the sensitivity and specificity, the positive and negative predictive values (PPV and NPV), the positive and negative likelihood ratios (PLR and NLR), the diagnostic odds ratio (DOR), or the receiver operating characteristic (ROC) curve [7] (Table 2).
The sensitivity of a test is the probability that the index test result will be positive in a diseased patient, while the specificity is the probability that the index test result will be negative in a non-diseased patient [6]. The PPV is the probability that a patient with a positive test result is diseased, while the NPV is the probability that a patient with a negative test result is non-diseased. The PLR describes how many times more likely positive test results are in the diseased group compared to the non-diseased group, while the NLR describes how many times less likely negative index test results are in the diseased group compared to the non-diseased group. The DOR summarizes the diagnostic accuracy of the test with a single number that describes how many times higher the odds of obtaining a positive result are in a diseased patient relative to a non-diseased patient. The ROC curve is obtained by varying the positivity threshold across all possible values and plotting sensitivity (true positive rate) against 1-specificity (false positive rate). The summary ROC (sROC) curve is the estimate of an ordinary ROC curve adjusted for the study outcomes in the ROC space [6] and displays the results of individual studies in ROC space. The area under the curve (AUC) and the index Q are useful summaries of the curve. The AUC is the probability that a diseased individual will have a higher test result than a non-diseased individual for a randomly selected pair of individuals, which is 1 for a perfect test and 0.5 for a completely uninformative test. The AUC can also be interpreted as the average sensitivity of the test taken over all specificity values (or, equivalently, as the average specificity over all sensitivity values). The Q* index is another useful global estimate of test accuracy for comparing sROC curves and is defined at the point where sensitivity equals specificity on an sROC curve. A Q* value of 1.0 indicates 100% accuracy (i.e., sensitivity and specificity of 100%) [8].
METHOD OF META-ANALYSIS OF DIAGNOSTIC TEST ACCURACY
A summary of the general process for meta-analysis of diagnostic tests is provided in Table 1. Following the process of meta-analysis will facilitate implementation and understanding of meta-analysis.
1. Describing the results of individual studies
Reporting the main results of all included studies is a crucial part of meta-analysis as it indicates the outcome measures and provides insight into their heterogeneity [9]. It is important to report pairs of outcome measures, i.e., sensitivity and specificity.
2. Searching for heterogeneity
Before statistically combining the data from the included studies, inter-study heterogeneity must be tested and quantified [10]. The heterogeneity test examines the null hypothesis: there are no differences between the findings of primary studies. Cochran's Q test is used to determine whether variations between primary studies represent true differences or are due to chance [11]. Cochran's Q value is calculated by summing the squared deviation of each study's estimate from the overall estimate and then comparing it with the chi-squared distribution for κ-1 degrees of freedom (df), where κ is the number of studies [11]. A P value<0.10 (not 0.05) indicates the presence of heterogeneity due to the low statistical strength of Cochran's Q test [12]. Another common indicator of heterogeneity is the I2 value, which quantifies the effect of heterogeneity and does not depend on the number of studies or the type of outcome data. I2 values range from 0-100% and represent the proportion of inter-study variability that can be attributed to heterogeneity rather than chance (I2=100%×(Q-df)/Q) [13]. I2 values of 25%, 50%, and 75% are interpreted as low, moderate, and high estimates, respectively.
3. Testing for the threshold effect
One of the causes of heterogeneity in diagnostic test studies is the threshold effect, which arises when differences in sensitivities and specificities occur due to different cut-off points. Different studies may use different implicit cut-off points, and variations in the diagnostic accuracy may be partly due to variations in cut-off points. Spearman's correlation coefficient between the sensitivity and the specificity of all studies can test for the presence of a threshold effect [8], which is suggested by a strong positive correlation.
4. Deciding on the model for statistical pooling
Meta-analysis combines the effect sizes of the included studies by weighting the data according to the sample size and variability within each study. The choice of statistical method for meta-analysis depends on the heterogeneity observed in the results [14]. The fixed effect model assumes that genetic factors have similar effects on disease susceptibility in all the studies and that observed variations are caused by chance alone [15]. The random effects model assumes that different studies exhibit substantial diversity and assesses both intra-study sampling errors and inter-study variances [16]. In the absence of heterogeneity, a fixed effects model is used for meta-analysis. When a significant Q value (P<0.10) is calculated, indicating the existence of heterogeneity in the studies, a random effects model is applied for meta-analysis. Both models offer similar results for homogeneous study groups; however, if heterogeneity is present, the random effects model usually provides wider confidence intervals than the fixed effects model.
5. Dealing with heterogeneity
It is important to assess the presence of heterogeneity in the studies included in the meta-analysis and determine the possible causes of heterogeneity. Differences can be explained by analyzing study subgroups or by meta-regression. Subgroup analysis performs meta-analysis based on factors such as the characteristics of the study design, and an assessment is made to determine how much the design difference affects the test accuracy. Subgroup analysis can detect homogeneous subgroups. Meta-regression is a regression analysis that explores possible factors contributing to heterogeneity [4]. The DOR is normally used to measure the accuracy, as it is a unitary measure of diagnostic performance that encompasses sensitivity and specificity or PLR and NLR [13].
6. Interpreting meta-analysis results of diagnostic tests
The main results are commonly presented in a table summarizing the findings. Appropriate interpretations of meta-analysis results consider the aim of the meta-analysis study and the potential role of the index test in clinical practice [6]. It is necessary to explain the role of the test in practice and the potential consequences of a positive or negative test result.
AN EXAMPLE OF A META-ANALYSIS OF DIAGNOSTIC TESTS
To evaluate the diagnostic performance of minor salivary gland biopsy (MSGB) for patients with primary Sjögren's syndrome (pSS), we performed a meta-analysis on the diagnostic accuracies of MSGB for the diagnosis of pSS using published data. Intra- and inter-study variations and heterogeneities were assessed by Cochran's Q statistic. The effect of heterogeneity was quantified by using I2 from 0-100%, which represents the proportion of inter-study variability attributable to heterogeneity rather than to chance [12]. We used a random effects model to combine the sensitivity, specificity, PLR, NLR, and DOR estimates due to heterogeneity, and analyzed the sROC curves. The Q* index is another useful global estimate of test accuracy for comparing sROC curves. Statistical manipulations for this meta-analysis were performed with Meta-DiSc, version 1.4 (Hospital Universitario Ramon y Cajal, Madrid, Spain) [17]. Inter-study heterogeneity observed in a meta-analysis indicates variability in results across studies. A threshold effect is the most important cause of heterogeneity. Different sensitivities and specificities due to various study conditions cause different threshold effects. We checked Spearman's correlation coefficient between the logit of sensitivity and the logit of 1-specificity to assess the presence of a threshold effect. To examine the potential sources of heterogeneity observed in the meta-analysis, meta-regression was performed with the following covariates: 1) study quality, 2) sample size, 3) study design, and 4) diagnostic criteria.
The pooled sensitivity and specificity of MSGB were 75.7% (95% CI: 72.0-79.1%) and 90.7% (88.1-92.9%), respectively. The PLR, NLR, and DOR of MSGB were 9.475 (4.051-22.16), 0.266 (0.208-0.340), and 38.92 (19.12-72.21), respectively. The AUC of MSGB was 0.902, and the Q* index was 0.833, indicating a high diagnostic accuracy. A Spearman's rank correlation test showed no evidence of a threshold effect (Spearman's correlation coefficient=0.2674; P=0.488). Meta-regression showed that study quality, sample size, study design, and diagnostic criteria were not significant sources of heterogeneity in the meta-analysis. The meta-analysis of diagnostic tests demonstrates that MSGB has a high diagnostic accuracy and plays an important role in the diagnosis of pSS [18].
CONCLUSION
Diagnosis is a critical component of clinical treatment, and it is therefore necessary for clinicians to understand meta-analysis of diagnostic tests. Meta-analysis is a useful tool for assessing research on diagnostic tests by combining data from multiple studies using statistical techniques, thus increasing the statistical power of the evaluations of diagnostic accuracy in the primary research. Meta-analysis of diagnostic test accuracy provides information that is useful for clinical practice and for the formulation of questions to be tested in future studies.

 XML Download