

 PDF
PDF ePub
ePub Citation
 Print
Print


Abstract
Figures and Tables
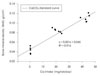
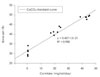 | Fig. 5Relationship between bone ash (%) and Ca intake (mg/rat/day) from calcium standard diets groups.
|
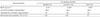
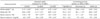
Table 1
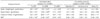
1) Calcium carbonate, reagent grade, was added to the basal diet to provide 0% (Ca 0%), 30% (Ca 0.15%), and 60% (Ca 0.30%) of calcium requirement in AIN-93G diet for young rats.
2) Each calcium source was added to the basal diet to provide 40% of calcium requirement in AIN-93G diet for young rats
3) Reagent grade chemical (Yakuri, Japan)
4) Sampung BnF (oligo-peptide chelated Ca)
5) Commercial dry-anchovy (only bone)
6) Methionine hydroxy analogue Ca (Novos International, Inc., U.S.A)
7) Acid casein (NZMP Ltd., Wellington, New Zealand) contains 92% crude protein. The casein's calcium level is 19 mg/100 g casein.
8) Others include corn starch, 35%; Soybean oil, 7%; cellulose, 5%; sodium chloride, 0.26; AIN-VX Vitamin Mix, Dyets 310025 (Behtlehem, PA), 1%; mineral mix (Ca free), 3.5%; KH2PO4, 0.55%; choline bitarate, 0.2%; DL-Methionine, 0.2%
![]()
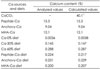
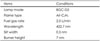
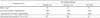
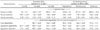
Table 5
![]()
Table 6
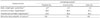
1) Added at 40% of NRC
2) Calculated by feed intake (mg/rat/day) × ratio of calcium content in experimental diet
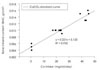
3) Calculated by equation (y = 0.064x + 3.974, R2 = 0.774)
Theoretical Ca intake (mg/rat/day) = {Body weight gain (g/rat/day) - 3.974}/ 0.064
4) Calculated as bioavailability (%) = Theoretical Ca intake/Actual Ca intake × 100
![]()
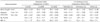
Table 7
![]()
Table 8
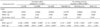
1) Added at 40% of NRC
2) Calculated by feed intake (mg/rat/day) × ratio of calcium content in Actual diet
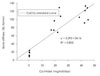
3) Calculated by equation (y = 0.001x + 0.045, R2 = 0.916). Theoretical Ca intake (mg/rat/day) = {BMD (g/cm2) - 0.045}/ 0.001
4) Calculated as bioavailability (%) = Theoretical Ca intake/Actual Ca intake × 100
![]()
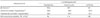
Table 9
1) Added at 40% of NRC
2) Calculated by feed intake (mg/rat/day) × ratio of calcium content in experimental diet
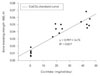
3) Calculated by equation (y = 0.221x + 5.133, R2 = 0.935). Theoretical Ca intake (mg/rat/day) = {BMC (g) - 5.133}/ 0.221
4) Calculated as bioavailability (%) = Theoretical Ca intake/Actual Ca intake × 100
![]()
Table 10
![]()
Table 11
1) Added at 40% of NRC
2) Calculated by feed intake (mg/rat/day) × ratio of calcium content in experimental diet
3) Calculated by equation (y = 2.295x + 24.16, R2 = 0.805). Theoretical Ca intake (mg/rat/day) = {BS (N/mm) - 24.16}/ 2.295
4) Calculated as bioavailability (%)= Theoretical Ca intake/Actual Ca intake × 100
![]()
Table 12

1) Added at 40% of NRC
2) Calculated by feed intake (mg/rat/day) × ratio of calcium content in experimental diet
3) Calculated by equation (y = 0.997x + 14.75, R2 = 0.817). Theoretical Ca intake (mg/rat/day) = {BBS (N) - 14.75}/ 0.997
4) Calculated as bioavailability (%) = Theoretical Ca intake/Actual Ca intake × 100
![]()
Table 13
![]()
Table 14
1) Added at 40% of NRC
2) Calculated by feed intake (mg/rat/day) × ratio of calcium content in experimental diet
3) Calculated by equation (y = 0.427x + 31.21, R2 = 0.980). Theoretical Ca intake (mg/rat/day) = {Bone ash (%) - 31.21}/ 0.427
4) Calculated as bioavailability (%) = Theoretical Ca intake/Actual Ca intake × 100
![]()
Table 15

![]()
Table 16
1) Data are means ± SEM. Means with different superscript letters are significantly different (p < 0.05)
2) True digestibility (%) = (Ca intake - Ca in feces - Ca in feces of Ca 0%)/Ca intake × 100. Apparent digestibility (%)= (Ca intake - Ca in feces)/Ca intake × 100. Apparent retention (%)= (Ca intake - Ca in feces - Ca in urine)/Ca intake × 100
![]()
 XML Download