

 PDF
PDF ePub
ePub Citation
 Print
Print


Abstract
The purpose of the present study was to evaluate the characteristics of nutrient intakes of adults aged 20-64 years in Daegu and Gyeongbuk areas in comparison with Seoul and the whole nation. Data from the 1st (1998) to 3rd (2005) Korean National Health and Nutrition Examination Survey (KNHANES) were used. Total numbers of subjects were 296-369 from Daegu and 307-447 from Gyeongbuk while 1076-1244 from Seoul and 5436-6852 from the whole nation. Average energy intakes (men; 2,386, 2,581, 2,305 Kcal, women; 1,937, 1,981, 1,804 Kcal in 1998, 2001, 2005, respectively) of the subjects from Daegu were higher than those from Gyeongbuk (men; 2309, 2267, 2487 Kcal, women; 1,851, 1,845, 1,901 Kcal) and those from Seoul in 1998 and 2001 but not different from those in 2005. Energy from carbohydrate was consistently higher in the subjects from Daegu and Gyeongbuk than in those from Seoul from 1998 to 2005, when the subjects whose carbohydrate energy was over 70% comprised 34 to 58% of the total in the two regions. In 2005, the average intakes of calcium of women and men from Daegu were 512 and 573 mg, iron, 12.8 and 16.6 mg, sodium, 4,650 and 5,951 mg, potassium, 2,585 and 3,152 mg, vitamin A, 823 and 1,038 µgRE, thiamin, 1.10 and 1.43 mg, riboflavin, 1.08 and 1.33 mg, and niacin. 15.4 and 19.3 mg, and vitamin C, 94 and 105 mg and these intakes were not very different from those from Gyeongbuk except higher sodium intake of the Gyeongbuk subjects. Nutrients of which the intakes were over 50% lower than EAR were calcium and riboflavin and those about 30% lower than EAR were iron in women, vitamins A and C in men and women from Daegu and Gyeongbuk. From the present results, it is concluded that high dependence on carbohydrate as energy source and low calcium intake in adults of Daegu and Gyeongbuk are serious and that low intakes of riboflavin, iron and vitamins A and C need to be improved. But changes in the intakes of total energy and other micronutrients from 1998 to 2005 were not reliable enough to judge the regional nutrition due to large variations during this period. The present study also provides the adults' nutrient intakes separated by sex and age groups in the three regions which could be readily used for setting up the nutrition policy for the adults in the regions.
Figures and Tables
Fig. 1
Energy intakes of the study subjects of Seoul, Daegu and Gyeongbuk by age and sex from 2001 and 2005 KNHANES data. Values are means ± SE and those with different alphabets in the same regional groups are significantly different at p < 0.05 and NS represents no significance among groups.
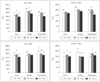
Fig. 2
Percent distribution of the study subjects aged 20-64 years from 2005 KNHANES according to carbohydrate energy catogorized by carbohydrate AMDR, Significance of regional differences by χ2 test; men, p < 0.01, women, p < 0.001.
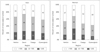
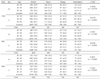
Table 2
Energy intakes of the adults aged 20 to 64 year from the whole nation, Seoul, Daegu and Gyeongbuk
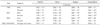
Table 3
Intakes (g) of energy nutrients of the adults aged 20 to 64 year from the whole nation, Seoul, Daegu and Gyeongbuk
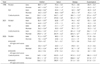
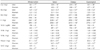
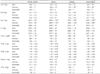
Table 6
Number of the study subjects with their nutrient intakes under EAR1) of 2005 Korean Dietary Reference Intakes (N (%))
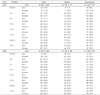
1)EAR for men and women of the each group are used from Korean Dietary Intakes30)
References
1. Park HS, O SU, Kang JH, Park YU, Choe JM, Kim YS, Choe UH, Yu HJ, Kim YS. Prevalence and associated factors with metabolic syndrome in south Korea-From the Korean National Health and Nutrition Examination Ssurvey, 1998-. Korean J Obes. 2003. 12(1):1–14.
2. Moon HK, Park JH. Comparative analysis and evaluation of dietary intake between with and without hypertension using 2001 Korean National Health and Nutrition Examination Survey (KNHANES). Korean J Nutr. 2007. 40(4):347–361.
3. Lee HJ, Lee HS, Lee YN, Jang YA, Moon JJ, Kim CI. Nutritional environment influences hypertension in the middle-aged Korean adults-Based on 1998 & 2001 National Health and Nutrition Examination Survey-. Korean J Community Nutr. 2007. 12(3):272–283.
4. Moon HK, Jeong JY, Kim SY. Analysis of dietary intake of Koreans by dyslipidemia using 2001 Korean National Health and Nutrition Examination Survey data. Korean J Nutr. 2007. 40(5):435–450.
5. Chung CE. Establishment of total sugar reference value for Koreans: Association of total sugar intakes and metabolic syndrome from Korean National Health and Nutrition Examination Survey 2001-2002. Korean J Nutr. 2007. 40(1):29–38.
6. Choi JH, Moon HK. Dietary pattern by sex and age with menu analysis using 1998, 2001 National Health and Nutrition Examination Survey of Korea. Korean J Community Nutr. 2007. 12(6):798–814.
7. Kim KR, Kim SA, Kim MK. Nutritional status and food insufficiency of korean population through the life-course by education level based on 2005 National Health and Nutrition Examination Survey. Korean J Nutr. 2008. 41(7):667–681.
8. Chung SJ, Kang SH, Song SM, Ryu SH, Yoon JH. Nutritional quality of Korean adults' consumption of lunch prepared at home, commercial places, and institutions: Analysis of the data from the 2001 National Health and Nutrition Examination Survey. Korean J Nutr. 2006. 39(8):841–849.
9. Kwon MK, Park YS. A study on nutritional status and eating behaviors of underweight adolescent boys using 2001 NHANES of Korea. Korean J Community Nutr. 2007. 12(3):235–246.
10. Yeoh YJ, Yoon JH, Shim JE, Chung SJ. Factors associated with skipping breakfast in Korean children: Analysis of data from the 2001 National Health and Nutrition Examination Survey. Korean J Community Nutr. 2008. 13(1):62–68.
11. Shim JE, Paik HY, Moon HK. Breakfast consumption pattern, diet quality and health outcomes in adults from 2001 National Health and Nutrition Examination Survey. Korean J Nutr. 2007. 40(5):451–462.
12. Shim JS, Oh KW, Nam CM. Association of household food security with dietary intake-based on the third (2005) Korean National Health and Nutrition Examination Survey (KNHANES 3). Korean J Nutr. 2008. 41(2):174–183.
13. Chung HR. Health intended food use by Korean adults: Data from the Korean National Health and Nutrition Examination Survey 2001. Korean J Nutr. 2006. 12(4):369–377.
14. Chung CE. Ready-to-eat cereal consumption enhances milk and calcium intake in Korean population from 2001 Korean National Health and Nutrition Examination Survey. Korean J Nutr. 2006. 39(8):786–794.
15. Yu KH, Chung CE, Cho SS, Ly SY. Analysis of dietary fiber intake in the Korean adult population using 2001Korean National Health and Nutrition Examination Survey data and newly established dietary fiber database. Korean J Nutr. 2008. 41(1):100–110.
16. Kim BH, Lee JW, Lee YN, Lee HS, Jang YA, Kim CI. Food and nutrient consumption patterns of the Korean adult population by income level-2001 National Health and Nutrition Examination Survey. Korean J Community Nutr. 2005. 10(6):952–962.
17. Song YJ, Joung HJ, Paik HY. Socioeconomic, nutrient, and health risk factors associated with dietary patterns in adult populations from 2001 Korean National Health and Nutrition Examination Survey. Korean J Nutr. 2005. 38(3):219–225.
18. Moon HK, Park JH. Comparative analysis and evaluation of dietary intake between with and without hypertension using 2001 Korean National Health and Nutrition Examination Survey (KNHANES). Korean J Nutr. 2007. 40(4):347–361.
19. Lee JW. A comparative study on the nutritional status of the families with working housewives and with non-working ones: Analysis of 2001 Korean National Health and Nutrition Examination Survey data. Korean J Community Nutr. 2008. 13(5):610–619.
20. Choi JH, Moon HK. Comparison of dietary patterns by sex and urbanization in different economic status. Korean J Community Nutr. 2008. 13(3):346–358.
21. Ministry of Health & Welfare. Report on 1998 National Health and Nutrition Survey. 1999.
22. Ministry of Health & Welfare. Report on 2001 National Health and Nutrition Survey. 2002.
23. Lee JS, Yu CH, Park SH, Han GJ, Lee SS, Moon HK, Paik HY, Shin SY. A study on nutritional intake of the rural people in Korea-comparison of the nutrient intake by area and age. Korean J Nutr. 1998. 31(9):1468–1480.
24. Kwak EH, Lee SL, Yoon JS, Lee HS, Kwon CS, Kwun IS. Macronutrient, mineral and vitamin intake in elderly people in rural area of north Kyungpook province in south Korea. Korean J Nutr. 2003. 36(10):1052–1060.
25. Kim SM, Kim JR. A study of the nutritional iron status of adults in Taegu city. J Korean Soc Food Sci Nutr. 1998. 27(1):191–199.
26. Jung YJ, Choi MJ. Studies of nutrient intake, life style and serum lipids level in middle-aged men in Taegu. Korean J Nutr. 1997. 30(3):277–285.
27. Lee KS, Kim JM. Comparison of nutrients intake, bone density, total cholesterol and blood glucose in women living in Taegu city. J Korean Dietetic Assoc. 2003. 9(1):81–93.
28. Korea Centers for Disease Control and Prevention. The third Korea National Health and Nutrition Examination Survey (KNHANES III). 2005.
29. Choi MJ. Studies of nutrient intake, life style and serum lipids level in adult women in Taegu. Korean J Nutr. 1998. 31(4):777–786.
30. The Korean Nutrition Society. Dietary Refernce Intakes for Koreans. 2005. Seoul:
 XML Download