Abstract
Objective
This study compared the bone thickness of the palate between lateral cephalogram and 3D model measurements.
Methods
The subjects consisted of 30 adults (15 men,15 women) with a normal skeletal pattern and occlusion. The CT images were transformed to a 3D model, and were compared with the cephalometric image. Descriptive statistics for each variable were calculated.
Results
In the 3D CT model, the mid-palatal area was the thickest part. It became thinner as the palate tapered laterally. In the male group, the thinnest portion was positioned 6 mm away from the mid-palate, while in the female group the thinnest portion was 8mm away from the mid-palate. Correlation analysis between the lateral cephalometric and 3D CT model revealed a significant correlation except in the mid palatal area and the area 2 mm lateral to the mid-palate in men, whereas there was a significant relationship in every area in the women. In both men and women, the highest correlation appeared in the area 8 mm lateral to the mid palate.
Go to : 
REFERENCES
1.Kyung SH., Lim JK., Park YC. The use of miniscrew as an anchorage for the orthodontic tooth movement. Korean J Orthod. 2001. 31:415–24.
2.Kanomi R. Mini-implant for orthodontic anchorage. J Clin Orthod. 1997. 31:763–7.
3.Costa A., Raffainl M., Melsen B. Miniscrews as orthodontic anchorage: a preliminary report. Int J Adult Orthodon Orthognath Surg. 1998. 13:201–9.
4.Kyung SH. A study on the bone thickness of midpalatal suture area for miniscrew insertion. Korean J Orthod. 2004. 34:63–70.
5.Lim HJ., Eun CS., Cho JH., Lee KH., Hwang HS. Factors associated with initial stability of miniscrews for orthodontic treatment. Am J Orthod Dentofacial Orthop. 2009. 136:236–42.

6.Park YC., Lee JS., Kim DH. Anatomical characteristics of the midpalatal suture area for miniscrew implantation using CT image. Korean J Orthod. 2005. 35:35–42.
7.Henriksen B., Bavitz B., Kelly B., Harn SD. Evaluation of bone thickness in the anterior hard palate relative to midsagittal orthodontic implants. Int J Oral Maxillofac Implants. 2003. 18:578–81.
8.Wehrbein H., Merz BR., Diedrich P. Palatal bone support for orthodontic implant anchorage--a clinical and radiological study. Eur J Orthod. 1999. 21:65–70.
9.Kim HJ., Yun HS., Park HD., Kim DH., Park YC. Soft-tissue and cortical-bone thickness at orthodontic implant sites. Am J Orthod Dentofacial Orthop. 2006. 130:177–82.

10.Waitzman AA., Posnick JC., Armstrong DC., Pron GE. Craniofacial skeleton measurements based on computed tomography: part I. Accuracy and reproducibility. Cleft Palate Craniofac J. 1992. 29:112–7.
11.Masumoto T., Hayashi I., Kawamura A., Tanaka K., Kasai K. Relationships among facial type, buccolingual molar inclination, and cortical bone thickness of the mandible. Eur J Orthod. 2001. 23:15–23.

12.Kim DH., Lee JW., Cha KS., Chung DH. Consideration of maxillary sinus bone thickness when installing miniscrews. Korean J Orthod. 2009. 39:354–61.

13.Bernhart T., Vollgruber A., Gahleitner A., Dörtbudak O., Haas R. Alternative to the median region of the palate for placement of an orthodontic implant. Clin Oral Implants Res. 2000. 11:595–601.

14.Kang S., Lee SJ., Ahn SJ., Heo MS., Kim TW. Bone thickness of the palate for orthodontic mini-implant anchorage in adults. Am J Orthod Dentofacial Orthop. 2007. 131(4 Suppl):S74–81.

15.Gracco A., Lombardo L., Cozzani M., Siciliani G. Quantitative cone-beam computed tomography evaluation of palatal bone thickness for orthodontic miniscrew placement. Am J Orthod Dentofacial Orthop. 2008. 134:361–9.

16.Baumgaertel S. Quantitative investigation of palatal bone depth and cortical bone thickness for mini-implant placement in adults. Am J Orthod Dentofacial Orthop. 2009. 136:104–8.

17.Park HS., Lee YJ., Jeong SH., Kwon TG. Density of the alveolar and basal bones of the maxilla and the mandible. Am J Orthod Dentofacial Orthop. 2008. 133:30–7.

18.Park YC., Lee SY., Kim DH., Jee SH. Intrusion of posterior teeth using mini-screw implants. Am J Orthod Dentofacial Orthop. 2003. 123:690–4.

19.Kyung SH., Hong SG., Park YC. Distalization of maxillary molars with a midpalatal miniscrew. J Clin Orthod. 2003. 37:22–6.
20.Kim SJ., Lim SH. Anatomic study of the incisive canal in relation to midpalatal placement of mini-implant. Korean J Orthod. 2009. 39:146–58.

21.Wehrbein H., Merz BR., Hämmerle CH., Lang NP. Bone-to-implant contact of orthodontic implants in humans subjected to horizontal loading. Clin Oral Implants Res. 1998. 9:348–53.
22.Motoyoshi M., Inaba M., Ono A., Ueno S., Shimizu N. The effect of cortical bone thickness on the stability of orthodontic mini-implants and on the stress distribution in surrounding bone. Int J Oral Maxillofac Surg. 2009. 38:13–8.

23.Harrell WE. 3D orthodontic diagnosis and treatment planning. In: McNamara JA, Kapila S editors. Craniofacial growth series. Vol 43. Digital radiography and three-dimensional imaging. Ann Arbor: The University of Michigan;2006. p. 147–58.
Go to : 
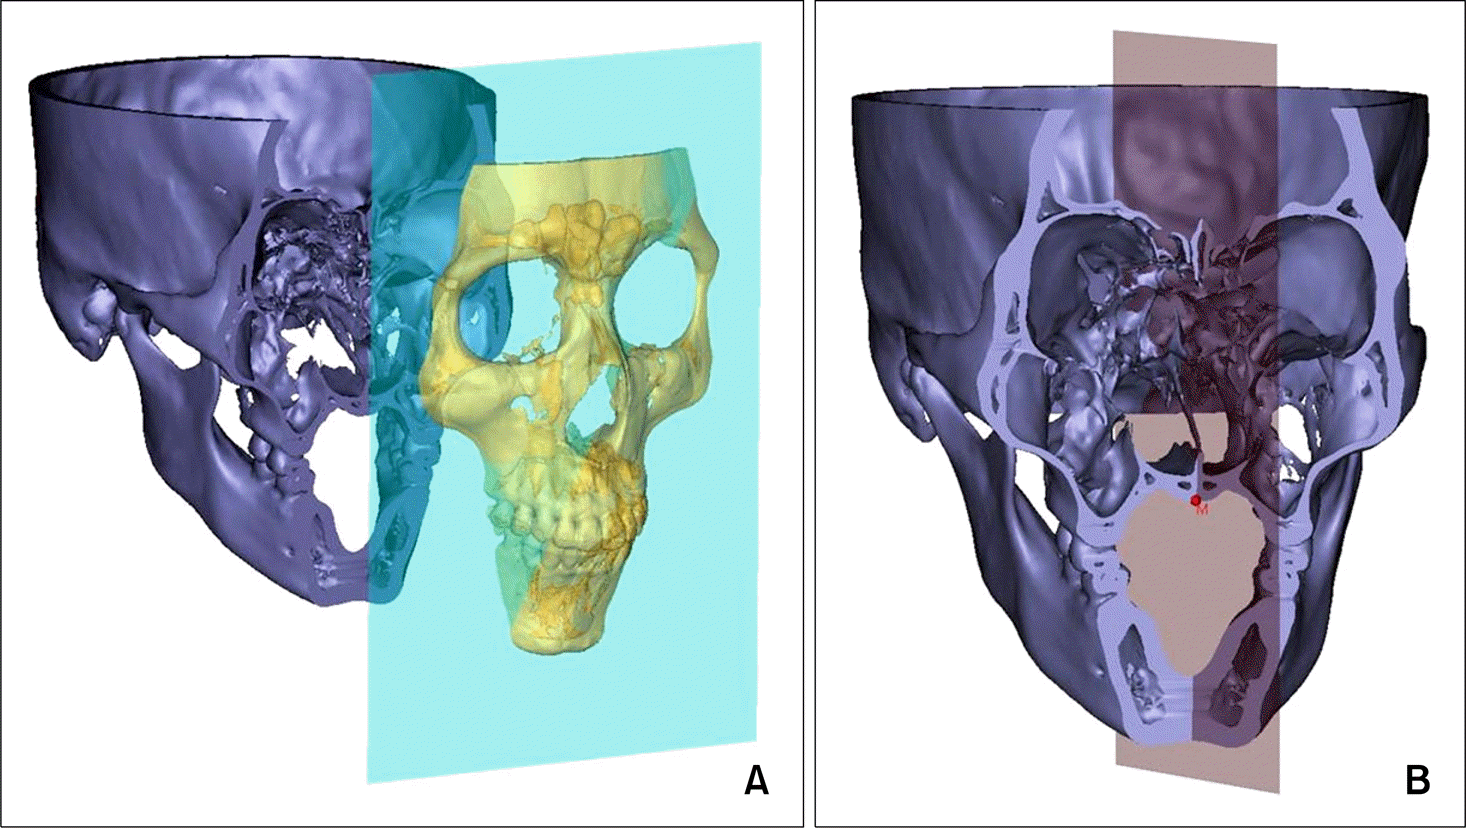
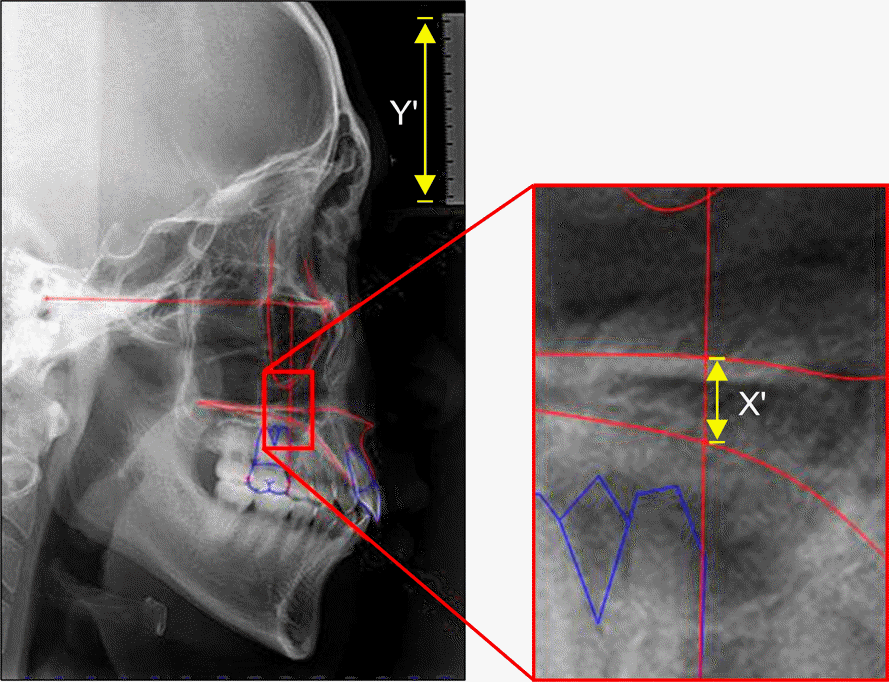 | Fig 2.Reconstruction procedure of 3D model. A, Cutting the 3-D model at the vertical reference plane; B, mid palatal point of 3D model. |
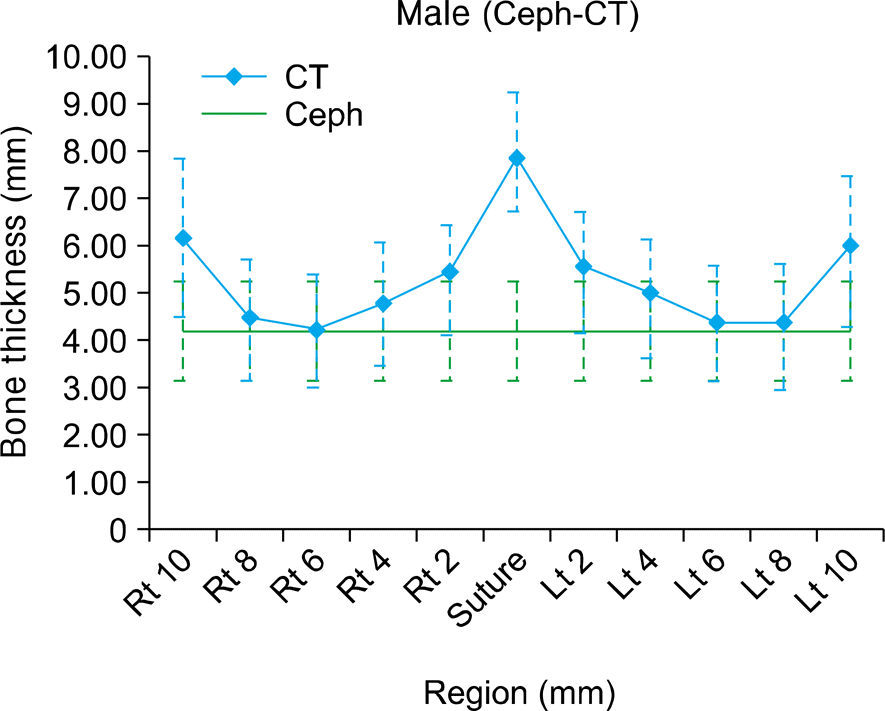 | Fig 5.Mean palatal bone thickness left and right of the suture in the male group. Ceph, Cephalogram; CT, computed tomography; Rt, right; Lt, left. |
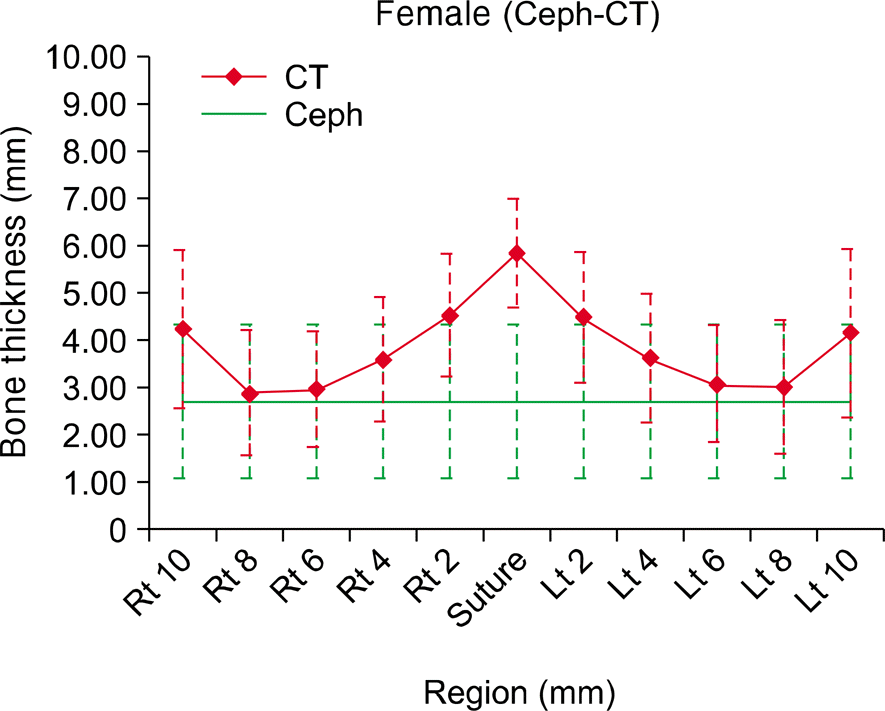 | Fig 6.Mean palatal bone thickness left and right of the suture in the female group. Ceph, Cephalogram; CT, computed tomography; Rt, right; Lt, left. |
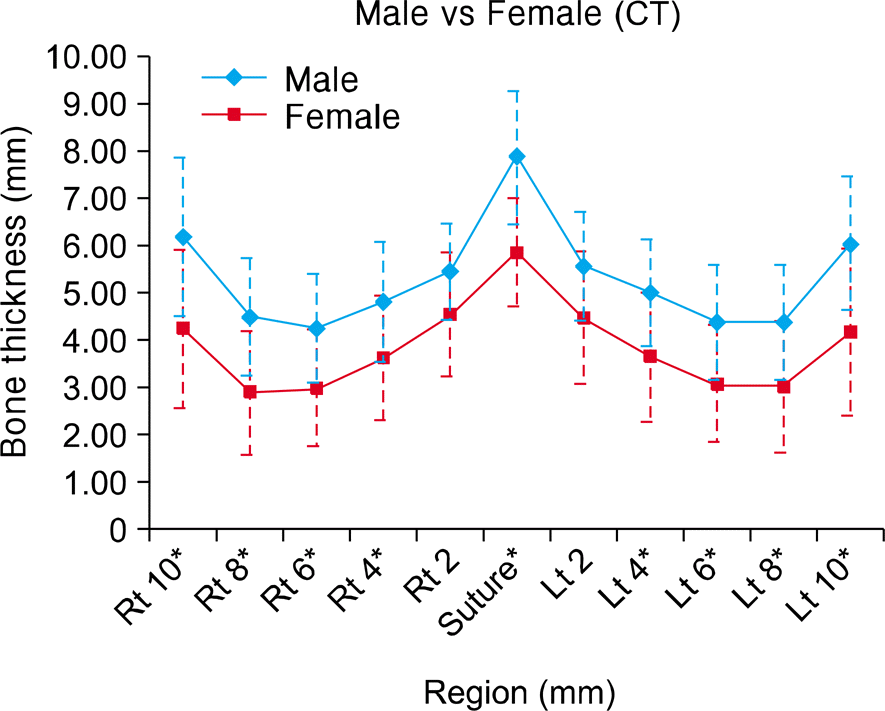 | Fig 7.Comparison of bone thickness between male and female in the 3D model. CT, Computed tomography; Rt, right; Lt, left. *p < 0.05. |
Table 1.
Point registration
Table 2.
Plane registration
Table 3.
Descriptive statistics of bone thickness
Table 4.
Bone thickness correlation analysis between lateral cephalogram and 3D model
| Gender | Rt. | Rt. | Rt. | Rt. | Rt. | M | Lt. | Lt. | Lt. | Lt. | Lt. | |
|---|---|---|---|---|---|---|---|---|---|---|---|---|
| 10 mm | 8 mm | 6 mm | 4 mm | 2 mm | 2 mm | 4 mm | 6 mm | 8 mm | 10 mm | |||
| Male | R | 0.848 | 0.903 | 0.879 | 0.679 | 0.296 | 0.540 | 0.441 | 0.718 | 0.847 | 0.869 | 0.782 |
| p—value | † | † | † | * | - | - | - | * | † | † | † | |
| Female | R | 0.832 | 0.927 | 0.917 | 0.846 | 0.806 | 0.765 | 0.671 | 0.840 | 0.885 | 0.941 | 0.884 |
| p—value | † | † | † | † | † | † | * | † | † | † | † |
Table 5.
Bone thickness regression analysis between lateral cephalogram and 3D model


 PDF
PDF ePub
ePub Citation
 Print
Print


 XML Download