

 PDF
PDF ePub
ePub Citation
 Print
Print


Abstract
Objective
Obstructive sleep apnea (OSA) is a common disorder which is characterized by a recurrence of entire or partial collapse of the pharyngeal airway during sleep. A given tidal volume must traverse the soft tissue tube structure of the upper airway, so the tendency for airway obstruction is influenced by the geometries of the duct and characteristics of the airflow in respect to fluid dynamics.
Methods
Individualized 3D FEA models were reconstructed from pretreatment computerized tomogram images of three patients with obstructive sleep apnea. 3D computational fluid dynamics analysis was used to observe the effect of airway geometry on the flow velocity, negative pressure and pressure drop in the upper airway at an inspiration flow rate of 170, 200, and 230 ml/s per nostril.
Results
In all 3 models, large airflow velocity and negative pressure were observed around the section of minimum area (SMA), the region which narrows around the velopharynx and oropharynx. The bigger the Out-A (outlet area)/ SMA-A (SMA area) ratio, the greater was the change in airflow velocity and negative pressure.
Figures and Tables
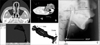 | Fig. 1Construction of 3D upper airway. A, Segmentation of the air region. The black color in the dotted box shows the nasal cavity; B, 3D surface model. 3D surface model of the upper airway constructed from the segmented images using Bionix body builder software. Smoothing was performed two times with the built-in options of Laplacian and boundary-edge smoothing algorithms for the most optimal model; C, AWL (airway length) measurements were done on the lateral cephalogram. Palatal plane (PP), tip of the uvular (TU), tip of the epiglottis (TE), upper esophageal sphincter (UES), upper esophageal sphincter plane (UESP); D, 3D model generation. The inside of the 3D surface model was meshed into the tetrahedron element; E, the inlet (nostril) and outlet (on the UESP) regions were assigned respectively.
|
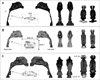 | Fig. 2Morphological characteristics of upper airway models for 3 subjects. Section of minimum area (SMA) is indicated by the dotted line in the right side of the model. A, Model A; B, model B; C, model C. The shapes of the SMA were compared by a 5 mm unit mesh diagram. The left (L), right (R), ventral (V), dorsal (D), inferior and superior views were compared. SMA, The area of the section of minimum area; SMA-W, the lateral width of the SMA; SMA-T, the anterior-posterior thickness of the SMA; In-A, the cross-sectional area of left and right nostrils; Out-A, the area of hypopharynx in the model.
|
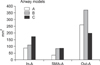 | Fig. 3Comparison of the area measurements of upper airway models. In-A, Cross-sectional area of the left and right nostrils; SMA-A, the area of the section of minimum area; Out-A, the area of hypopharynx in the model.
|
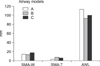 | Fig. 4Comparison of the linear measurements of upper airway models. SMA-W, The lateral width of the SMA (section of minimum area); SMA-T, the anterior-posterior thickness of the SMA; AWL, the length of upper airway.
|
 | Fig. 5Comparison of the changes of the airflow velocity at the flow rate of 200 ml/s. A, Maximum velocity was observed at the SMA (section of minimum area) region. More airjet regions were observed; B, maximum velocity was observed near the tip of the epiglottis, but the maximum velocity magnitude was lower than those in model A; C, maximum airflow velocity was observed at the narrowest portions at the SMA.
|
 | Fig. 6Axes and negative pressure patterns of model A, B, and C at the flow rate of 200 ml/s. A, Negative pressure increases at the collapsed regions. The maximum negative pressure occurs at the narrowest region below the SMA (section of minimum area) region; B, the maximum negative pressure occurs at the epiglottis region; C, the maximum negative pressure were observed at the SMA which is narrowest region and the epiglottis tip region.
|
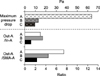 | Fig. 7Comparison of the cross sectional area ratio and pressure drop of upper airway models. SMA-A, The area of the section of minimum area; In-A, the cross-sectional area of left and right nostrils; Out-A, the area of hypopharynx in the model.
|
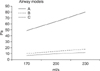 | Fig. 8Changes of the maximum pressure drop by the air flow rate. In all models, maximum pressure drop (differences between the highest pressure in the inlet region and the lowest pressure in the section of minimum area region) increased as the air flow rate increased, and the largest pressure drop occurred in model A.
|

Table 2
Morphological characteristics of upper airway models for 3 subjects

SMA-W, Lateral width of the section of minimum area; SMA-T, anterior-posterior thickness of the section of minimum area; AWL, length of airway; In-A (inlet area), sum of the cross-sectional area of left and right nostrils; SMA-A (SMA area), area of the section of minimum area; Out-A (outlet area), cross-sectional area of hypopharynx in the model.
![]()
References
1. Wynne JW, Block AJ, Hemenway J, Hunt LA, Flick MR. Disodered breathing and oxygen desaturation during sleep in patients with chronic obstructive lung disease (COLD). Am J Med. 1979. 66:573–579.

2. Young T, Palta M, Dempsey J, Skatrud J, Weber S, Badr S. The occurrence of sleep-disordered breathing among middle-aged adults. N Engl J Med. 1993. 328:1230–1235.
3. Remmers JE, deGroot WJ, Sauerland EK, Anch AM. Pathogenesis of upper airway occlusion during sleep. J Appl Phsiol. 1978. 44:931–938.
4. Sung SJ. Oral appliances. J Clin Otolaryngol. 2008. 19:160–167.
5. Hwang SH, Park IS, Nam KY, Kim JB, Cho YW, Suh YS, et al. Cephalometric differences in obstructive sleep apnea between obese and non-obese Korean male patients. Korean J Orthod. 2008. 38:202–213.
6. Shepard JW Jr, Thawley SE. Evaluation of the upper airway by computerized tomography in patients undergoing uvulopalatopharyngoplasty for obstructive sleep apnea. Am Rev Respir Dis. 1989. 140:711–716.
7. Schwab RJ. Pro: sleep apnea is an anatomic disorder. Am J Respir Crit Care Med. 2003. 168:270–271.
8. Strohl KP. Con: sleep apnea is an anatomic disorder. Am J Respir Crit Care Med. 2003. 168:271–272.
9. Fogel RB, Malhotra A, White DP. Sleep 2: pathophysiology of obstructive sleep apnea/hypopnea syndrome. Thorax. 2004. 59:159–163.
10. Hahn I, Scherer PW, Mozell MM. Velocity profiles measured for airflow through a large-scale model of human nasal cavity. J Appl Phsiol. 1993. 75:2273–2287.
11. Schreck S, Sullivan KJ, Ho CM, Chang HK. Correlations between flow resistance and geometry in a model of the human nose. J Appl Phsiol. 1993. 75:1767–1775.
12. Stapleton KW, Guentsch E, Hoskinson MK, Finlay WH. On the suitability of κ-εturbulence modeling for aerosol deposition in the mouth and throat: a comparison with experiment. J Aerosol Sci. 2000. 31:739–749.
13. Sung SJ, Jeong SJ, Yu YS, Hwang CJ, Pae EK. Customized three-dimensional computational fluid dynamics simulation of the upper airway of obstructive sleep apnea. Angle Orthod. 2006. 76:791–799.
14. Tso HH, Lee JS, Huang JC, Maki K, Hatcher D, Miller AJ. Evaluation of the human airway using cone-beam computerized tomography. Oral Surg Oral Med Oral Pathol Oral Radiol Endod. 2009. 108:768–776.
15. Davidson TM. The Great Leap Forward: the anatomic basis for the acquisition of speech and obstructive sleep apnea. Sleep Med. 2003. 4:185–194.
16. O'Cornnor C, Thornley KS, Hanly PJ. Gender differences in the polysomnographic features of obstructive sleep apnea. Am J Respir Crit Care Med. 2000. 161:1465–1472.
17. Katsantonis GP, Moss K, Miyazaki S, Walsh J. Determining the site of airway collapse in obstructive sleep apnea with airway pressure monitoring. Laryngoscope. 1993. 103:1126–1131.
18. Schwab RJ, Gefter WB, Hoffman EA, Gupta KB, Pack AI. Dynamic upper airway imaging during awake respiration in normal subjects and patients with sleep disordered breathing. Am Rev Respir Dis. 1993. 148:1385–1400.
19. Gleeson K, Zwillich CW, White DP. The influence of increasing ventilatory effort on arousal from sleep. Am Rev Respir Dis. 1990. 142:295–300.
20. Jeong SJ, Kim WS, Sung SJ. Numerical investigation on the flow characteristics and aerodynamic force of the upper airway of patient with obstructive sleep apnea using computational fluid dynamics. Med Eng Phys. 2007. 29:637–651.
21. Schlosser RJ, Park SS. Functional nasal surgery. Otolaryngol Clin North Am. 1999. 32:37–51.
22. Pae EK, Lowe AA, Fleetham JA. A role of pharyngeal length in obstructive sleep apnea patients. Am J Ortho Dentofacial Orthop. 1997. 111:12–17.
23. Malhotra A, Huang Y, Fogel RB, Pillar G, Edwards JK, Kikinis R, et al. The male predisposition to pharyngeal collapse: importance of airway length. Am J Respir Crit Care Med. 2002. 166:1388–1395.
24. Polo OJ, Tafti M, Fraga J, Porkka KV, Déjean Y, Billiard M. Why don't all heavy snorers have obstructive sleep apnea? Am Rev Respir Dis. 1991. 143:1288–1293.
25. Olson DE, Dart GA, Filley GF. Pressure drop and fluid flow regime of air inspired into the human lung. J Appl Physiol. 1970. 28:482–494.
26. Weinhold I, Mlynski G. Numerical simulation of airflow in the human nose. Eur Arch Otorhinolaryngol. 2004. 261:452–455.
27. Lauralee S. Fundamentals of physiology: a human perspective. 2005. London: Thomson Brooks/Col;372.
28. Park JW, Kim NK, Chang YI. Formulation of a reference coordinate system of three dimensional head and neck images: Part II. Reproducibitity of the horizontal reference plane and midsagittal plane. Korean J Orthod. 2005. 35:475–484.
29. Kim YI, Kim SS, Son WS, Park SB. Pharyngeal airway analysis of different craniofacial morphology using cone-beam computed tomography (CBCT). Korean J Orthod. 2009. 39:136–145.
 XML Download