Abstract
Objective
The aim of this study was to evaluate the effects of vitamin E (α-tocopherol) administration on bone formation in response to expansion of the inter-premaxillary suture, in rats, histomorphometrically.
Methods
Thirty 50 - 60 day old Wistar rats were separated into five equal groups (one control and four experimental). All groups were subjected to inter-premaxilla expansion with 50-gram of force. Six control animals received saline solution (Group I) and three experimental groups were treated with a single dose of α-tocopherol injected into the inter-premaxillary suture after one day after appliance placement (Group II: 2 mg/kg; Group III: 10 mg/kg; and Group IV: 50 mg/kg). A further group of six animals received three injections of 10 mg/kg α-tocopherol, one each on days 3, 6, and 9 (Group V). Bone formation in the suture was evaluated by bone histomorphometry. Kruskal-Wallis rank and Mann-Whitney U tests were used for statistical evaluation at p < 0.05 level.
Results
New bone area, bone perimeter, feret’s diameter and newly formed bone measurements were significantly higher in the experimental groups than the control (p < 0.001). Bone architecture in α-tocopherol administrated groups was improved, and bone formation during the expansion period was stimulated significantly, in a dose-dependent manner.
Go to : 
REFERENCES
1.Saito S., Shimizu N. Stimulatory effects of low-power laser irradiation on bone regeneration in midpalatal suture during expansion in the rat. Am J Orthod Dentofacial Orthop. 1997. 111:525–32.

2.Sawada M., Shimizu N. Stimulation of bone formation in the expanding mid-palatal suture by transforming growth factor-β1 in the rat. Eur J Orthod. 1996. 18:169–79.

3.Uysal T., Ustdal A., Sonmez MF., Ozturk F. Stimulation of bone formation by dietary boron in an orthopedically expanded suture in rabbits. Angle Orthod. 2009. 79:984–90.

4.Uysal T., Amasyali M., Enhos S., Sonmez MF., Sagdic D. Effect of ED-71, a new active vitamin D analog, on bone formation in an orthopedically expanded suture in rats. a histomorphometric study. Eur J Dent. 2009. 3:165–72.

5.Ten Cate AR., Freeman E., Dickinson JB. Sutural development: structure and its response to rapid expansion. Am J Orthod. 1977. 71:622–36.

6.Mundy GR. Cytokines and growth factors in the regulation of bone remodeling. J Bone Min Res. 1993. 8:S505–10.

7.Key LL., Ries WL., Taylor RG., Hays BD., Pitzer BL. Oxygen derived free radicals in osteoclasts: the specificity and location of the nitroblue tetrazolium reaction. Bone. 1990. 11:115–9.

8.Göktürk E., Turgut A., Bayçu C., Günal I., Seber S., Gülbas Z. Oxygen-free radicals impair fracture healing in rats. Acta Orthop Scand. 1995. 66:473–5.

9.Turk C., Halici M., Guney A., Akgun H., Sahin V., Muhtaroglu S. Promotion of fracture healing by vitamin E in rats. J Int Med Res. 2004. 32:507–12.

10.Durak K., Sonmez G., Sarisozen B., Ozkan S., Kaya M., Ozturk C. Histological assessment of the effect of alpha-tocopherol on fracture healing in rabbits. J Int Med Res. 2003. 31:26–30.
11.Durak K., Bilgen OF., Kaleli T., Tuncel P., Ozbek R., Turan K. Antioxidant effect of alpha-tocopherol on fracture haematoma in rabbits. J Int Med Res. 1996. 24:419–24.
12.Yilmaz C., Erdemli E., Selek H., Kinik H., Arikan M., Erdemli B. The contribution of vitamin C to healing of experimental fractures. Arch Orthop Trauma Surg. 2001. 121:426–8.

13.Burton GW., Ingold KU. Vitamin E as an in vitro and in vivo antioxidant. Ann N Y Acad Sci. 1989. 570:7–22.

14.Burton GW., Traber MG. Vitamin E: antioxidant activity, biokinetics, and bioavailability. Annu Rev Nutr. 1990. 10:357–82.

15.van Tits LJ., Demacker PN., de Graaf J., Hak-Lemmers HL., Stalenhoef AF. Alpha-tocopherol supplementation decreases production of superoxide and cytokines by leukocytes ex vivo in both normolipidemic and hypertriglyceridemic individuals. Am J Clin Nutr. 2000. 71:458–64.
16.Manolagas SC., Jilka RL. Bone marrow, cytokines, and bone remodeling. Emerging insights into the pathophysiology of osteoporosis. N Engl J Med. 1995. 332:305–11.
17.Turan B., Can B., Delilbasi E. Selenium combined with vitamin E and vitamin C restores structural alterations of bones in heparin-induced osteoporosis. Clin Rheumatol. 2003. 22:432–6.

18.Turan B., Balcik C., Akkas N. Effect of dietary selenium and vitamin E on the biomechanical properties of rabbit bones. Clin Rheumatol. 1997. 16:441–9.

19.Rasband WS. Image-J. U.S. National Institutes of Health, Bethesda, Maryland, USA. http://rsb.info.nih.gov/ij/,1997-2008.
20.Graber TM., Vanarsdall RL., Vig KWL. Orthodontics: current principles and techniques. 4th ed.St. Louis: Elsevier Mosby;2005. p. 257–62.
21.Haas AJ. The treatment of maxillary deficiency by opening the midpalatal suture. Angle Orthod. 1965. 35:200–17.
22.Arjmandi BH., Juma S., Beharka A., Bapna MS., Akhter M., Meydani SN. Vitamin E improves bone quality in the aged but not in young adult male mice. J Nutr Biochem. 2002. 13:543–9.

23.Arjmandi BH., Akhter MP., Chakkalakal D., Khalil DA., Lucas EA., Juma S, et al. Effects of isoflavones, vitamin E, and their combination on bone in an aged rat model of osteopenia. J Bone Min Res. 2001. 16:S533.
24.Swennen G., Dempf R., Schliephake H. Cranio-facial distraction osteogenesis: a review of the literature. Part II: experimental studies. Int J Oral Maxillofac Surg. 2002. 31:123–35.

26.Hagiwara T., Bell WH. Effect of electrical stimulation on mandibular distraction osteogenesis. J Craniomaxillofac Surg. 2000. 28:12–9.

27.Eriksen EF., Axelrod DW., Melson F. Bone histology and histomorphometry. In: Bone histomorphometry. New York: Raven Press;1994. p. 33–8.
28.Burstone CJ., Shafer WG. Sutural expansion by controlled mechanical stress in the rat. J Dent Res. 1959. 38:534–40.

29.Cope JB., Samchukov ML. Mineralization dynamics of regenerate bone during mandibular osteodistraction. Int J Oral Maxillofac Surg. 2001. 30:234–42.

Go to : 
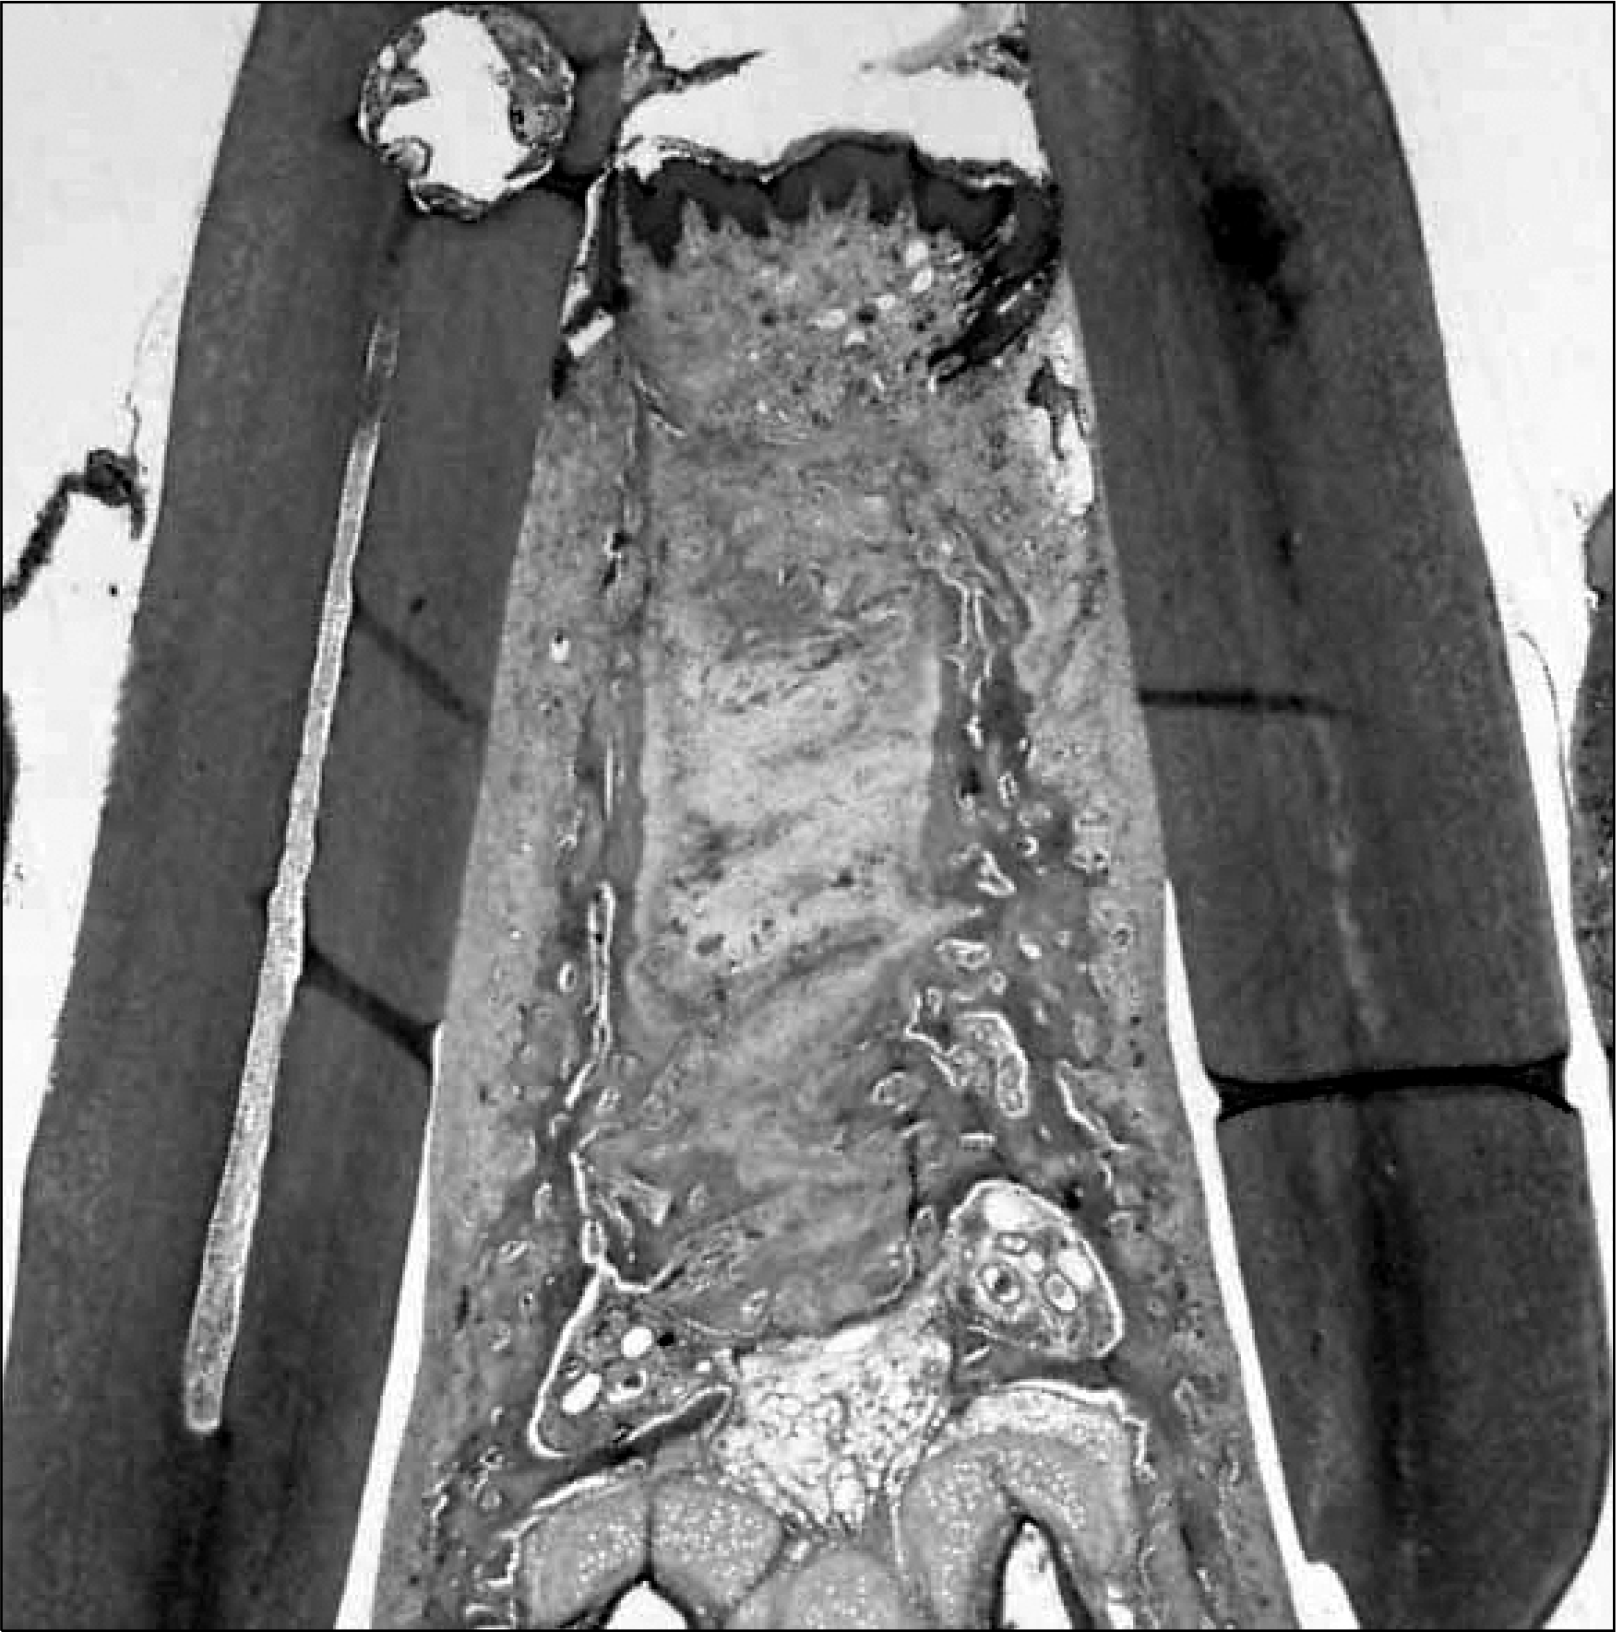
 | Fig 3.Haematoxylin-eosin (HE) staining of the histological sections prior to optical-microscope examination (× 40 magnification). |
 | Fig 4.Histomorphometric measurements of newly formed bone area (μm2). Left, Image enhancement and outlining of the area of interest, which is newly formed bone. Histomorphometric measurements of newly formed bone (percentage): Right, marking the intersections of the grid just over the newly formed bone and non-osseous connective tissue by mouse-clicking. At the end of this macro, the program gives a percent indicating the ratio of bone to the connective tissue. |
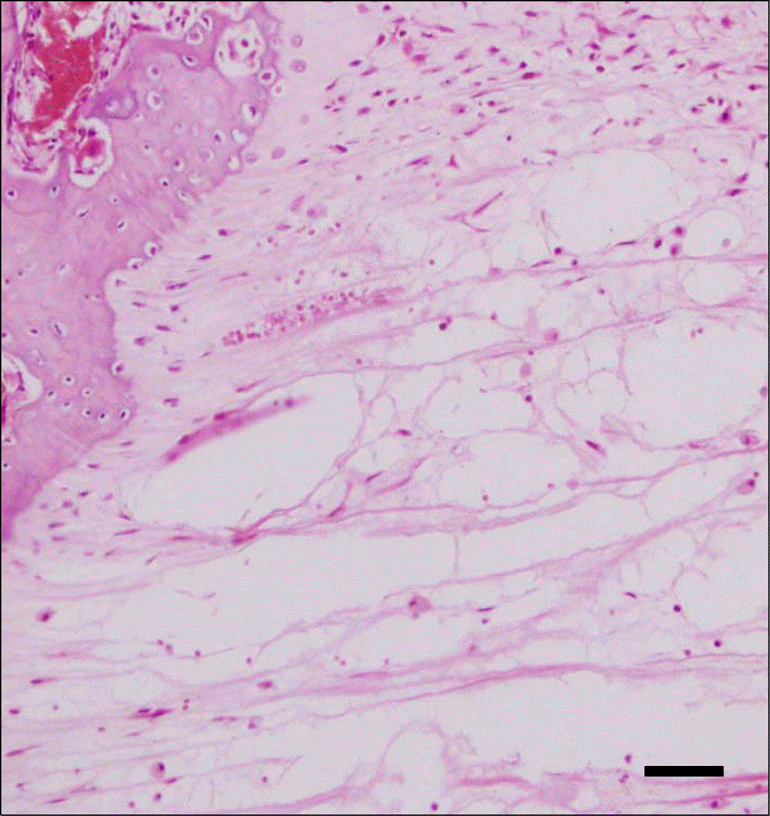
 | Fig 5.Photomicrograph of a section in the expansion area of the control group showing that it appears to be occupied by fibrous tissue, but not the trabecular bone. Large connective tissues indicates beginning stages of bone formation (HE 200 × magnification) (bar = 30μm). |
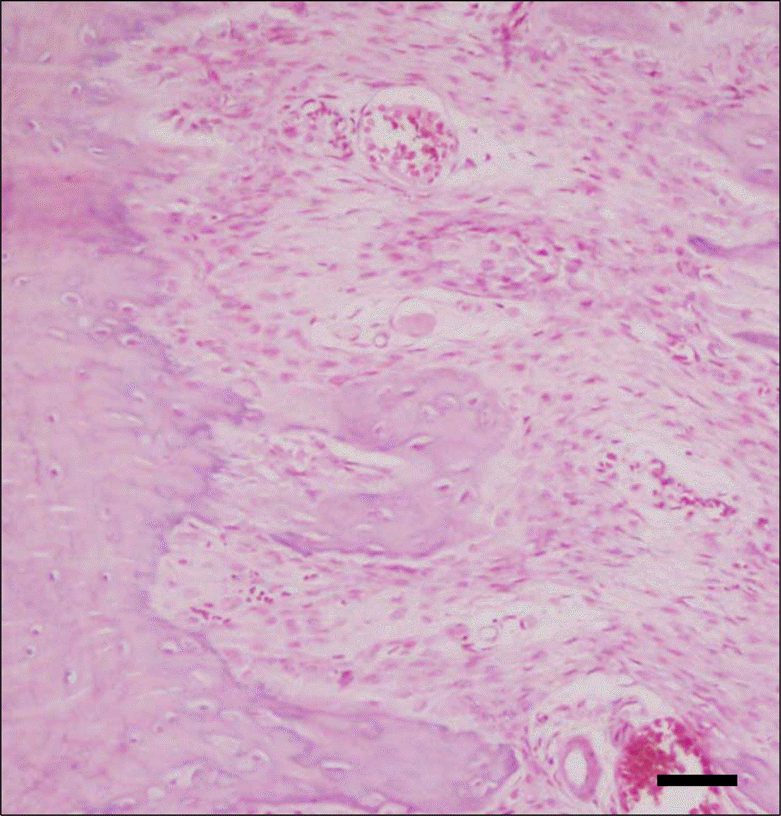
 | Fig 6.Photomicrograph of a section in the expansion area of the experimental group (Group IV) showing larger masses of new bone trabeculae. New bone became attached to old bone at the site of expansion. Large amounts of new bone forming area indicates later stages of bone formation (HE 200 × magnification) (bar = 30μm). |
Table 1.
Body weight changes (kg) between groups during expansion and retention periods
Table 2.
The amount of expansion of each group and biometric analysis (unit: μm)
Table 3.
Descriptive values, Kruskal Wallis and Mann-Whitney U results of histomorphometric measurements (unit: μm)


 PDF
PDF ePub
ePub Citation
 Print
Print


 XML Download