Journal List > J Korean Foot Ankle Soc > v.21(4) > 1043427

Suh and Park: Clinical Significance of Lateral Ankle Radiograph after the Reduction of a Syndesmosis Injury

Abstract

Purpose:

To introduce reliable and newly developed radiographic measures based on a lateral ankle radiograph to assess a syndesmotic reduction after screw fixation and to compare with the radiographic measures based on the anteroposterior (AP) and mortise radiographs.

Materials and Methods:

The postoperative ankle radiographs of 34 ankle fracture cases after screw fixation for concurrent syndesmosis injury were reviewed. Two radiographic parameters were measured on each AP and mortise radiograph; tibiofibular clear space (TFCS) and tibiofibular overlap (TFO). Five radiographic parameters were measured on the true lateral radiographs; the anteroposterior tibiofibular (APTF) ratio, anterior tibiofibular ratio (ATFR), posterior tibiofibular ratio (PTFR), distances of intersection of the anterior fibular border and the tibial plafond to anterior cortex of the tibia (AA’), and the intersection of posterior fibular border and tibial plafond to the tip of the posterior malleolus (BB’). In addition, the distance (XP) between the fibular posterior margin (X) crossing tibial plafond or the posterior malleolus and posterior articular margin (P) of the tibial plafond was measured on the lateral view.

Results:

Using TFCS and TFO in the AP and mortise radiographs, malreductions of syndesmosis were estimated in 17 of 34 cases (50.0%). Using the introduced and developed radiographic measures in the lateral radiographs, syndesmotic malreductions were estimated in 16 out of 34 cases (47.1%). Seventeen cases (50.0%) showed no evidence of postoperative diastasis using the radiographic criteria on the AP and mortise view, 10 cases (58.8%) of whom showed evidence of a malreduction on the lateral radiograph. The newly developed measurements, XP, were measured 0 in 11 out of 34 cases (32.4%).

Conclusion:

The reduction of syndemosis after screw fixation can be accurately assessed intraoperatively with a combination of several reliable radiographic measurements of the lateral radiograph and traditional radiographic measurements of the AP and mortise radiograph.

REFERENCES

11.Summers HD., Sinclair MK., Stover MD. A reliable method for intraoperative evaluation of syndesmotic reduction1 J Orthop Trauma1. 2013. 27:196–2001.
21.Leeds HC., Ehrlich MG. Instability of the distal tibiofibular syndesmosis after bimalleolar and trimalleolar ankle fractures1 J Bone Joint Surg Am1. 1984. 66:490–5031.
31.Weening B., Bhandari M. Predictors of functional outcome following transsyndesmotic screw fixation of ankle fractures1 J Orthop Trauma1. 2005. 19:102–81.
41.Sagi HC., Shah AR., Sanders RW. The functional consequence of syndesmotic joint malreduction at a minimum 2-year follow-up1 J Orthop Trauma1. 2012. 26:439–431.
51.Gardner MJ., Demetrakopoulos D., Briggs SM., Helfet DL., Lorich DG. Malreduction of the tibiofibular syndesmosis in ankle fractures1 Foot Ankle Int1. 2006. 27:788–921.
61.Nielson JH., Gardner MJ., Peterson MG., Sallis JG., Potter HG., Helfet DL, et al. Radiographic measurements do not predict syndesmotic injury in ankle fractures: an MRI study1 Clin Orthop Relat Res1. 2005. 436:216–211.
71.Grenier S., Benoit B., Rouleau DM., Leduc S., Laflamme GY., Liew A. APTF: anteroposterior tibiofibular ratio, a new reliable measure to assess syndesmotic reduction1 J Orthop Trauma1. 2013. 27:207–111.
81.Croft S., Furey A., Stone C., Moores C., Wilson R. Radiographic evaluation of the ankle syndesmosis1 Can J Surg1. 2015. 58:58–621.
91.Dikos GD., Heisler J., Choplin RH., Weber TG. Normal tibiofibular relationships at the syndesmosis on axial CT imaging1 J Orthop Trauma1. 2012. 26:433–81.
101.Franke J., von Recum J., Suda AJ., Grützner PA., Wendl K. Intraoperative three-dimensional imaging in the treatment of acute unstable syndesmotic injuries1 J Bone Joint Surg Am1. 2012. 94:1386–901.
111.Shah AS., Kadakia AR., Tan GJ., Karadsheh MS., Wolter TD., Sabb B. Radiographic evaluation of the normal distal tibiofibular syndes-mosis1 Foot Ankle Int1. 2012. 33:870–61.
121.Vopat ML., Vopat BG., Lubberts B., DiGiovanni CW. Current trends in the diagnosis and management of syndesmotic injury1 Curr Rev Musculoskelet Med1. 2017. 10:94–1031.
131.Jones CB., Gilde A., Sietsema DL. Treatment of syndesmotic injuries of the ankle: a critical analysis review1 JBJS Rev1. 2015. 31:DOI: doi: 1012106/JBJS1RVW1N1000831.
141.Harper MC., Keller TS. A radiographic evaluation of the tibiofibular syndesmosis1 Foot Ankle1. 1989. 10:156–601.
151.Marmor M., Hansen E., Han HK., Buckley J., Matityahu A. Limitations of standard fluoroscopy in detecting rotational malreduction of the syndesmosis in an ankle fracture model1 Foot Ankle Int1. 2011. 32:616–221.
161.Loizou CL., Sudlow A., Collins R., Loveday D., Smith G. Radiological assessment of ankle syndesmotic reduction1 Foot (Edinb)1. 2017. 32:39–431.
171.Song DJ., Lanzi JT., Groth AT., Drake M., Orchowski JR., Shaha SH, et al. The effect of syndesmosis screw removal on the reduction of the distal tibiofibular joint: a prospective radiographic study1 Foot Ankle Int1. 2014. 35:543–81.
181.Beumer A., van Hemert WL., Niesing R., Entius CA., Ginai AZ., Mulder PG, et al. Radiographic measurement of the distal tibiofibular syndesmosis has limited use1 Clin Orthop Relat Res1. 2004. 423:227–341.
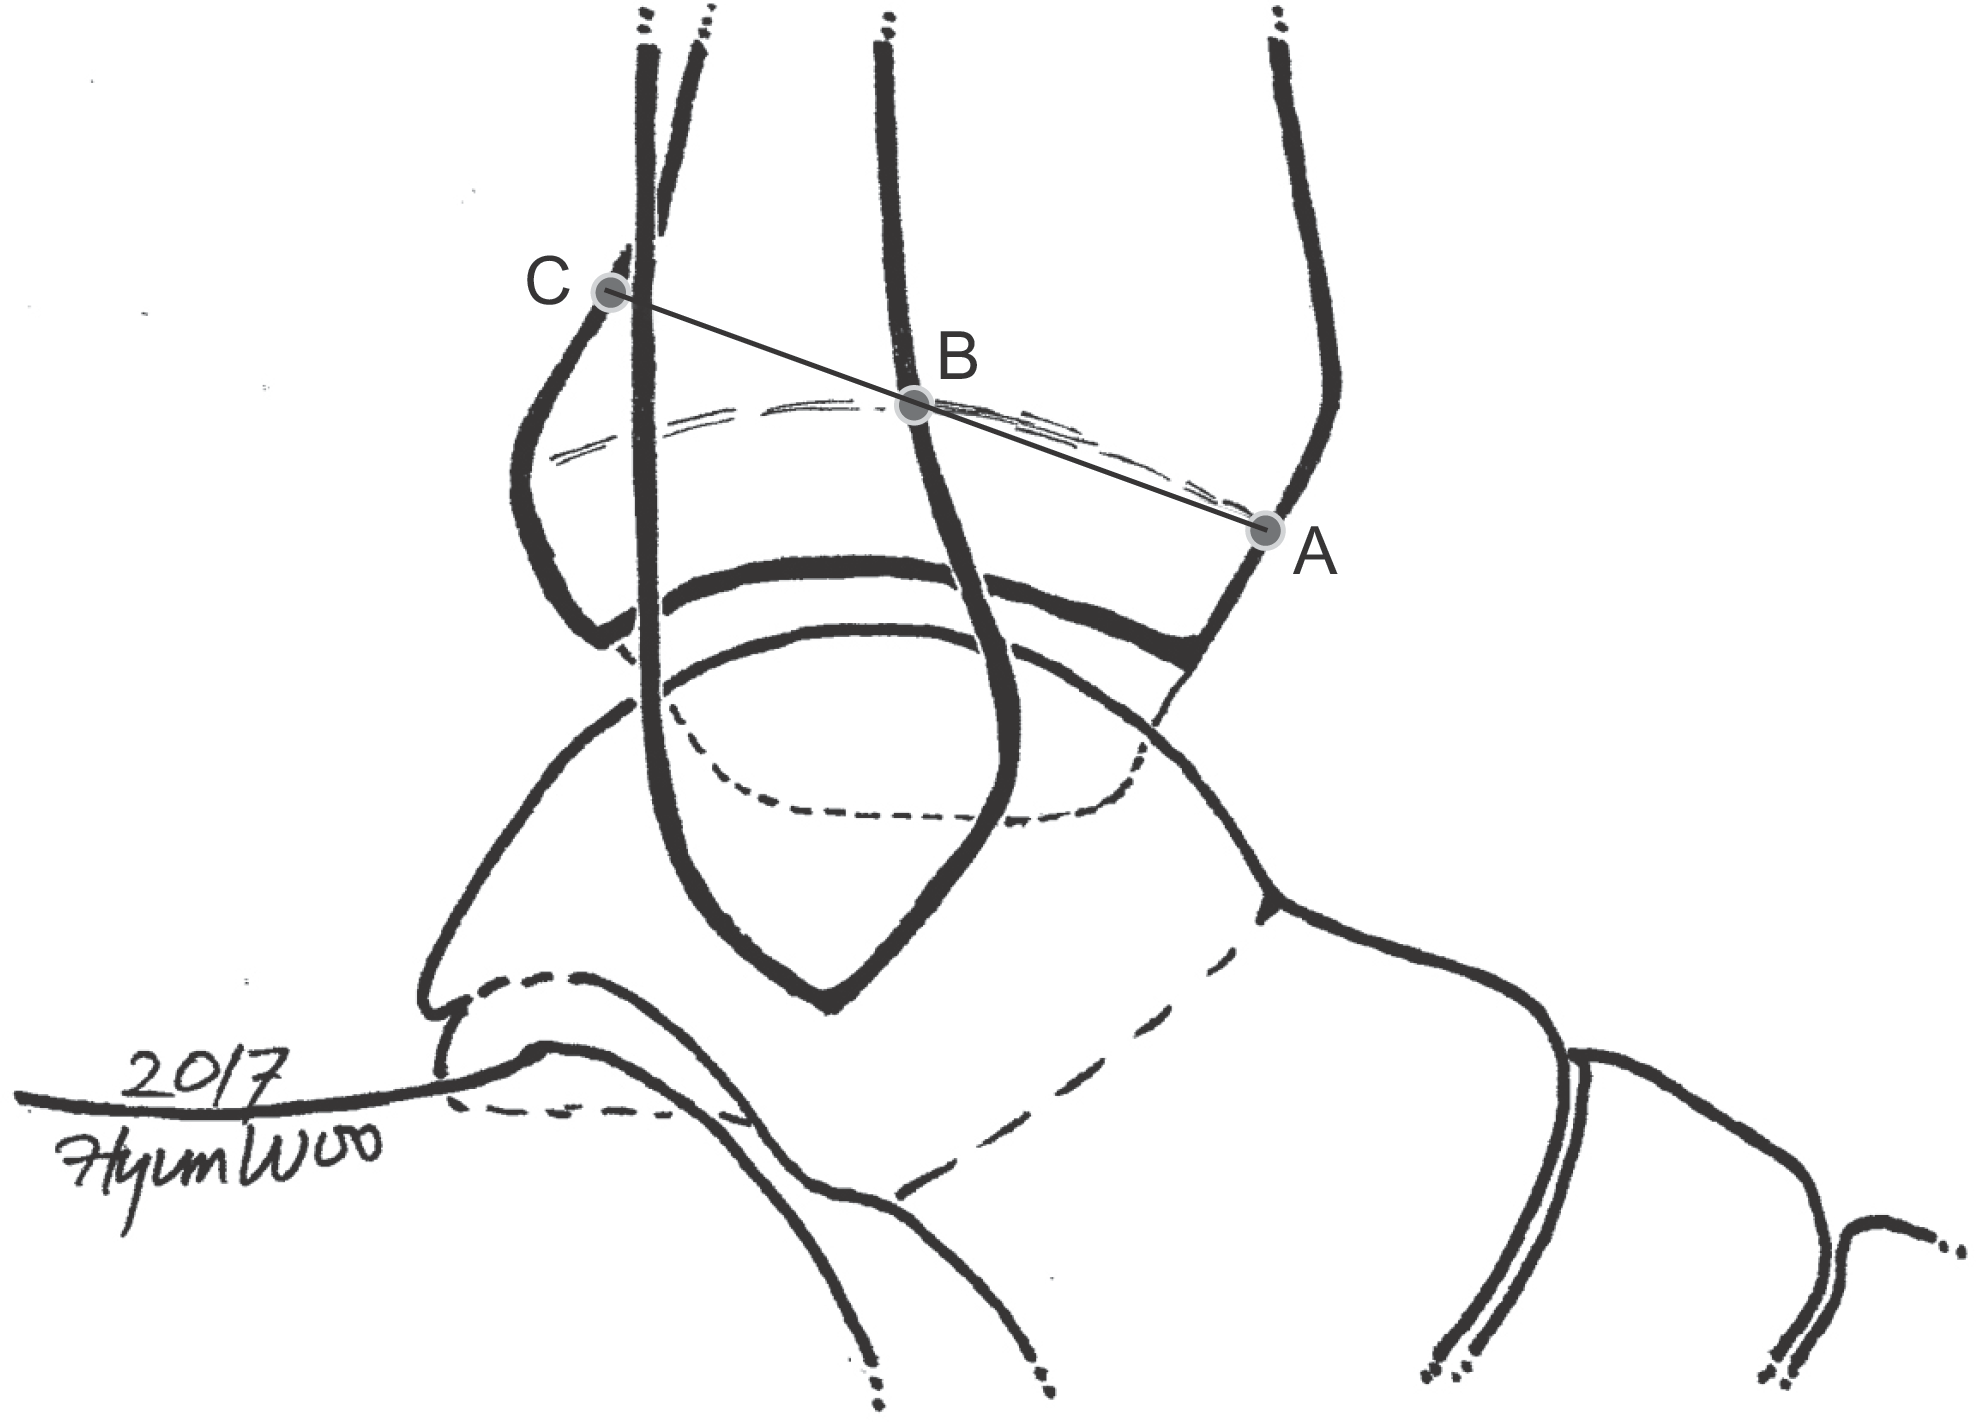
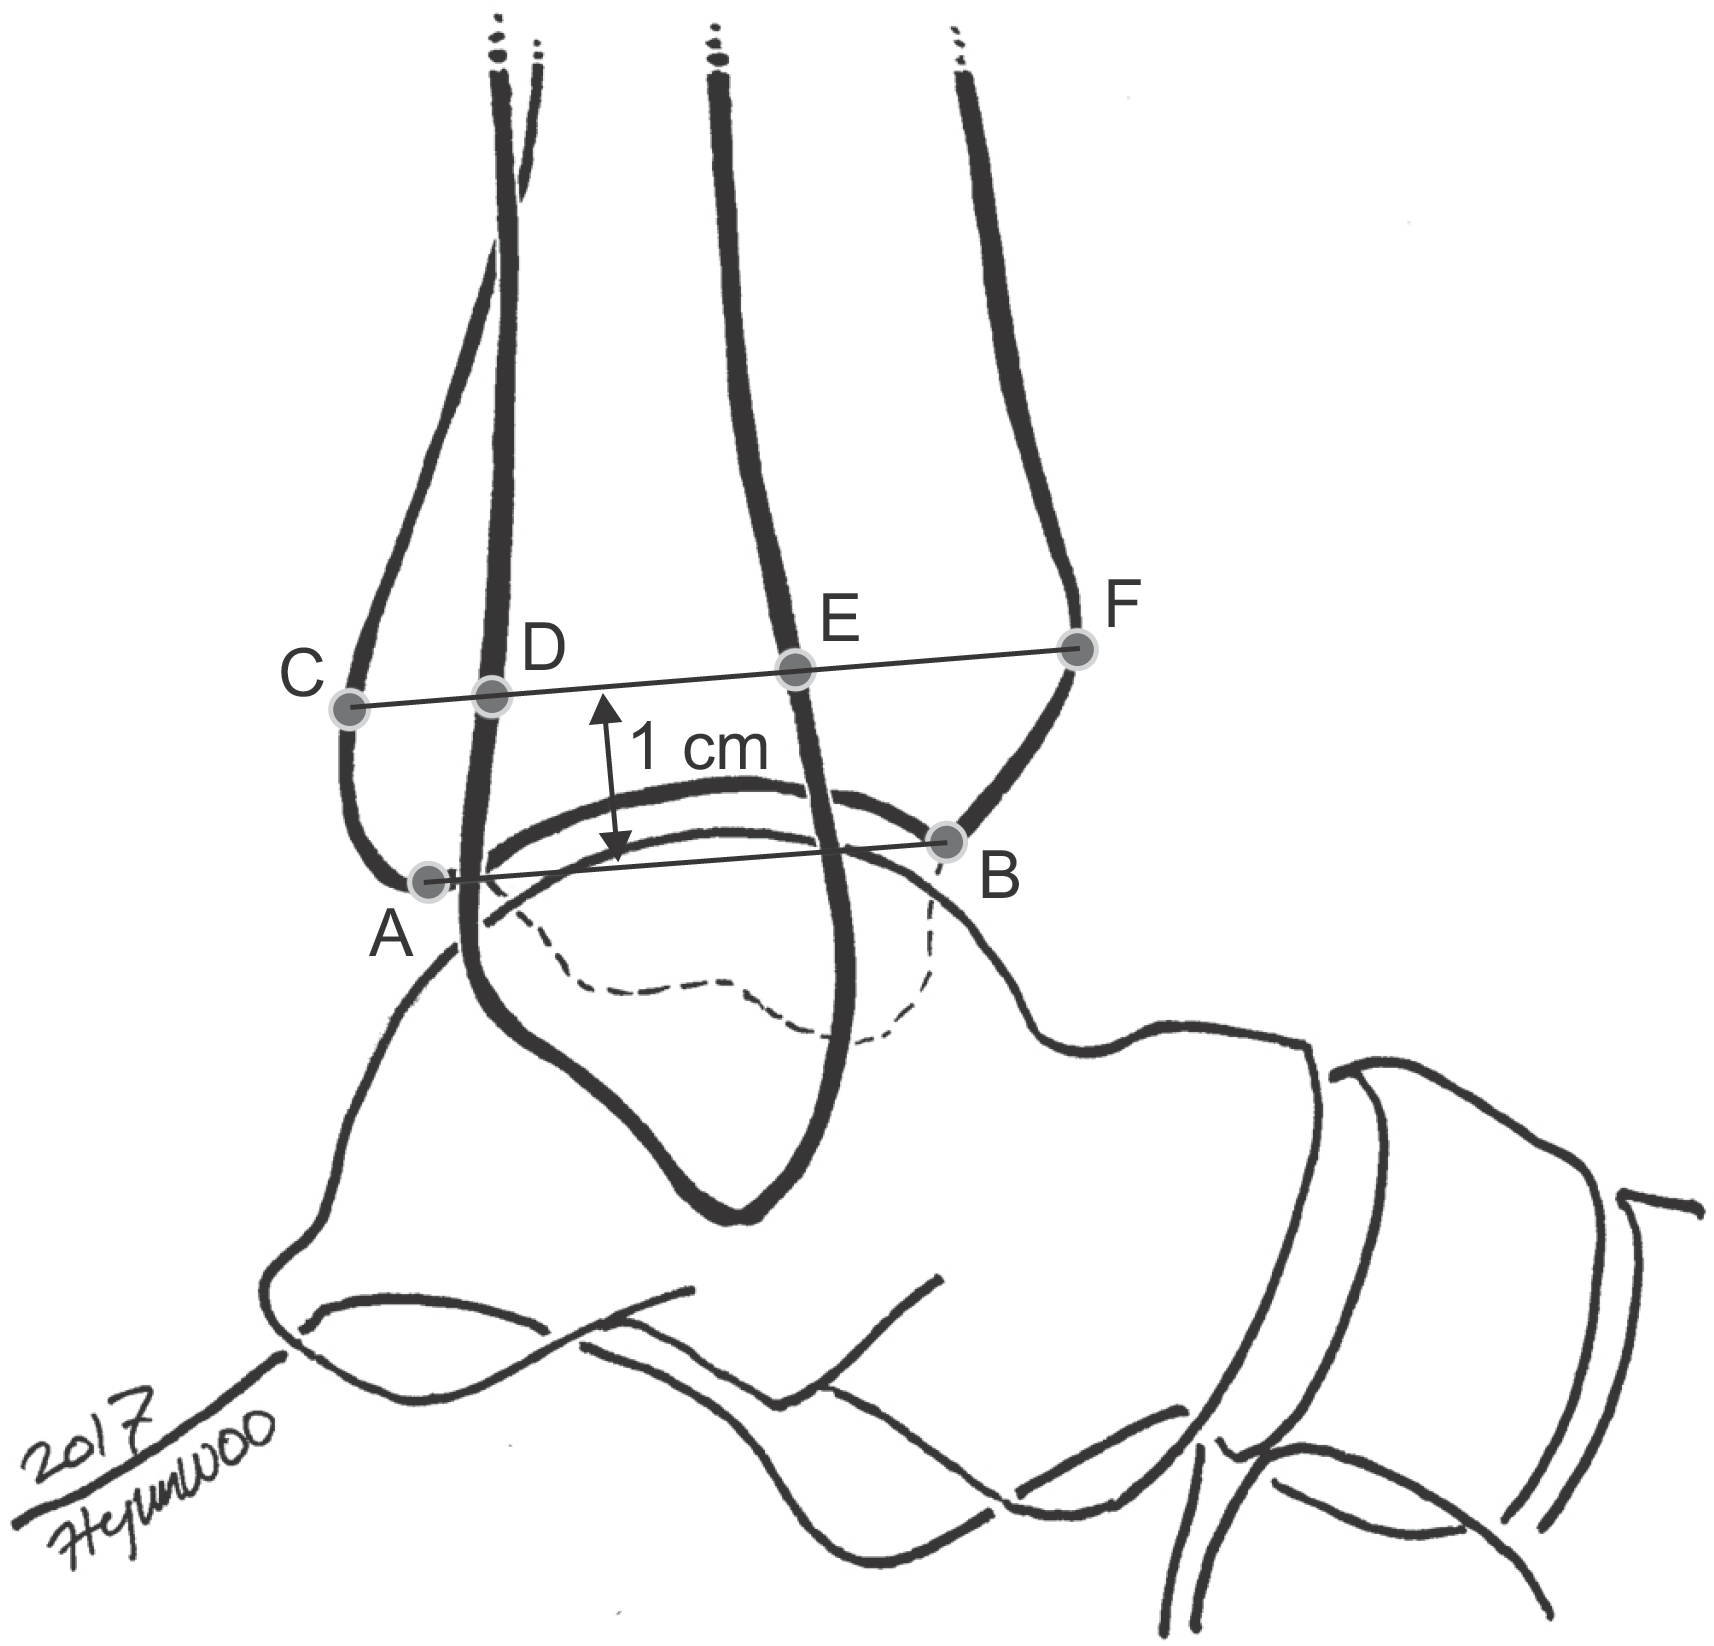
Figure 1.
Grenier’s method7); anteroposterior tibiofibular (APTF) ratio. A: anterior cortex of the tibia at the level of the physeal scar, B: intersection of the anterior cortex of the fibula and the tibial physeal scar, C: intersection of the line crossing A & B and the posterior cortex of tibia. APTF ratio=AB/BC.
jkfas-21-128f1.tif
Figure 2.
Croft’s method8); anterior tibiofibular ratio (ATFR), posterior tibiofibular ratio (PTFR). AB: tibial plafond, CD: posterior tibiofibular interval (PTFI), DE: the fibular width (FW), EF: anterior tibiofibular interval (ATFI), CF: tibial width (TW). C, D, E, and F were measured 1 cm above the tibial plafond (AB). ATFR=ATFI/TW, PTFR=PTFI/TW.
jkfas-21-128f2.tif
Figure 3.
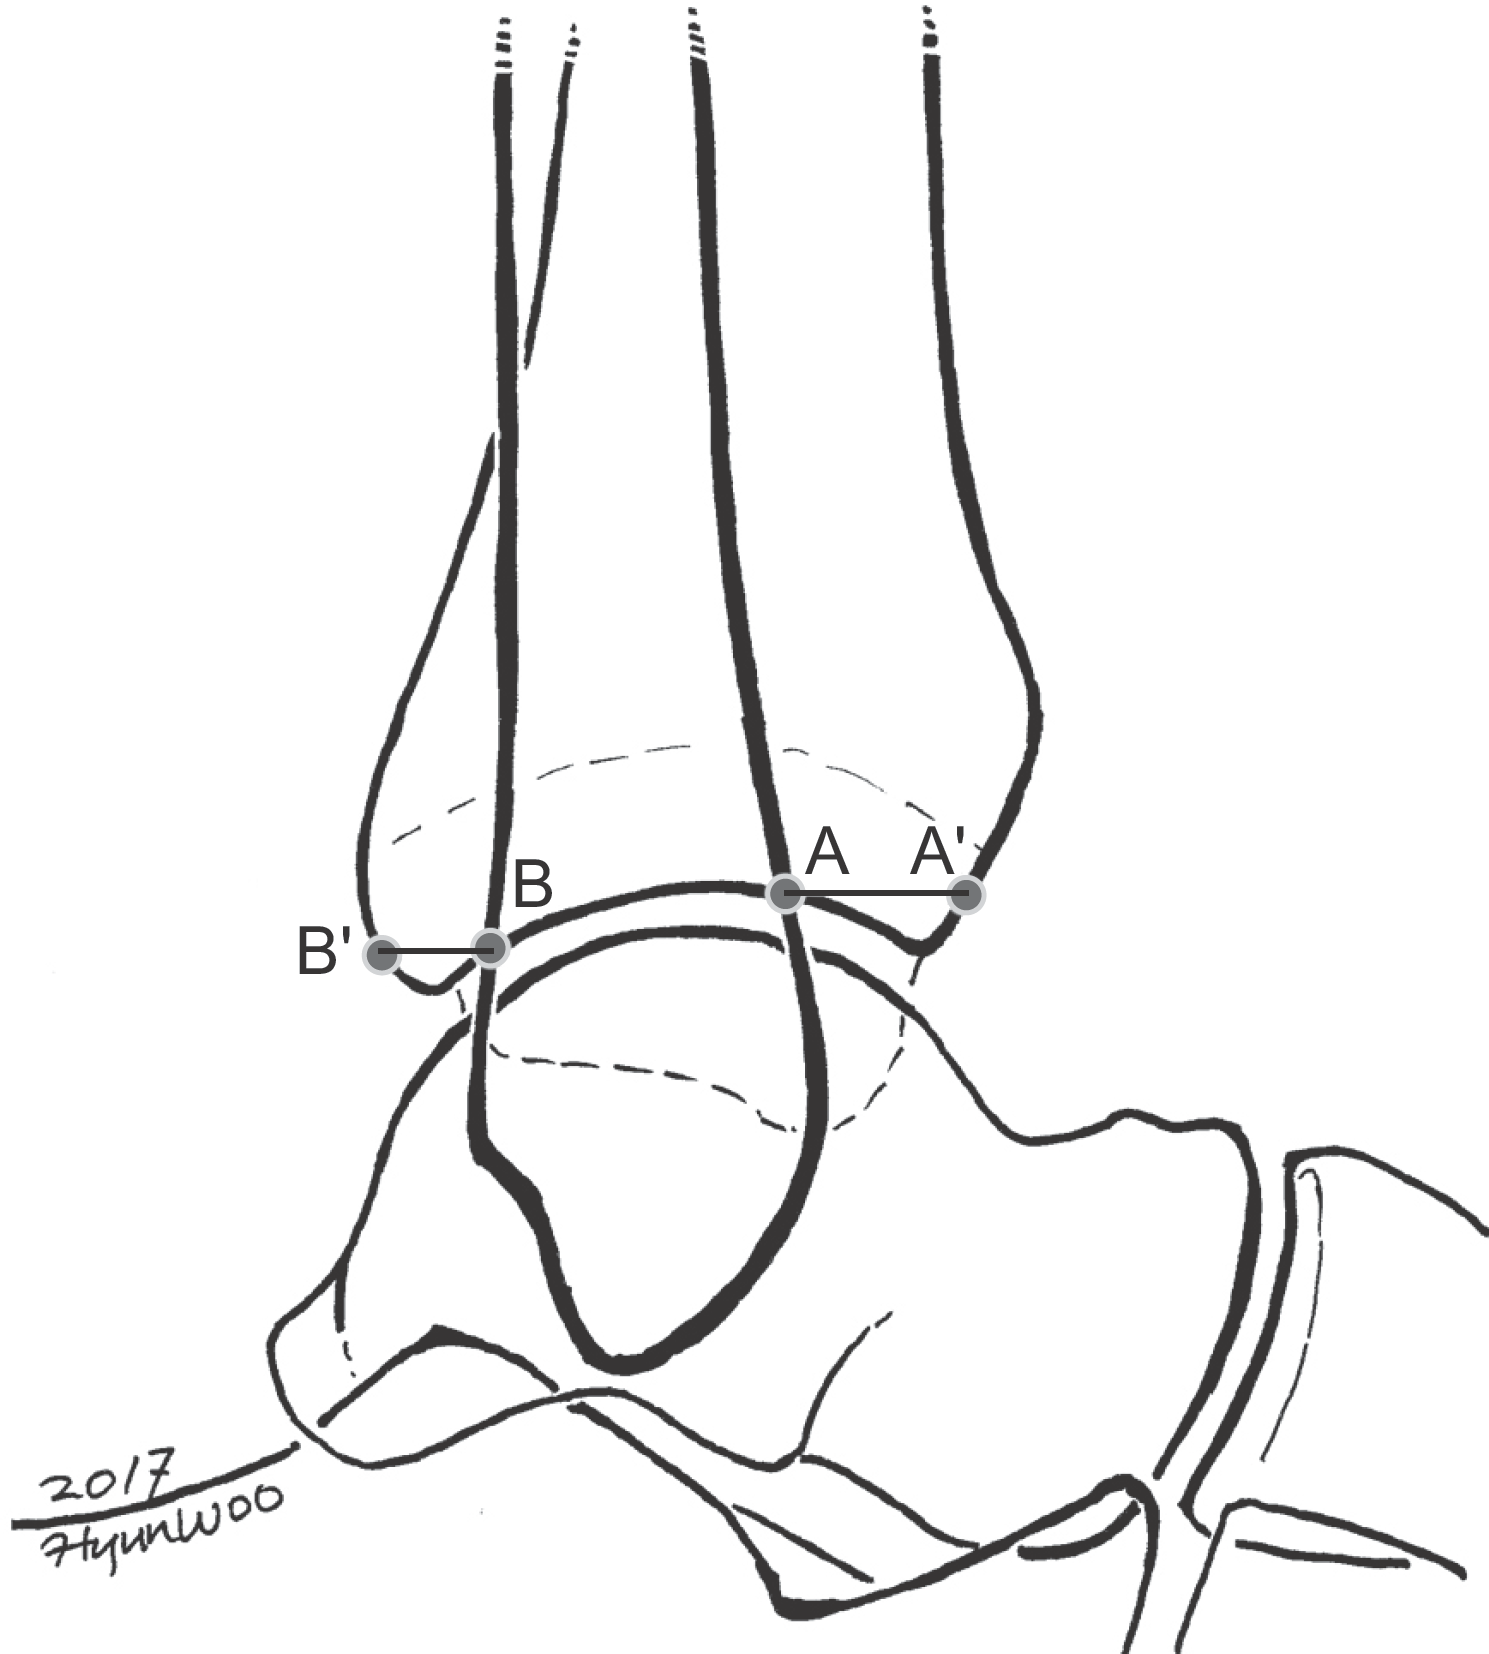
Summers’ method1); AA’ and BB’. A: intersection of anterior fibular border and tibial plafond, A’: anterior cortex of tibia, B: intersection of posterior fibular border and tibial plafond, B’: tip of posterior malleolus. AA’ and BB’ were drawn horizontally in talar dome lateral view.
jkfas-21-128f3.tif
Figure 4.
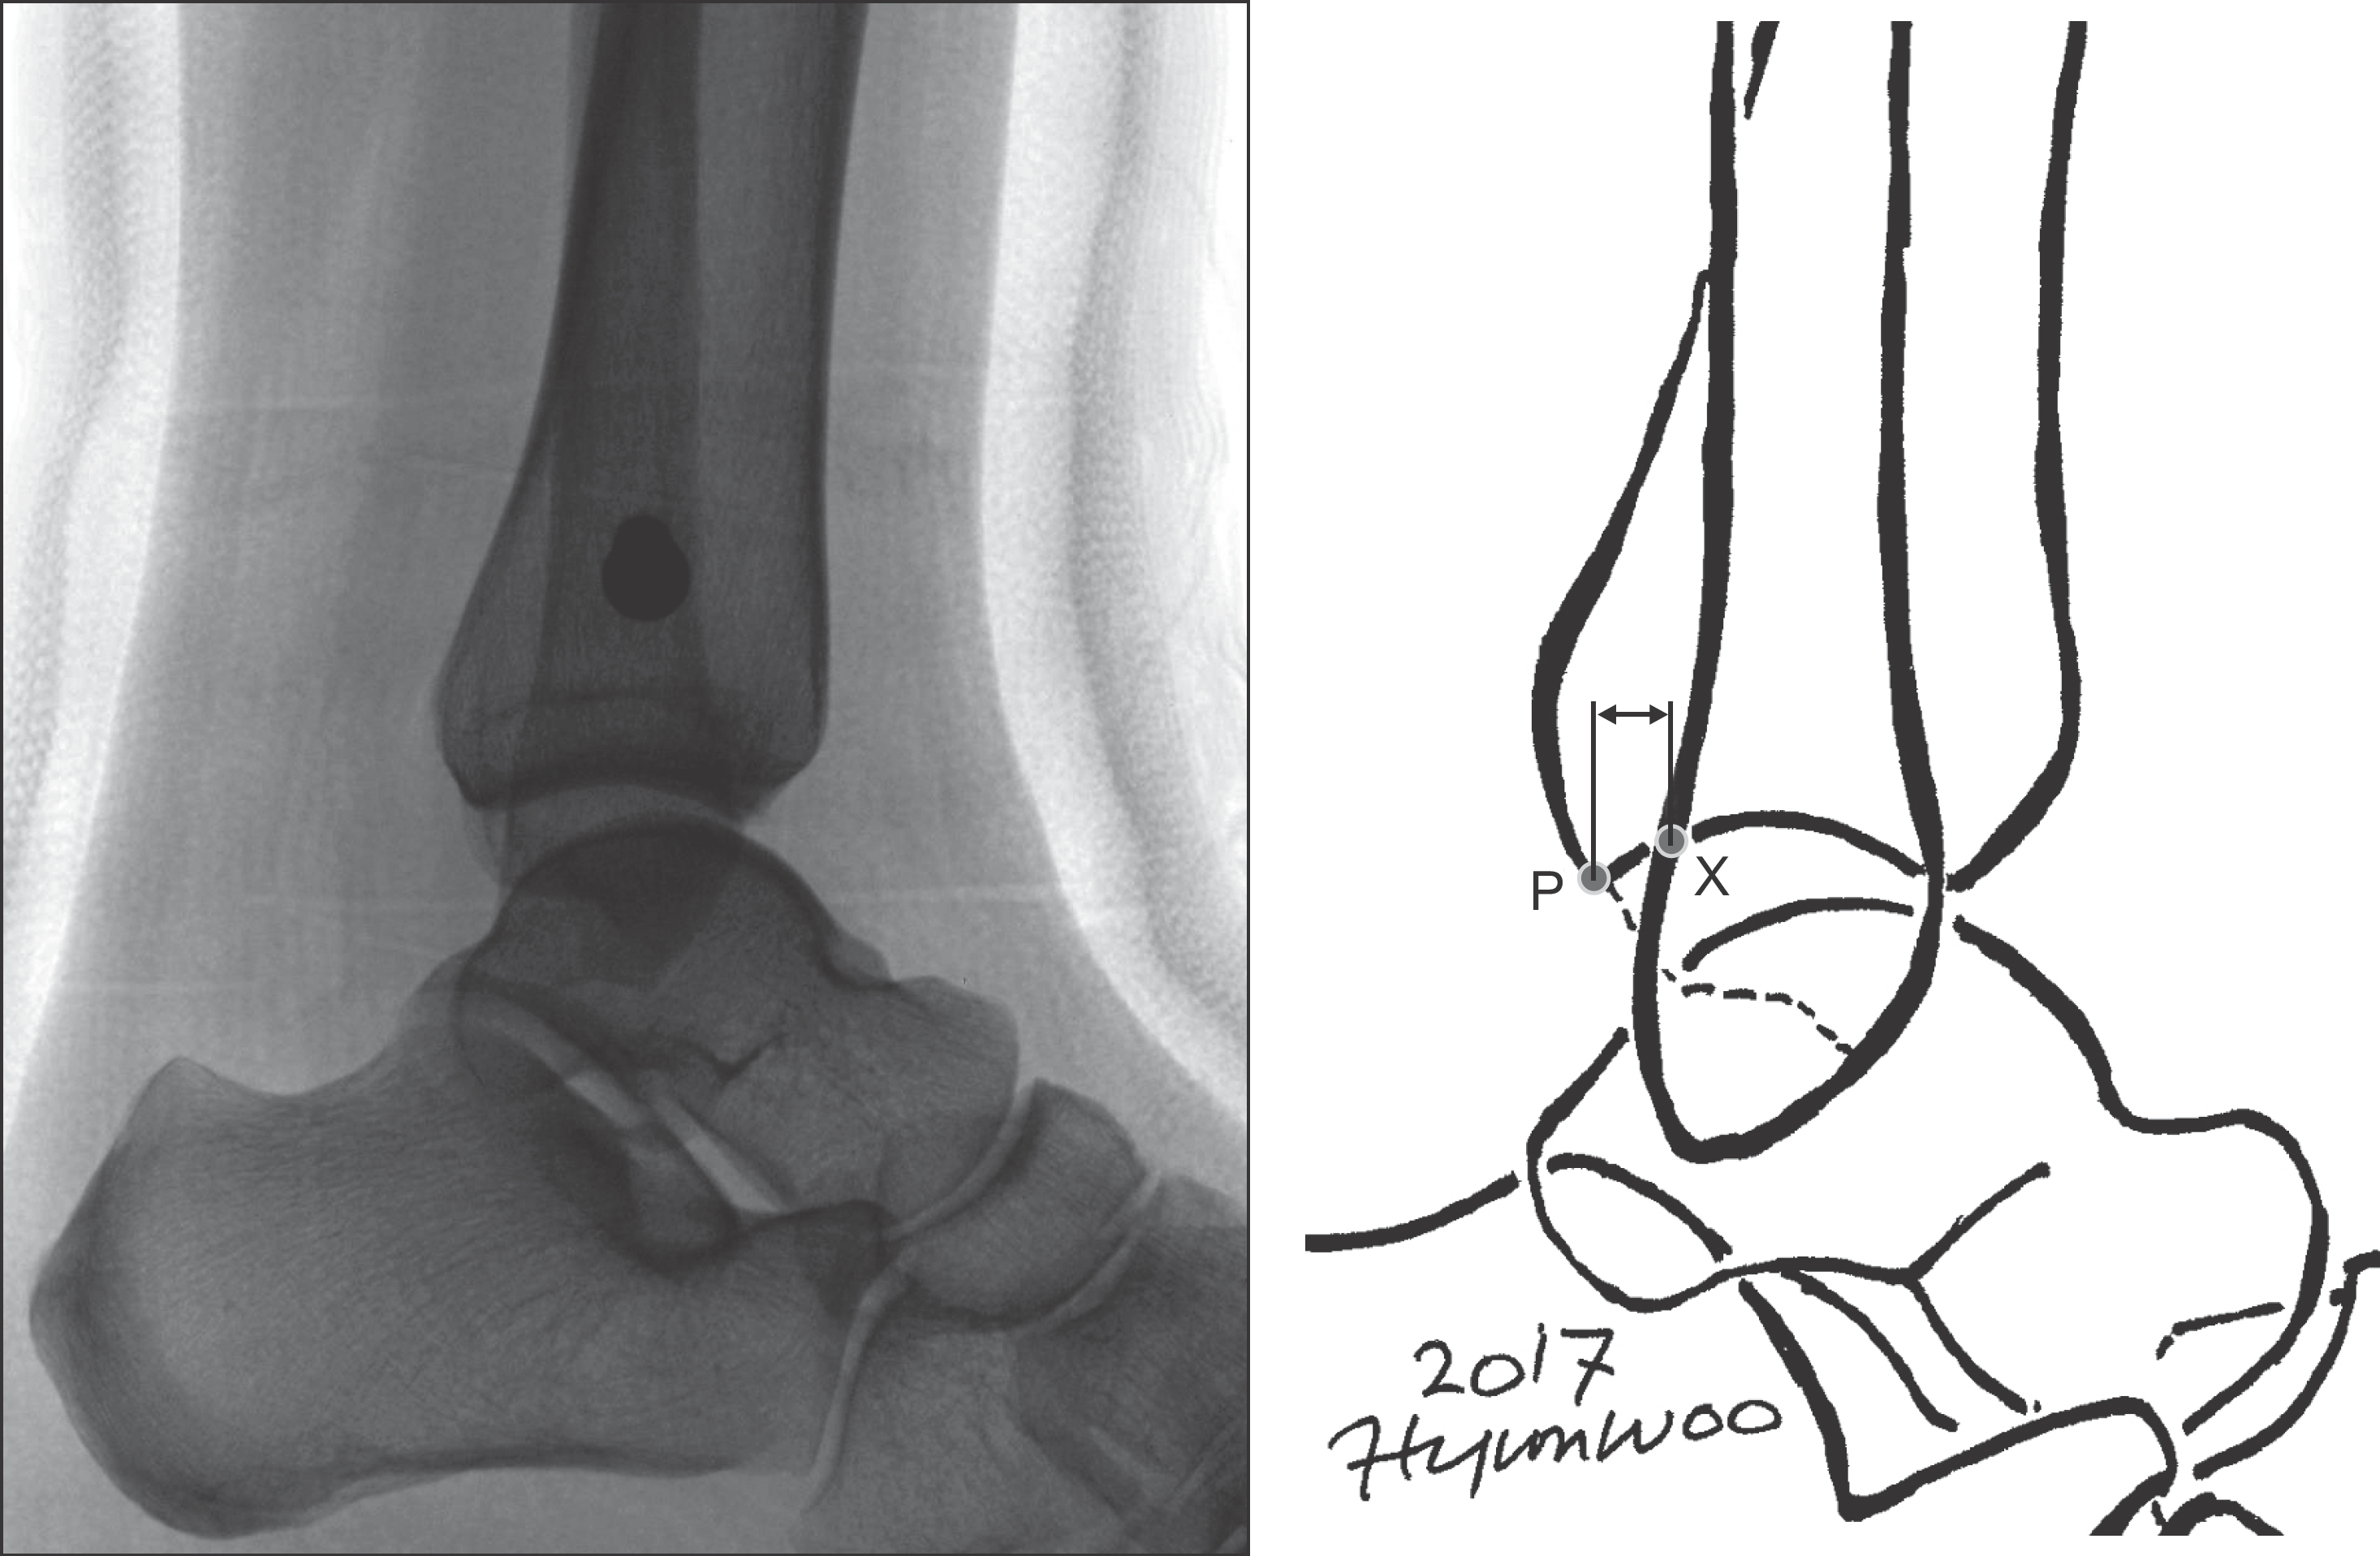
This study’s method. X: fibular posterior margin crossing tibial plafond or crossing posterior malleolus, P: posterior articular margin of tibial plafond. Two straight vertical lines parallel with tibial anatomical axis were drawn and each line crossed X, P point. The shortest distance within those lines (XP) was measured.
jkfas-21-128f4.tif
Figure 5.
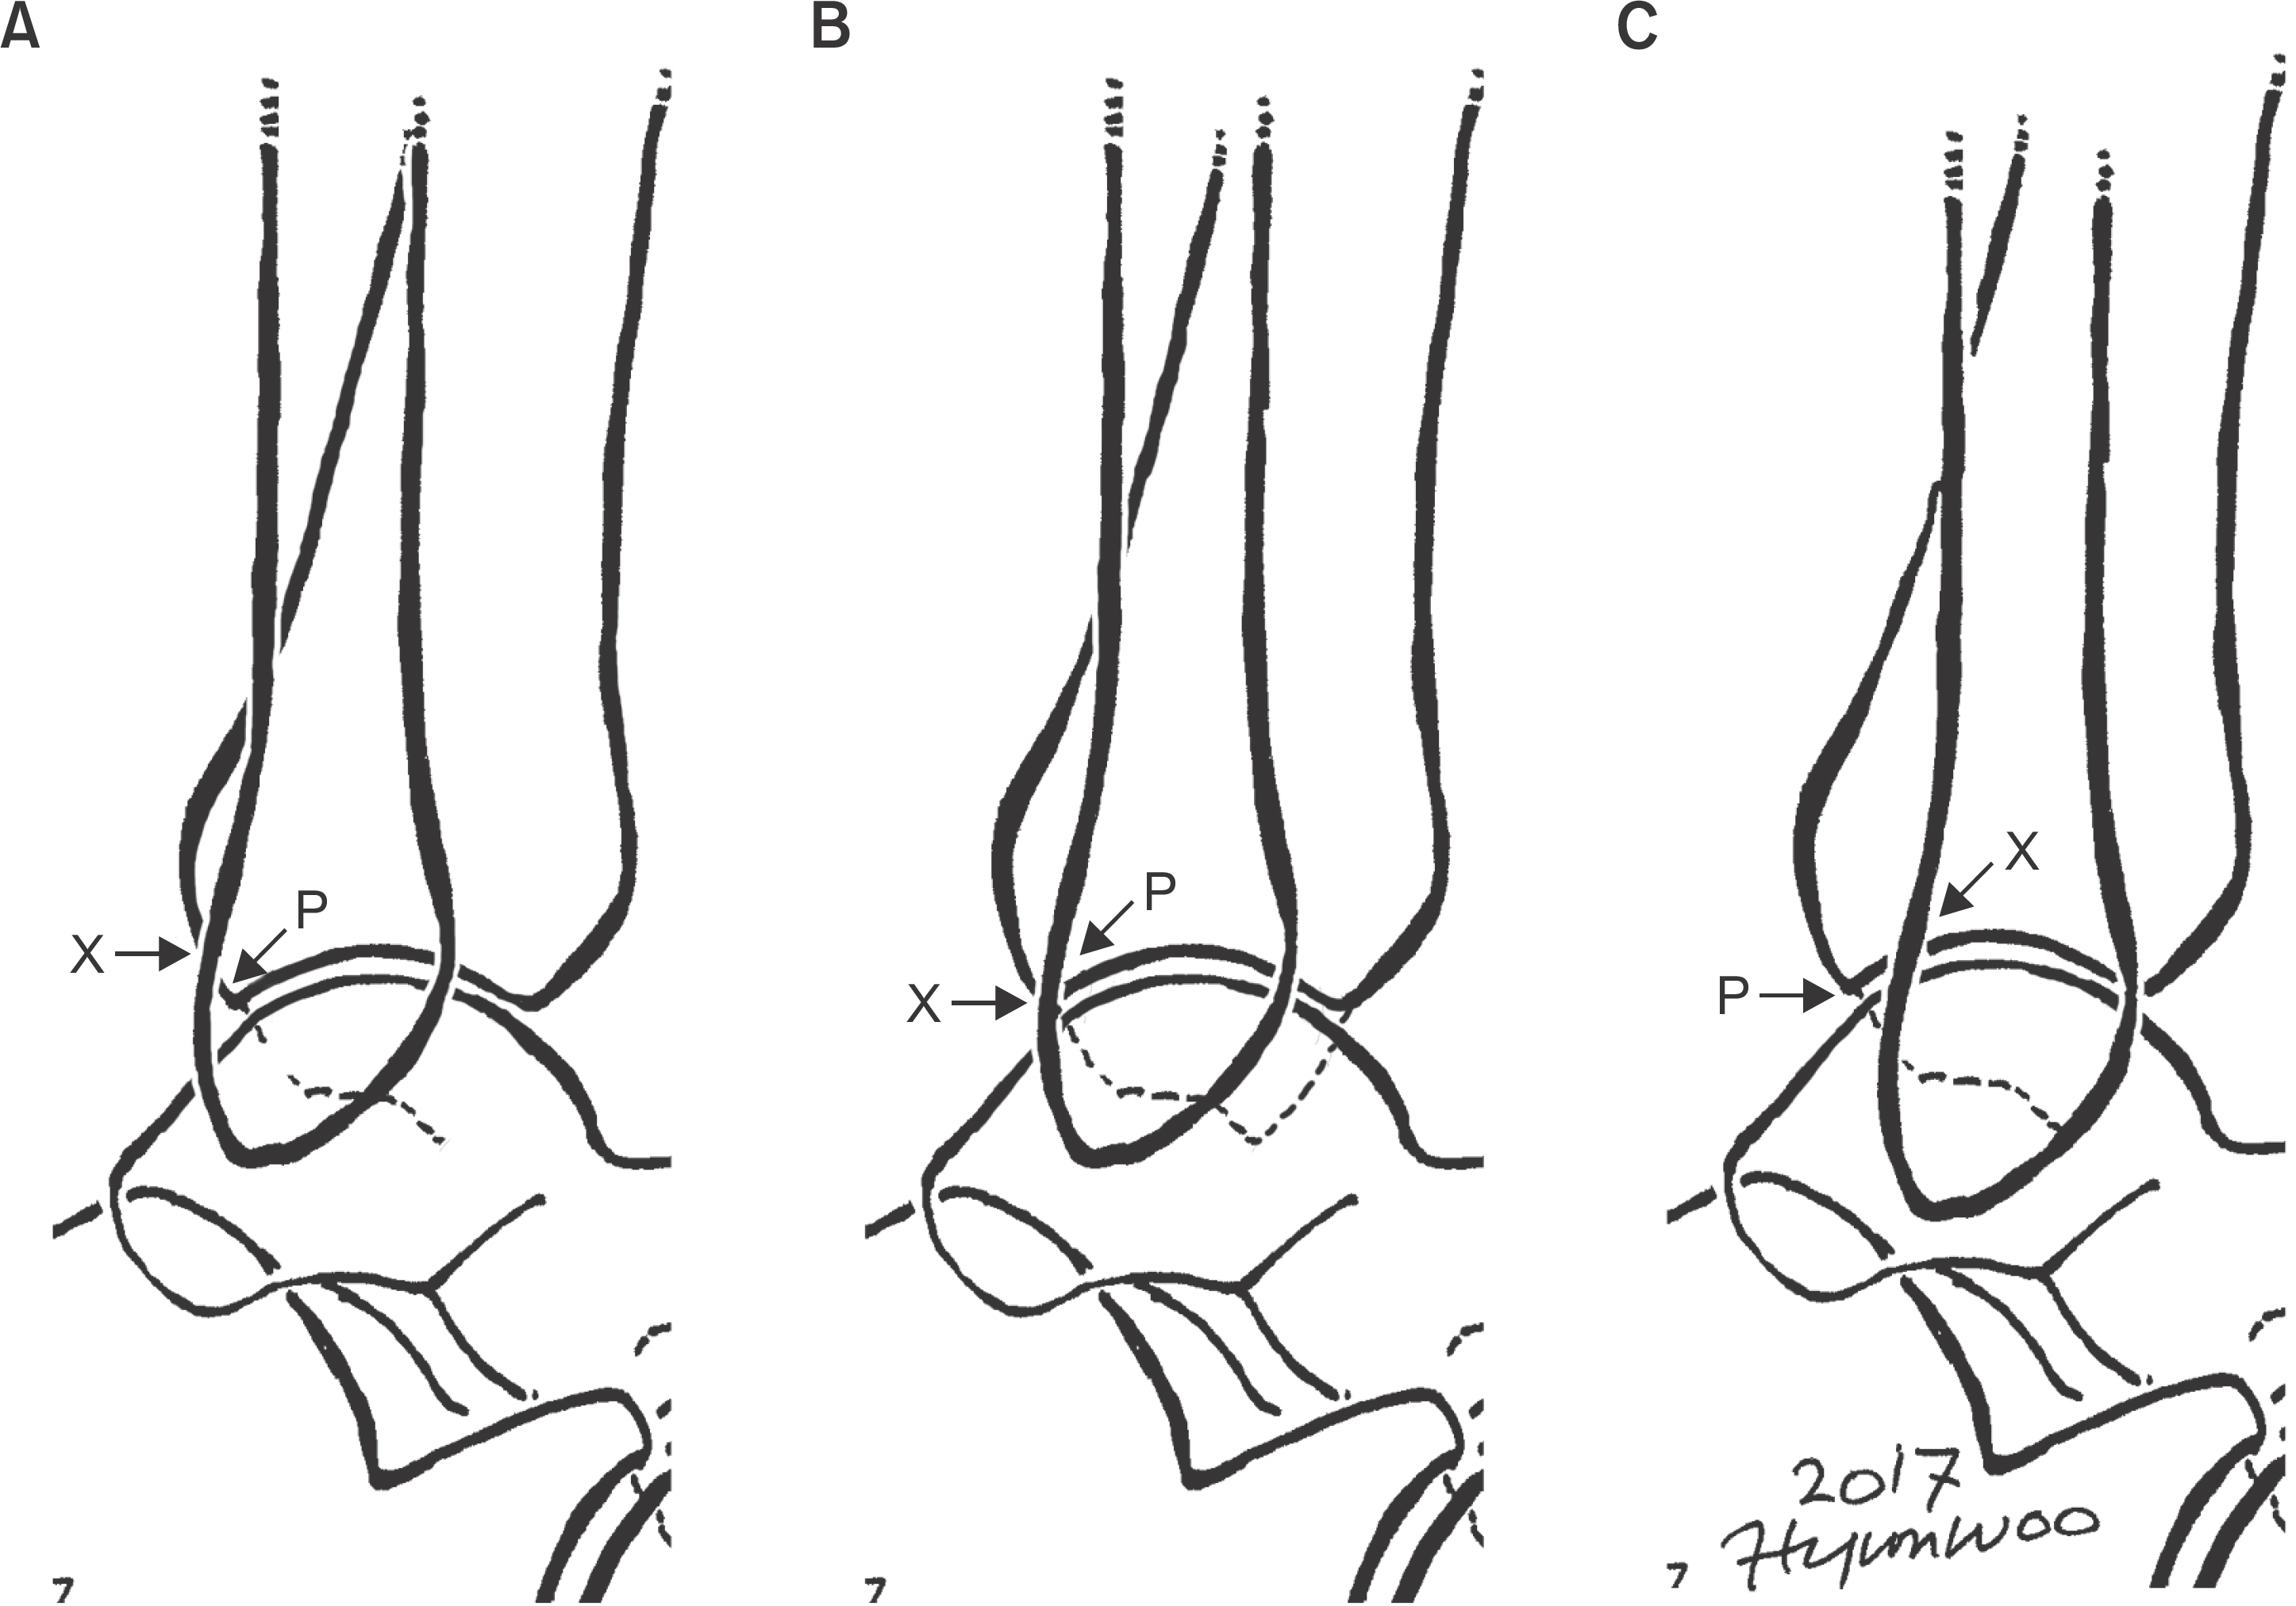
Relationship of fibula posterior margin and posterior articular margin of tibial plafond. X, P, and XP were same as Fig. 4. (A) X posterior than P; XP=(―). (B) X exactly at P; XP=0. (C) X anterior than P; XP=(+).
jkfas-21-128f5.tif
Figure 6.
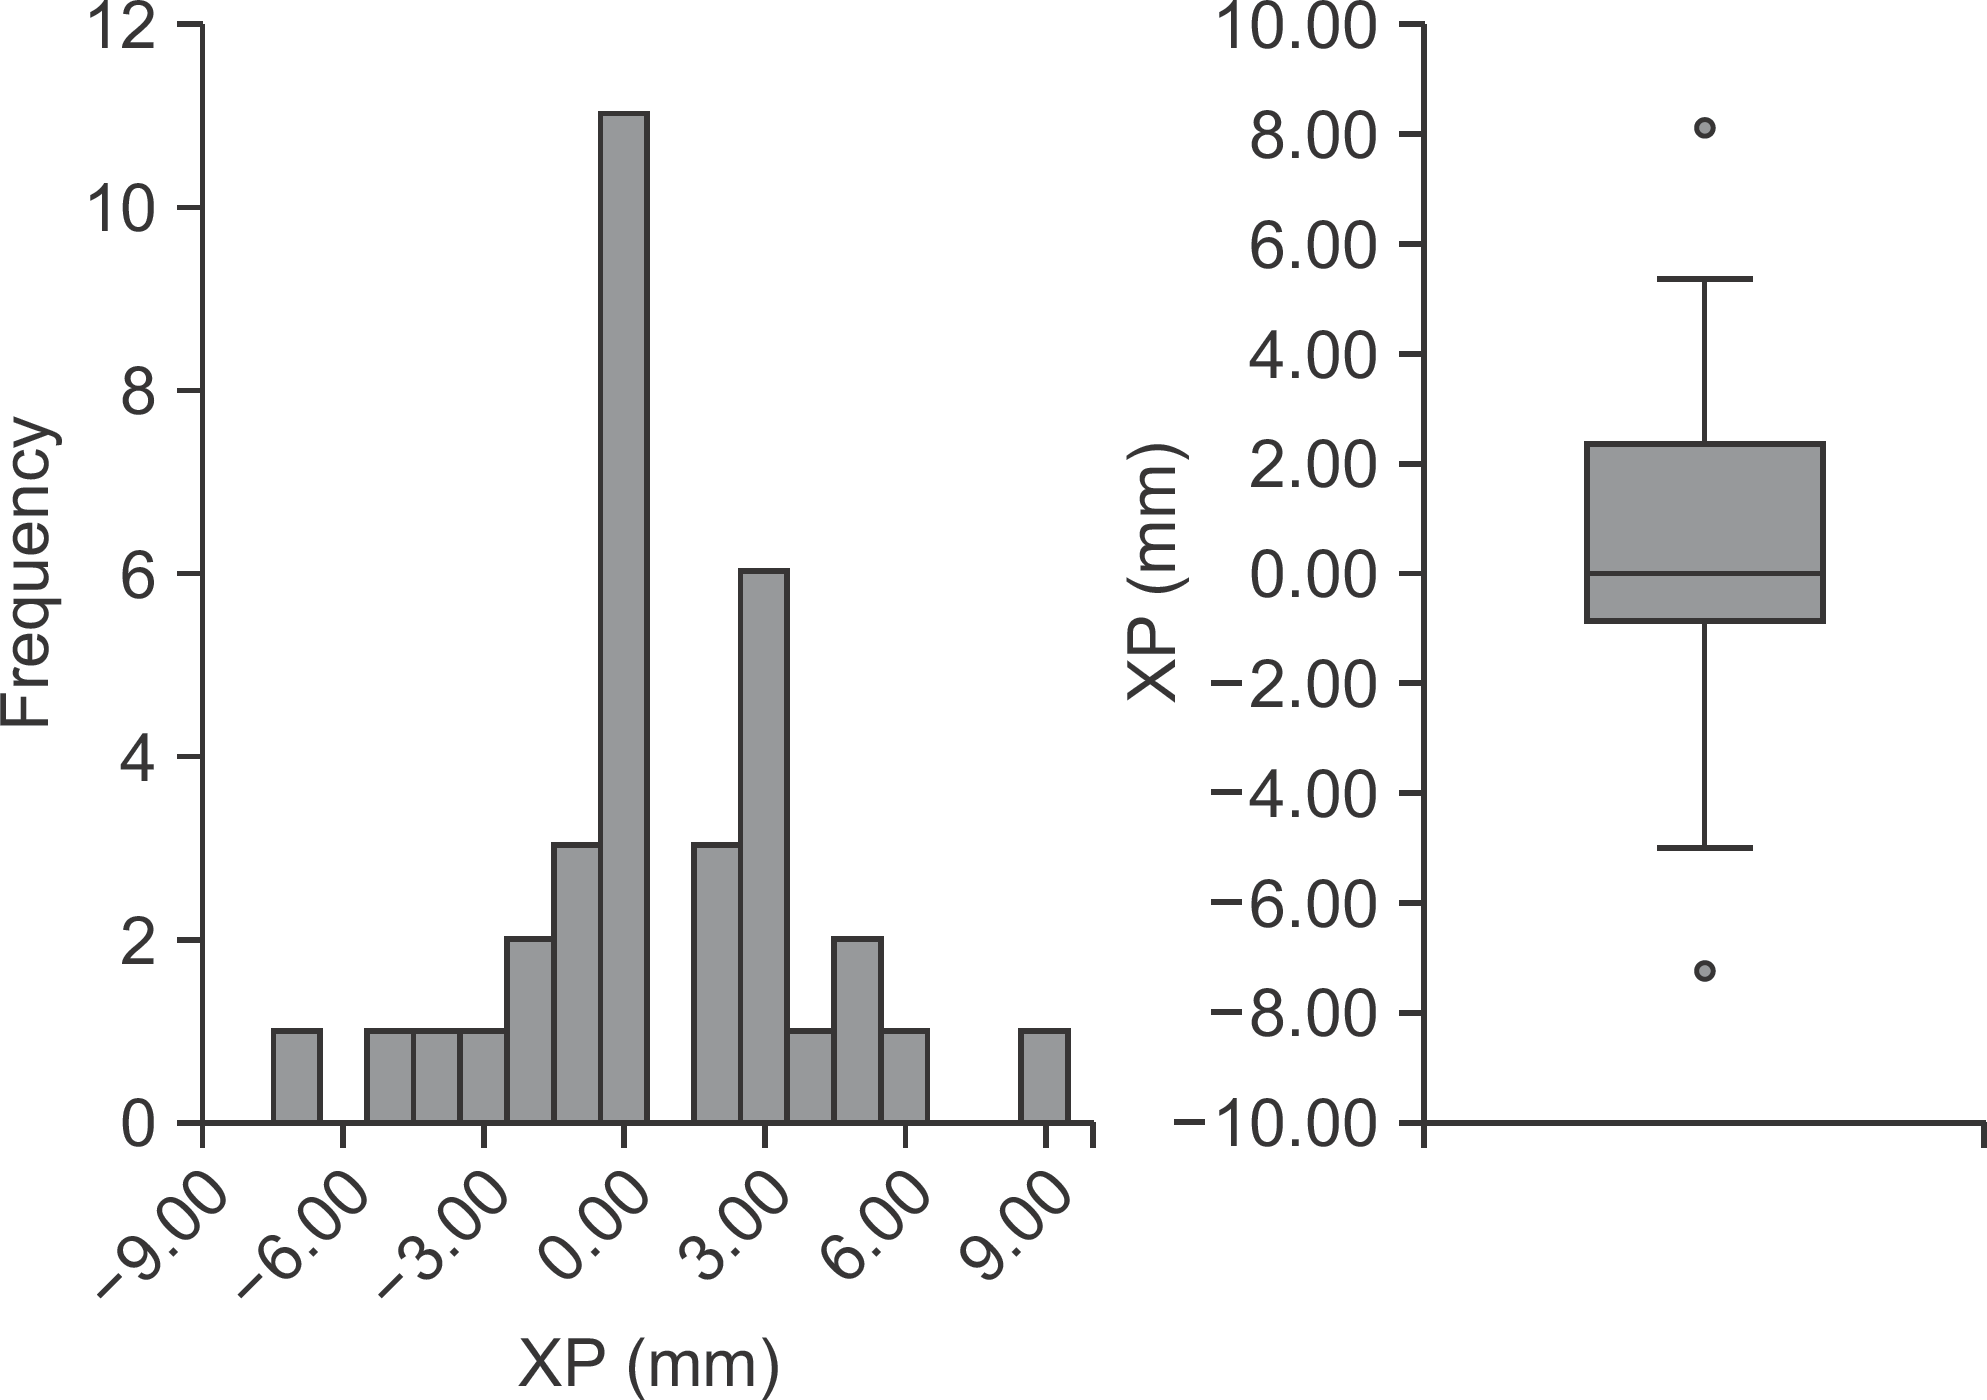
Distribution of the XP distance. Median (Q1, Q3)=0 (―1.10, 2.48).
jkfas-21-128f6.tif
Table 1.
Radiographic Measurements and Estimated Syndesmotic Malreduction Cases on AP and Mortise Radiograph (n=34)
AP Mortise
TFCS TFO TFCS TFO
Mean (mm) 2.92±0.80 5.94±1.96 3.09±1.00 3.13±1.59
Range (mm) 1.60∼5.10 2.00∼11.00 1.50∼5.40 0.00∼6.50
Estimated syndesmotic malreduction cases 1 (2.9) 17 (50.0) 2 (5.9) 2 (5.9)

Values are presented as mean±standard deviation, range, or number (%). AP: anteroposterior, TFCS: tibiofibular clear space, TFO: tibiofibular overlap.

Table 2.
Radiographic Measurements and Estimated Syndesmotic Malreduction Cases on Lateral Radiograph
Grenier’s method7) Croft’s method8) Summers’ method1) This study’s method
APTF ratio ATFR PTFR AA’ (mm) BB’ (mm) XP (mm)
Mean 0.73±0.16 0.38±0.06 0.17±0.05 7.33±3.78 6.38±2.02 0 (-1.10, 2.48)*
90% confidence interval 0.68∼0.77 0.36∼0.40 0.15∼0.18 6.21∼8.44 5.69∼7.07 -0.42∼1.35
Range 0.40∼1.08 0.21∼0.53 0.08∼0.29 -4.4∼17.2 3.47∼11.56 -7.23∼8.16
Estimated syndesmotic malreduction cases 14 (41.2) 3 (8.8) 1 (2.9) 3 (8.8) 2 (8.0) 2 (5.9)
<Mean―(2×SD), >Mean+(2×SD) 4 3 1 3 2 2
Outlier 0 2 1 3 2 2
Based on other study results 12 1 1 - - -

Values are presented as mean±standard deviation, range, number (%), or number only. AA’: the distance from the intersection of the anterior fibular border and the tibial plafond (A) to anterior cortex of the tibia (A’), BB’: the distance from the intersection of posterior fibular border and tibial plafond (B) to the tip of the posterior malleolus (B’), XP: the distance between the fibular posterior margin (X) crossing tibial plafond or the posterior malleolus and posterior articular margin (P) of the tibial plafond. APTF: anteroposterior tibiofibular, ATFR: anterior tibiofibular ratio, PTFR: posterior tibiofibular ratio, SD: standard deviation.

* Median (Q1, Q3; interquartile range [IQR]).

n=25, 2/25=8.0%.

<Q1―(1.5×IQR), >Q3+(1.5×IQR).

TOOLS
Similar articles