Abstract
Purpose
The purpose of this study is to define the geographic patterns of partial avascular necrosis (AVN) of the talar body and to determine whether there were any predictors of both the location and occurrence of partial AVN.
Materials and Methods
Nineteen patients with fracture of the talar neck treated by open reduction and internal fixation and followed up for more than 1 year were analyzed. The radiographs were examined 6 to 8 weeks after the operation for Hawkins sign and if it was not observed, magnetic resonance scans were performed. The three-dimensional analysis was performed using Mimics 17.0 (Materialise). The incidence of collapse and time to operative intervention was recorded.
Results
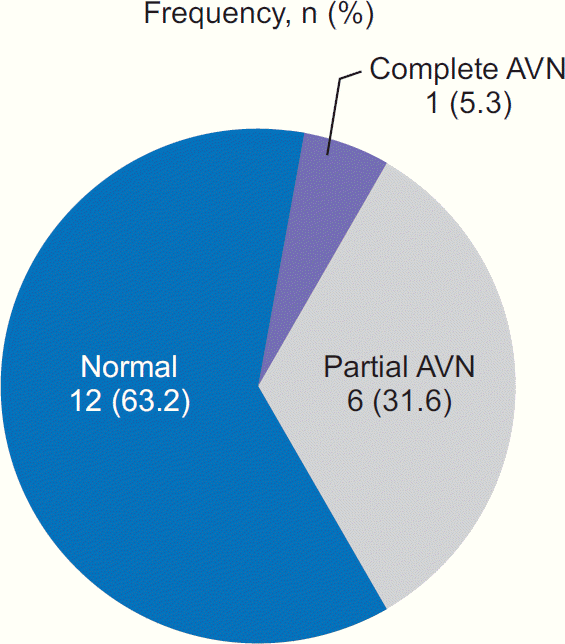
Partial AVN of the talar body was observed in six out of 19 patients. The avascular segment of the talar body was located predominantly in the anterolateral portion. The average volume of the avascular segment was 289 mm3, and it occupied 1% of total volume of the talus, and 10% of the talar dome. Collapse occurred in one patient in the area of the avascular process. There were no observable trends with regard to Hawkins classification, incidence of collapse, or time to operative intervention to the location of the avascular segment.
References
4. Henderson RC. Posttraumatic necrosis of the talus: the Hawkins sign versus magnetic resonance imaging. J Orthop Trauma. 1991; 5:96–9.
5. Penny JN, Davis LA. Fractures and fracture-dislocations of the neck of the talus. J Trauma. 1980; 20:1029–37.

6. Babu N, Schuberth JM. Partial avascular necrosis after talar neck fracture. Foot Ankle Int. 2010; 31:777–80.

7. Comfort TH, Behrens F, Gaither DW, Denis F, Sigmond M. Longterm results of displaced talar neck fractures. Clin Orthop Relat Res. 1985; 199:81–7.

8. Tehranzadeh J, Stuffman E, Ross SD. Partial Hawkins sign in fractures of the talus: a report of three cases. AJR Am J Roentgenol. 2003; 181:1559–63.

9. Peterson L, Goldie IF, Irstam L. Fracture of the neck of the talus. A clinical study. Acta Orthop Scand. 1977; 48:696–706.
10. Tezval M, Dumont C, Stürmer KM. Prognostic reliability of the Hawkins sign in fractures of the talus. J Orthop Trauma. 2007; 21:538–43.

12. Haliburton RA, Sullivan CR, Kelly PJ, Peterson LF. The extraosseous and intraosseous blood supply of the talus. J Bone Joint Surg Am. 1958; 40:1115–20.

13. Kelly PJ, Sullivan CR. Blood supply of the talus. Clin Orthop Relat Res. 1963; 30:37–44.
15. Peterson L, Goldie I, Lindell D. The arterial supply of the talus. Acta Orthop Scand. 1974; 45:260–70.
Figure 1.
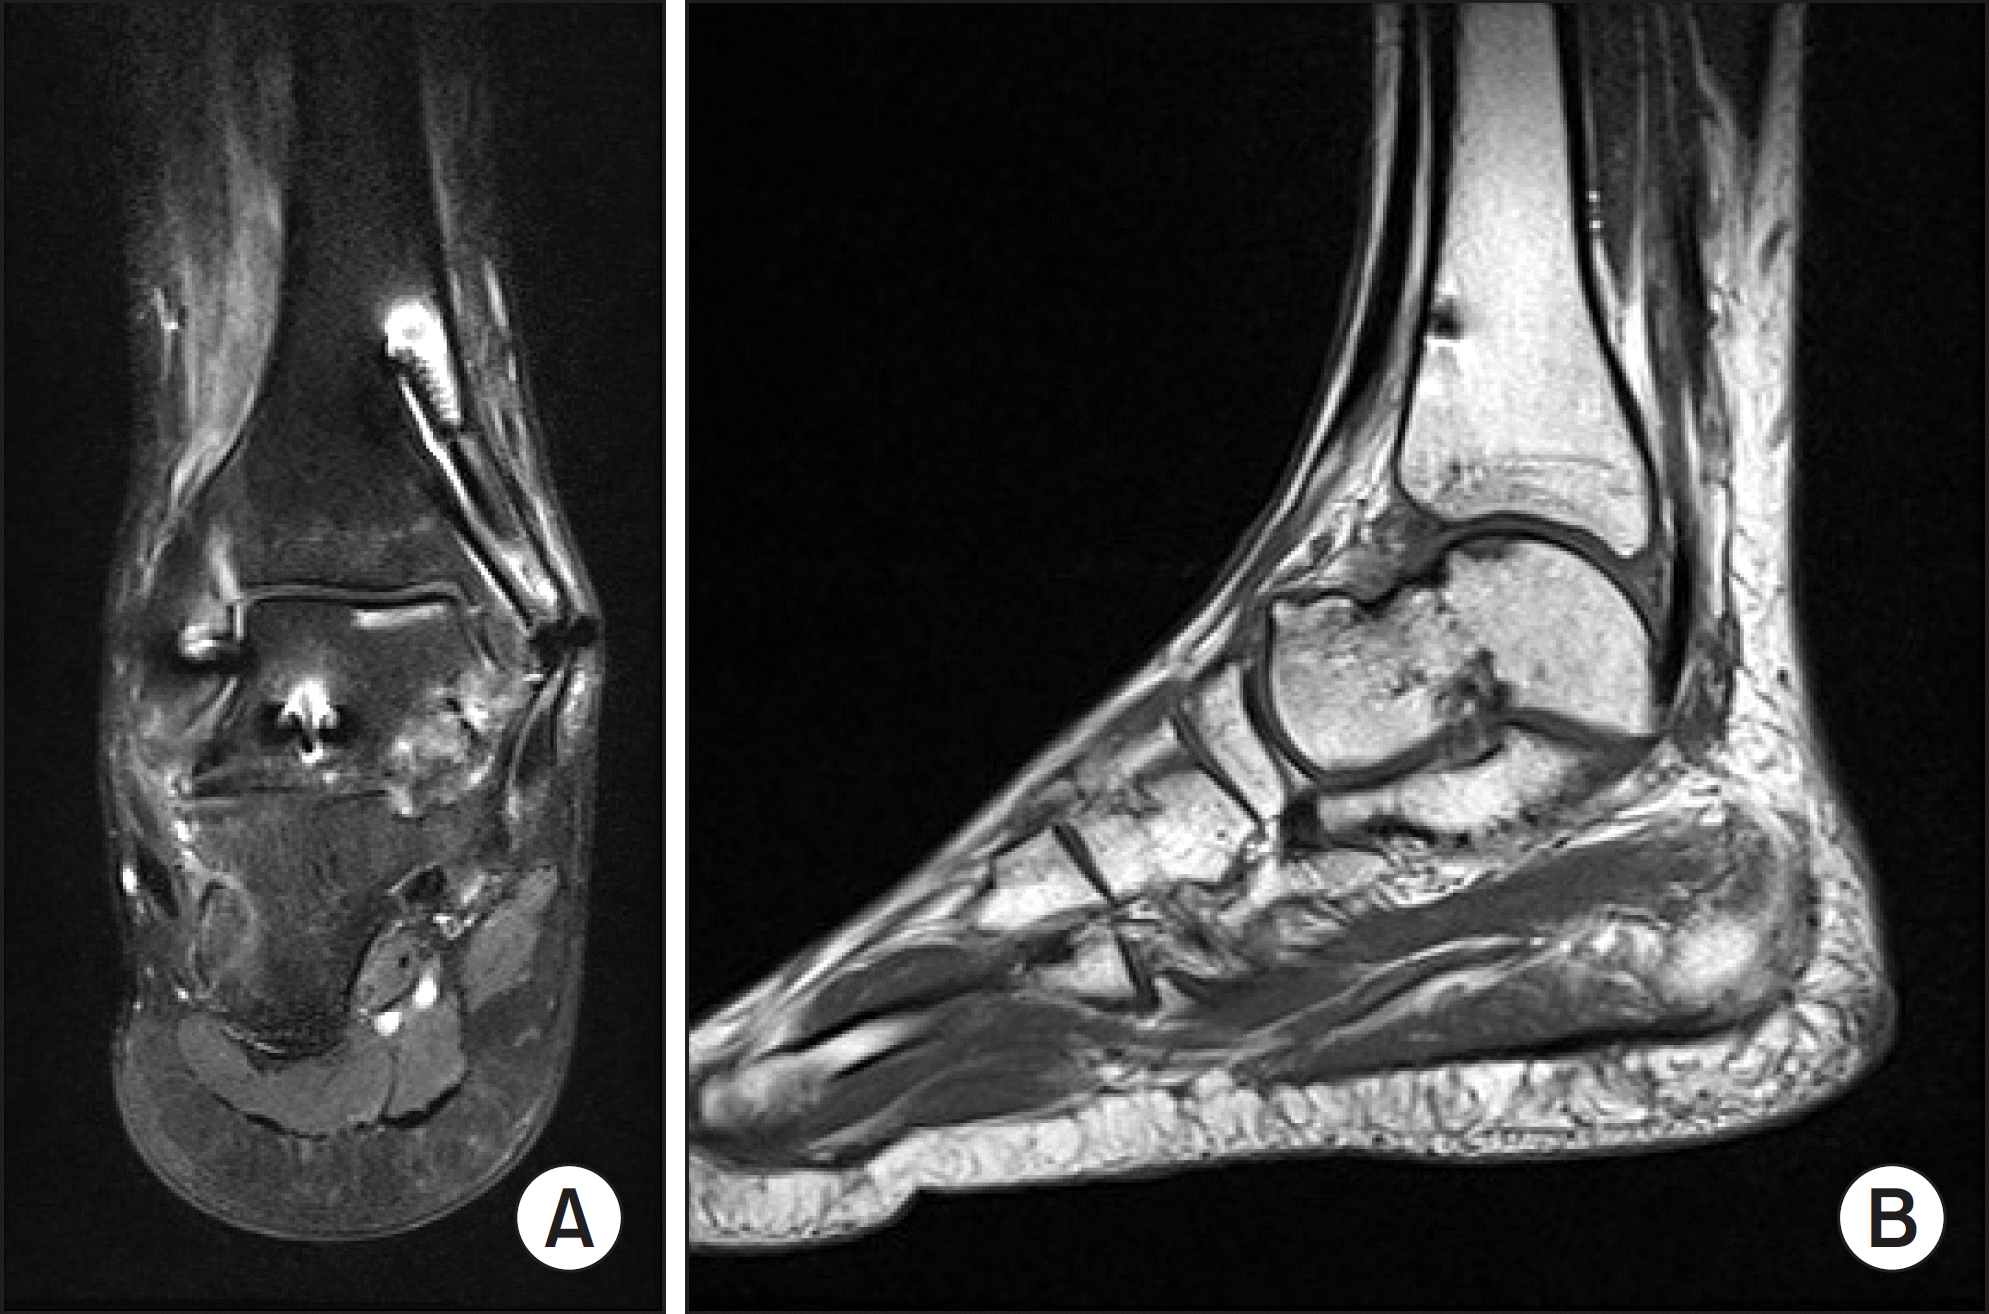
(A) The criterion for the establishment of partial avascular necrosis was based on clear magnetic resonance imaging (MRI) proton density weighted imaging evidence. Coronal plane MRI proton density fat suppression image shows the avascular fragment in the anterior of the talus. (B) Same image with the sagittal plane MRI T1-weighted image shows the avascular fragment in the anterior quadrant.

Figure 2.
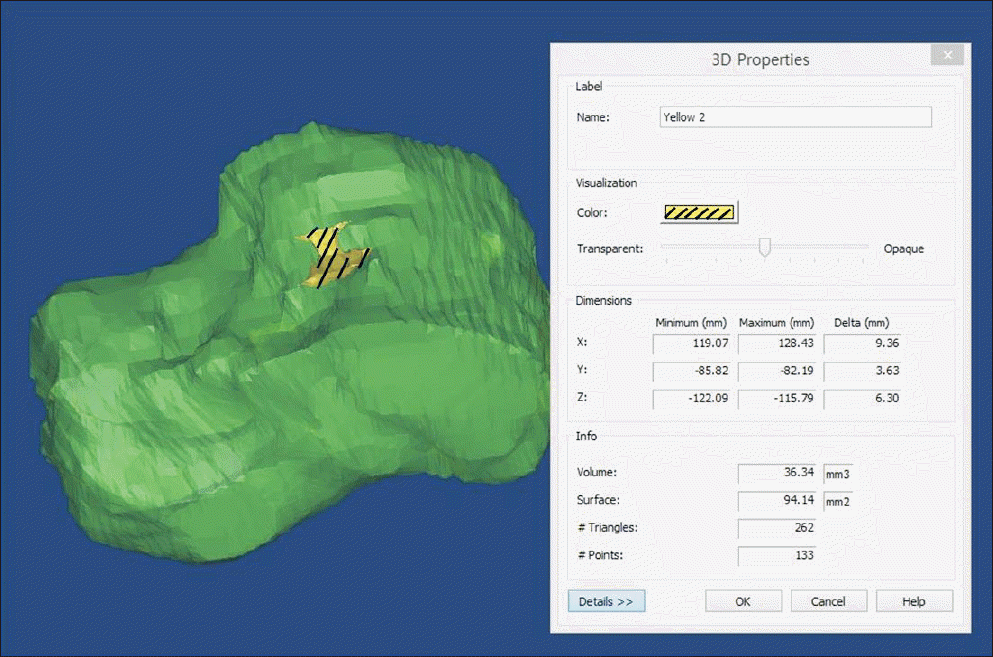
The three-dimensional (3D) image of a talus made by Mimics (Materialise) shows avascular fragment. The area of oblique line is avascular fragment. And we can get the volume and the surface of it from 3D properties.

Figure 3.
The chart shows the frequency of normal, complete avascular necrosis (AVN), and partial AVN. There were 6 partial AVN. Three cases were Hawkins type II and 3 cases were Hawkins type III.

Table 1.
Charateristic of Patients


 PDF
PDF ePub
ePub Citation
 Print
Print


 XML Download