Abstract
Purpose
Restoration of ankle stability through the strengthening exercise of peroneus muscles is considered an important factor for achievement of successful outcomes, in the rehabilitation program following ankle ligament injuries. However, there were few definitive data on normal muscle strength, including eversion power by peroneus muscles. This study was conducted to evaluate the muscle strength of ankle joint measured using an isokinetic dynamometer in normal Koreans.
Materials and Methods
Sixty adults (120 ankles) were recruited and divided into three groups (20 in their twenties, 20 in thirties, and 20 in forties). Each group consisted of 10 males and 10 females. The selection criteria were no history of ankle injury and no evidence of instability. The peak torque, total work, and deficit ratio were measured using the BiodexTM (Biodex Medical Systems). Differences in muscle strength by age, gender and dominant versus non-dominant side were analyzed.
Results
The peak torque of dorsiflexion was average 31.5 Nm at 30o/s of angular velocity and 18.8 Nm at 90o/s; average 69.3 Nm (30o/s) and 42.4 Nm (90o/s) on plantarflexion; average 19.6 Nm (30o/s) and 10.8 Nm (90o/s) on inversion; average 12.9 Nm (30o/s) and 8.0 Nm (90o/s) on eversion. The deficit ratio of strength in women was average 61.1% of men on dorsiflexion; average 66.2% on plantarflexion; average 48.5% on inversion; average 55.4% on eversion. The deficit ratio in non-dominant foot was average 88.6% of dominant foot on dorsiflexion; average 90.1% on plantarflexion; average 85.1% on inversion; average 85.6% on eversion.
Conclusion
The muscle strength of the ankle joint showed a tendency to weaken with age. There were significant differences in muscle strength by gender and dominancy. Further studies for comparison of patients with ankle instability, a comparison between before and after surgery for instability, the correlation between clinical outcomes and the recovery in muscle strength will be needed.
Go to : 
References
1. DiGiovanni CW, Brodsky A. Current concepts: lateral ankle instability. Foot Ankle Int. 2006; 27:854–66.

2. Lentell G, Katzman LL, Walters MR. The relationship between muscle function and ankle stability. J Orthop Sports Phys Ther. 1990; 11:605–11.

3. Bosien WR, Staples OS, Russell SW. Residual disability following acute ankle sprains. J Bone Joint Surg Am. 1955; 37:1237–43.

4. Freeman MA, Dean MR, Hanham IW. The etiology and prevention of functional instability of the foot. J Bone Joint Surg Br. 1965; 47:678–85.

5. Wilkerson GB, Pinerola JJ, Caturano RW. Invertor vs. evertor peak torque and power deficiencies associated with lateral ankle ligament injury. J Orthop Sports Phys Ther. 1997; 26:78–86.

6. Löfvenberg R, Kärrholm J, Sundelin G, Ahlgren O. Prolonged reaction time in patients with chronic lateral instability of the ankle. Am J Sports Med. 1995; 23:414–7.

7. Tropp H. Pronator muscle weakness in functional instability of the ankle joint. Int J Sports Med. 1986; 7:291–4.

8. Baumhauer JF, Alosa DM, Renström AF, Trevino S, Beynnon B. A prospective study of ankle injury risk factors. Am J Sports Med. 1995; 23:564–70.

9. Povacz P, Unger SF, Miller WK, Tockner R, Resch H. A randomized, prospective study of operative and nonoperative treatment of injuries of the fibular collateral ligaments of the ankle. J Bone Joint Surg Am. 1998; 80:345–51.

10. Urguden M, Kizilay F, Sekban H, Samanci N, Ozkaynak S, Ozdemir H. Evaluation of the lateral instability of the ankle by inversion simulation device and assessment of the rehabilitation program. Acta Orthop Traumatol Turc. 2010; 44:365–77.

11. Shon HC, Kim YM, Kim DS, Choi ES, Park KJ, Cho BK, et al. Radiographic measurement of ankle lateral stability in normal Korean adults. J Korean Foot Ankle Soc. 2010; 14:41–6.
12. Levene JA, Hart BA, Seeds RH, Fuhrman GA. Reliability of reciprocal isokinetic testing of the knee extensors and flexors. J Orthop Sports Phys Ther. 1991; 14:121–7.

13. Lord JP, Aitkens SG, McCrory MA, Bernauer EM. Isometric and isokinetic measurement of hamstring and quadriceps strength. Arch Phys Med Rehabil. 1992; 73:324–30.

14. Rosentswieg J, Hinson MM. Comparison of isometric, isotonic and isokinetic exercises by electromyography. Arch Phys Med Rehabil. 1972; 53:249–52.
15. Kang SY, Jang KE. Isokinetic evaluation of the ankle invertors and evertors in the normal young adults. Ann Rehabil Med. 1988; 12:168–74.
16. Marino M, Nicholas JA, Gleim GW, Rosenthal P, Nicholas SJ. The efficacy of manual assessment of muscle strength using a new device. Am J Sports Med. 1982; 10:360–4.

17. Kim JY, Tae SK, Yeo DH, Lee HM, Oh JS. Pre- and postoperative isokinetic strength test in rotator cuff tear. Clin Should Elbow. 2011; 14:179–86.

18. Karnofel H, Wilkinson K, Lentell G. Reliability of isokinetic muscle testing at the ankle. J Orthop Sports Phys Ther. 1989; 11:150–4.

19. Ivey FM Jr, Calhoun JH, Rusche K, Bierschenk J. Isokinetic testing of shoulder strength: normal values. Arch Phys Med Rehabil. 1985; 66:384–6.
20. Lentell G, Cashman PA, Shiomoto KJ, Spry JT. The effect of knee position on torque output during inversion and eversion movements at the ankle. J Orthop Sports Phys Ther. 1988; 10:177–83.

21. Balduini FC, Tetzlaff J. Historical perspectives on injuries of the ligaments of the ankle. Clin Sports Med. 1982; 1:3–12.

22. Andersen H, Jakobsen J. A comparative study of isokinetic dynamometry and manual muscle testing of ankle dorsal and plantar flexors and knee extensors and flexors. Eur Neurol. 1997; 37:239–42.

23. Hwang JH, Kim JM, Lee YT. Isokinetic evaluation of ankle invertor and evertor in patients with chronic ankle sprain. Ann Rehabil Med. 1998; 22:1329–34.
24. Ha KI, Hahn SH, Chung MY, Ryu JW. Analysis of internal rotator-external rotator muscle of the shoulder with Cybex II. J Korean Orthop Assoc. 1987; 22:304–9.

25. Ha KI, Hahn SH, Chung MY, Yu SC. Analysis of the flexor-extensor muscle force of the knee with Cybex II. J Korean Orthop Assoc. 1984; 19:1043–50.
26. Cha SM, Chang BH, Suh JS. Analyses of timing of single heel raise and muscle power after achilles tendon repair. J Korean Orthop Assoc. 2013; 48:96–103.

28. Grace TG, Sweetser ER, Nelson MA, Ydens LR, Skipper BJ. Isokinetic muscle imbalance and knee-joint injuries. A prospective blind study. J Bone Joint Surg Am. 1984; 66:734–40.

29. Cress NM, Peters KS, Chandler JM. Eccentric and concentric force-velocity relationships of the quadriceps feimoris muscle. J Orthop Sports Phys Ther. 1992; 16:82–6.
30. Ashton-Miller JA, Ottaviani RA, Hutchinson C, Wojtys EM. What best protects the inverted weightbearing ankle against further inversion? Evertor muscle strength compares favorably with shoe height, athletic tape, and three orthoses. Am J Sports Med. 1996; 24:800–9.
Go to : 
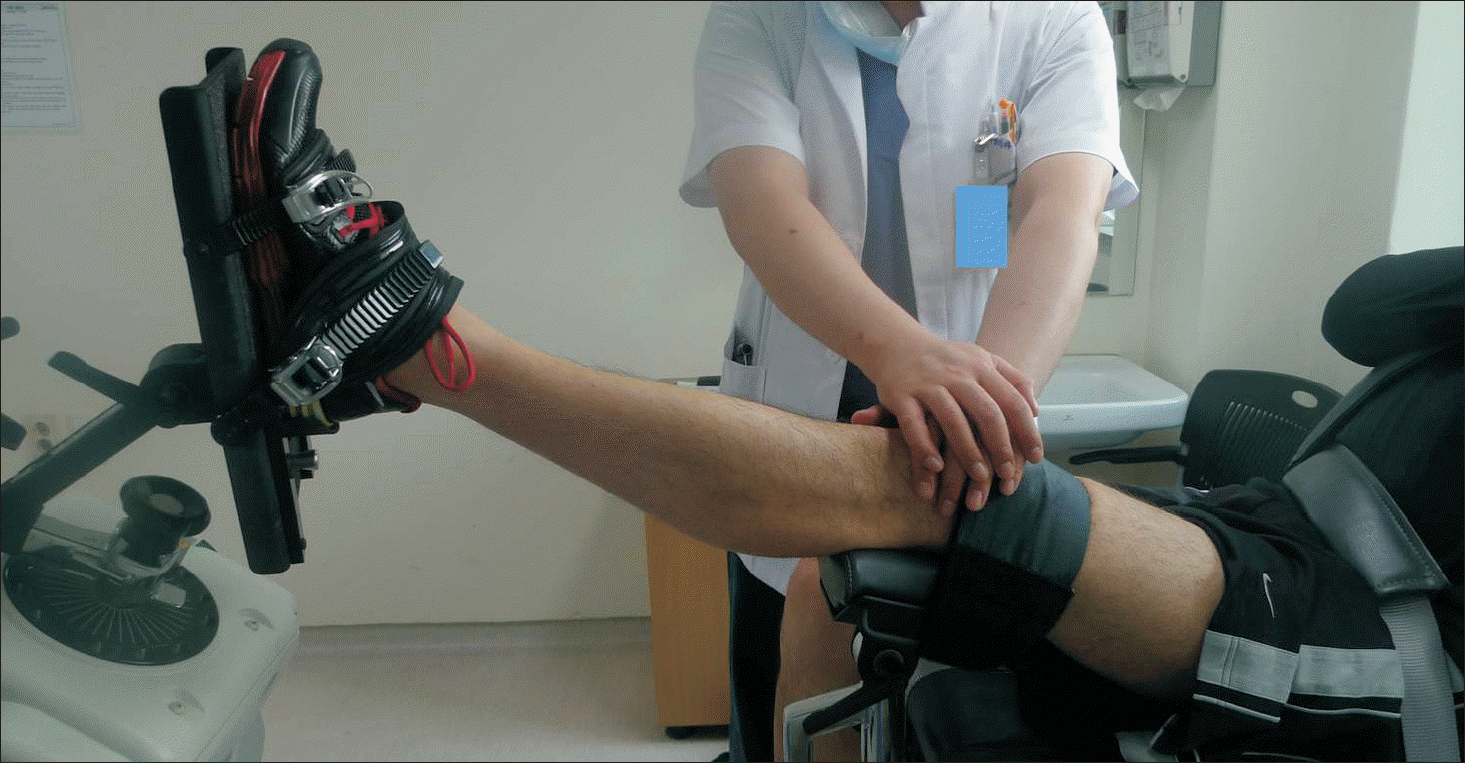
 | Figure 1.Photograph shows the position of subject during the test with the Biodex TM (Biodex Medical Systems) isokinetic dynamometer. The test was performed in sitting position with chest and pelvis fixed by crossed velcro straps. Subject's leg was held with 10o flexed knee, and foot was placed on the input adaptor and foot plate. |
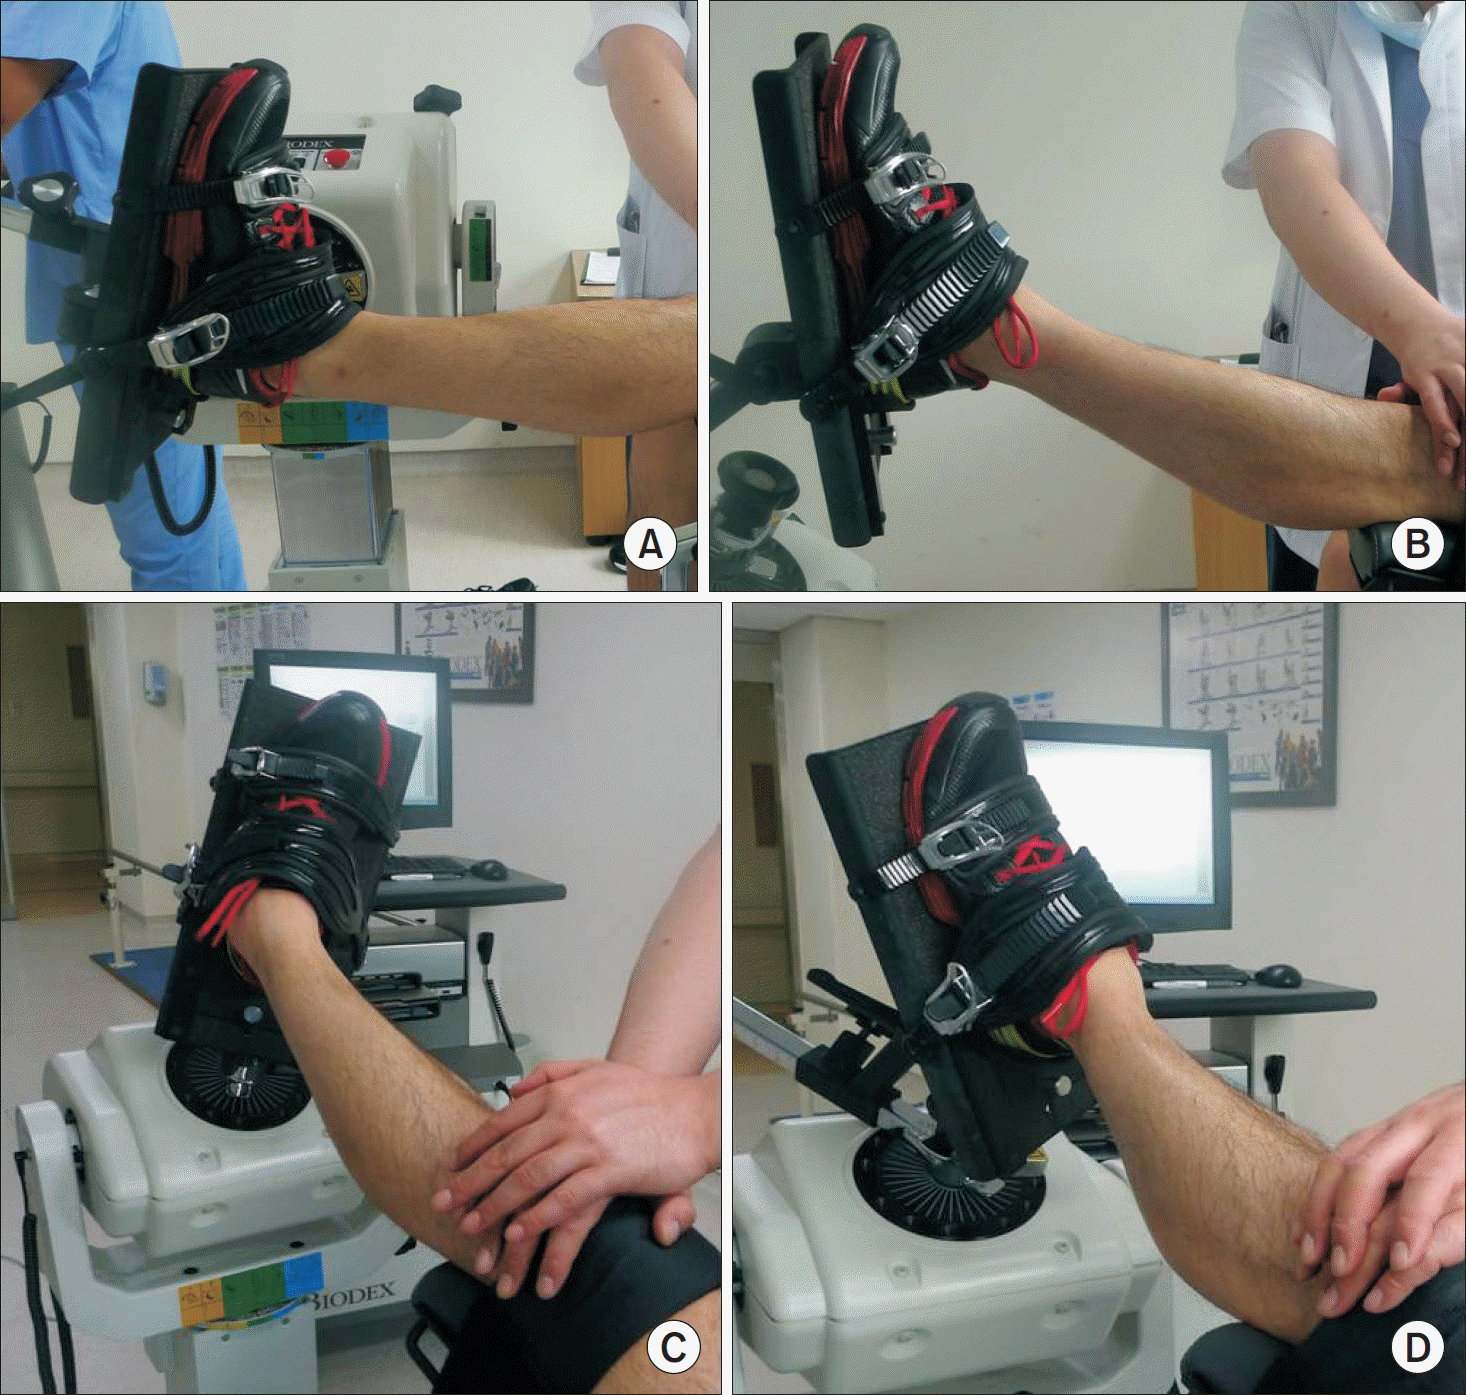
 | Figure 2.Photographs show the measurement of the isokinetic strength for dorsiflexor (A), plantar flexor (B), invertor (C), and evertor (D) muscles. |
Table 1.
Peak Torques (Nm) for Ankle Joint Motion at 30o/s of Angular Velocity in Male
Table 2.
Peak Torques (Nm) for Ankle Joint Motion at 90o/s of Angular Velocity in Male
Table 3.
Peak Torques (Nm) for Ankle Joint Motion at 30 o/s of Angular Velocity in Female
Table 4.
Peak Torques (Nm) for Ankle Joint Motion at 90o/s of Angular Velocity in Female
Table 5.
Comparison of Differences on Peak Torques (Nm) by Age
Table 6.
Comparison of Differences on Peak Torques (Nm) by Sex
Table 7.
Comparison of Differences on Peak Torques (Nm) by Dominancy


 PDF
PDF ePub
ePub Citation
 Print
Print


 XML Download