Abstract
This article presents recent trends and statistical indicators related to mortality in the Republic of Korea by analyzing the 2014 cause-of-death statistics. Specifically, we assessed the number of deaths, the crude death rate, the ranking of causes of death, and trends in the death rate from the major causes of death. Causes of death were classified according to the International Statistical Classification of Diseases and Related Health Problems, 10th revision, as recommended by the World Health Organization. In order to determine the ranking of causes of death, Statistics Korea used the selection list of 56 causes of death from the 80 causes of death list for tabulation mortality statistics recommended by World Health Organization to better fit the Korean situation. The 10 leading causes of death were, in order, cancer, heart disease, cerebrovascular disease, suicide, pneumonia, diabetes mellitus, chronic lower respiratory disease, liver disease, transport accidents, and hypertensive diseases. The top 10 causes of death accounted for 70.5% of all Korean deaths. The ranking of cancer types as causes of death was lung, liver, stomach, colon, and pancreatic cancer. Death rates for heart disease increased from the third in 2013 to the second leading cause in 2014 and the rank of pneumonia moved up from the sixth in 2013 to the fifth in 2014. The mortality rate due to stomach cancer has decreased continuously over time. This finding may reflect changes in Korean society involving population structure, epidemiological patterns, and lifestyles, including dietary habits.
Go to : 
References
1. Statistics Korea. Annual report on the causes of death statistics [Internet]. Daejeon: Statistics Korea;2015. [cited 2016 Feb 9]. Available from:. http://kostat.go.kr/portal/korea/kor_nw/2/6/2/index.board.
2. World Health Organization. International Statistical Classification of Diseases and Related Health Problems 10th revision 2016 [Internet]. Geneva: World Health Organization;2016. [cited 2016 Feb 9]. Available from:. http://apps.who.int/classifications/icd10/browse/2016/en.
3. Statistics Korea. Korean Standard Classification of Diseases and Causes of Death (KCD-6) [Internet]. Daejeon: Statistics Korea;2011. [cited 2016 Feb 9]. Available from:. https://kssc.kostat.go.kr:8443/ksscNew_web/ekssc/main/main.do.
4. Jeon JY, Ko SH, Kwon HS, Kim NH, Kim JH, Kim CS, Song KH, Won JC, Lim S, Choi SH, Jang MJ, Kim Y, Oh K, Kim DJ, Cha BY. Taskforce Team of Diabetes Fact Sheet of the Korean Diabetes Association. Prevalence of diabetes and prediabetes according to fasting plasma glucose and HbA1c. Diabetes Metab J. 2013; 37:349–357.

Go to : 
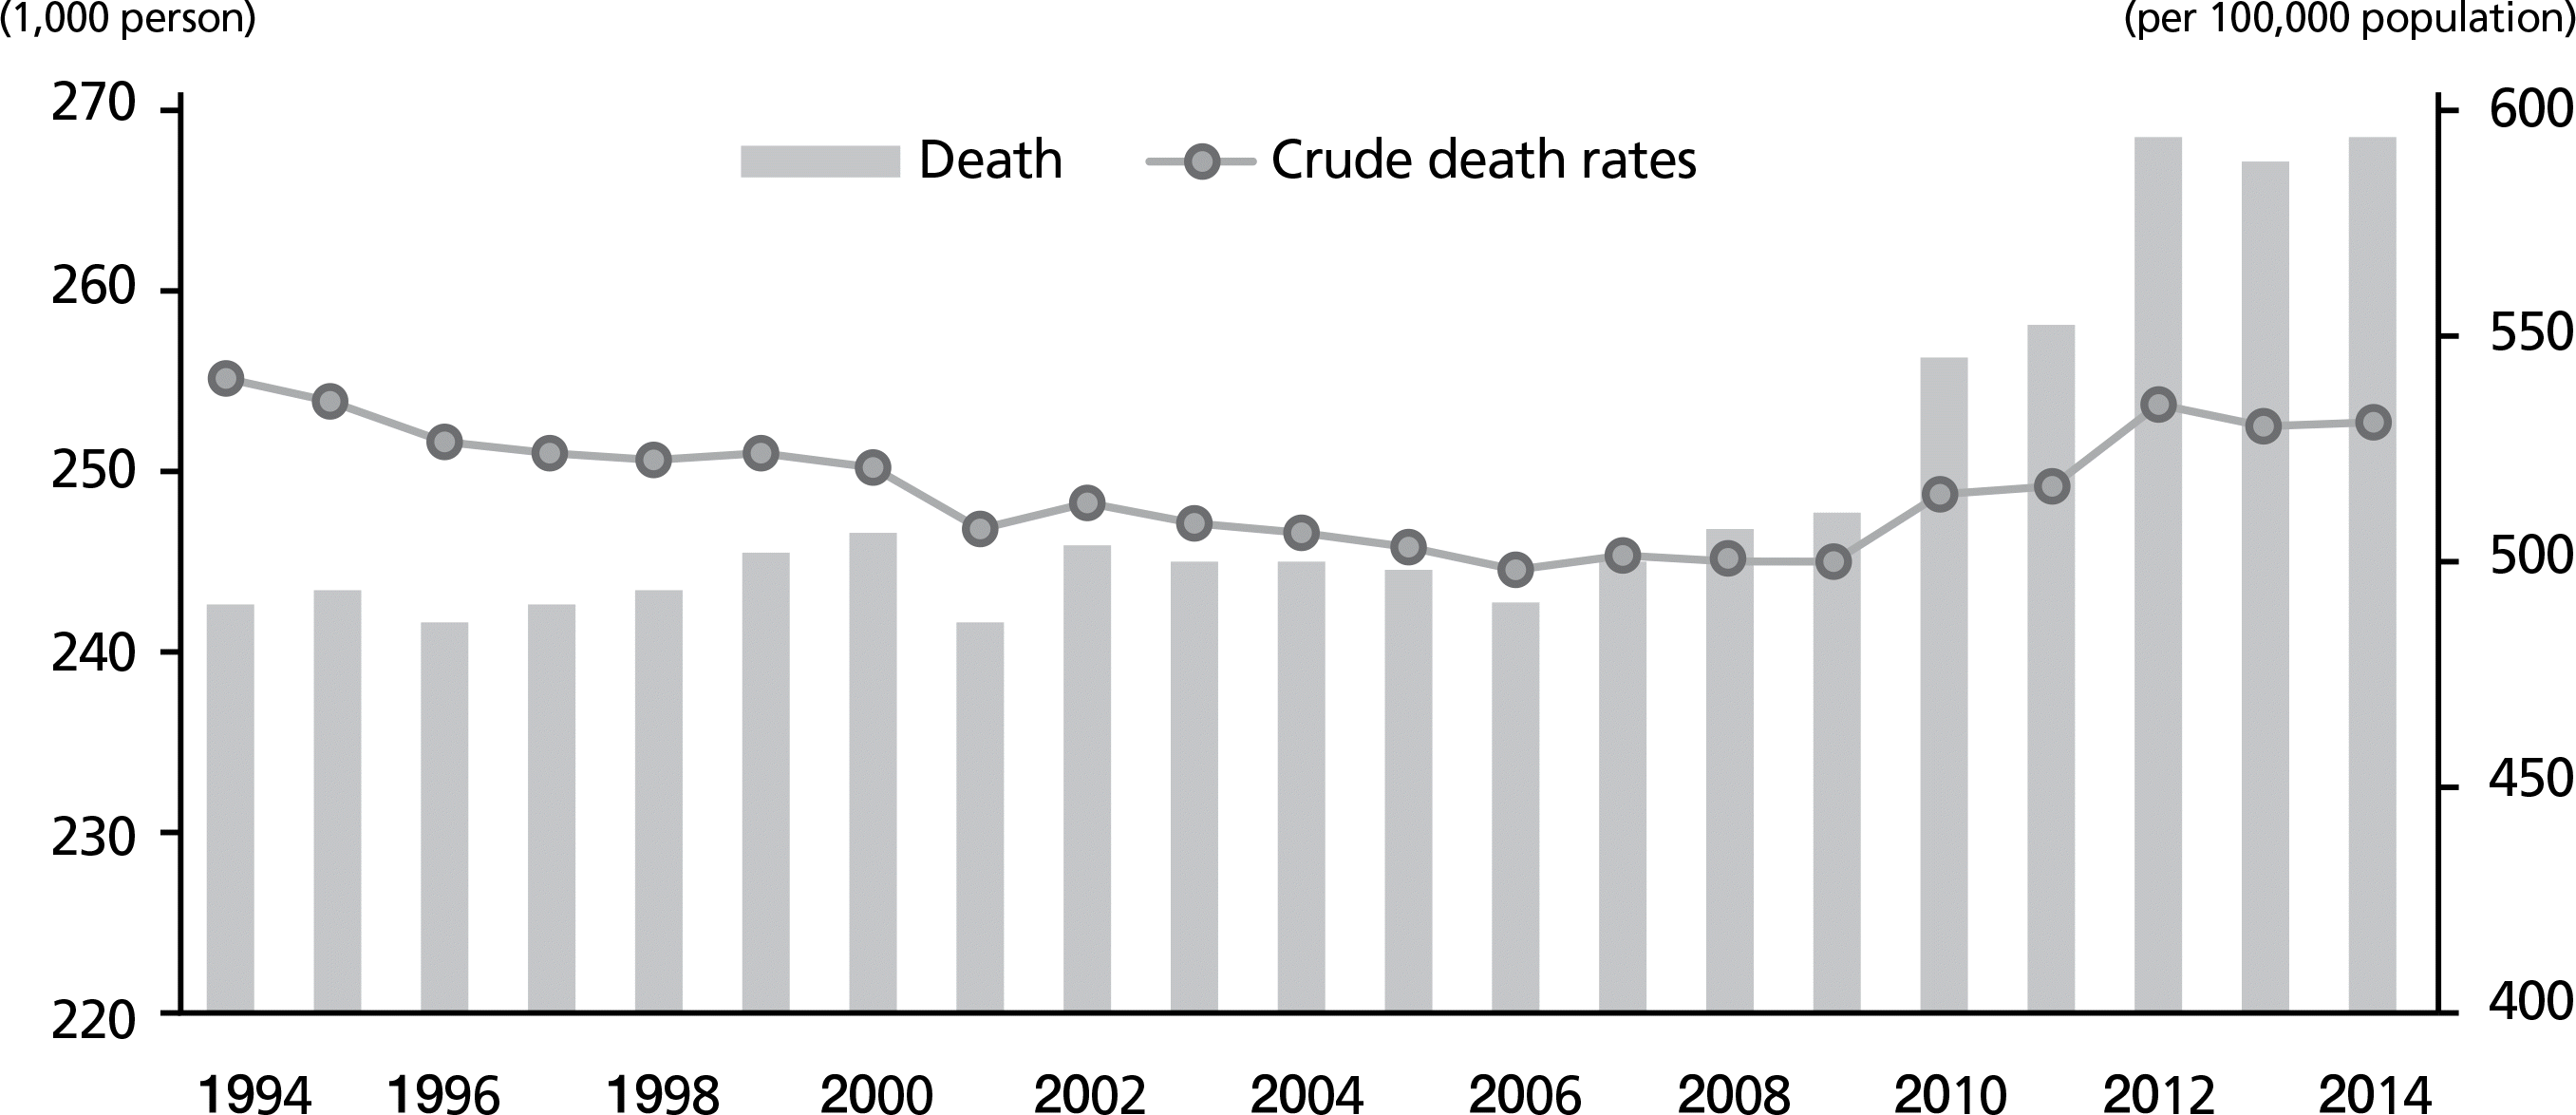 | Figure 1.Trends in the number of deaths and crude death rate from 1994 to 2014 based on annual cause-of-death statistics for the Korean population. |
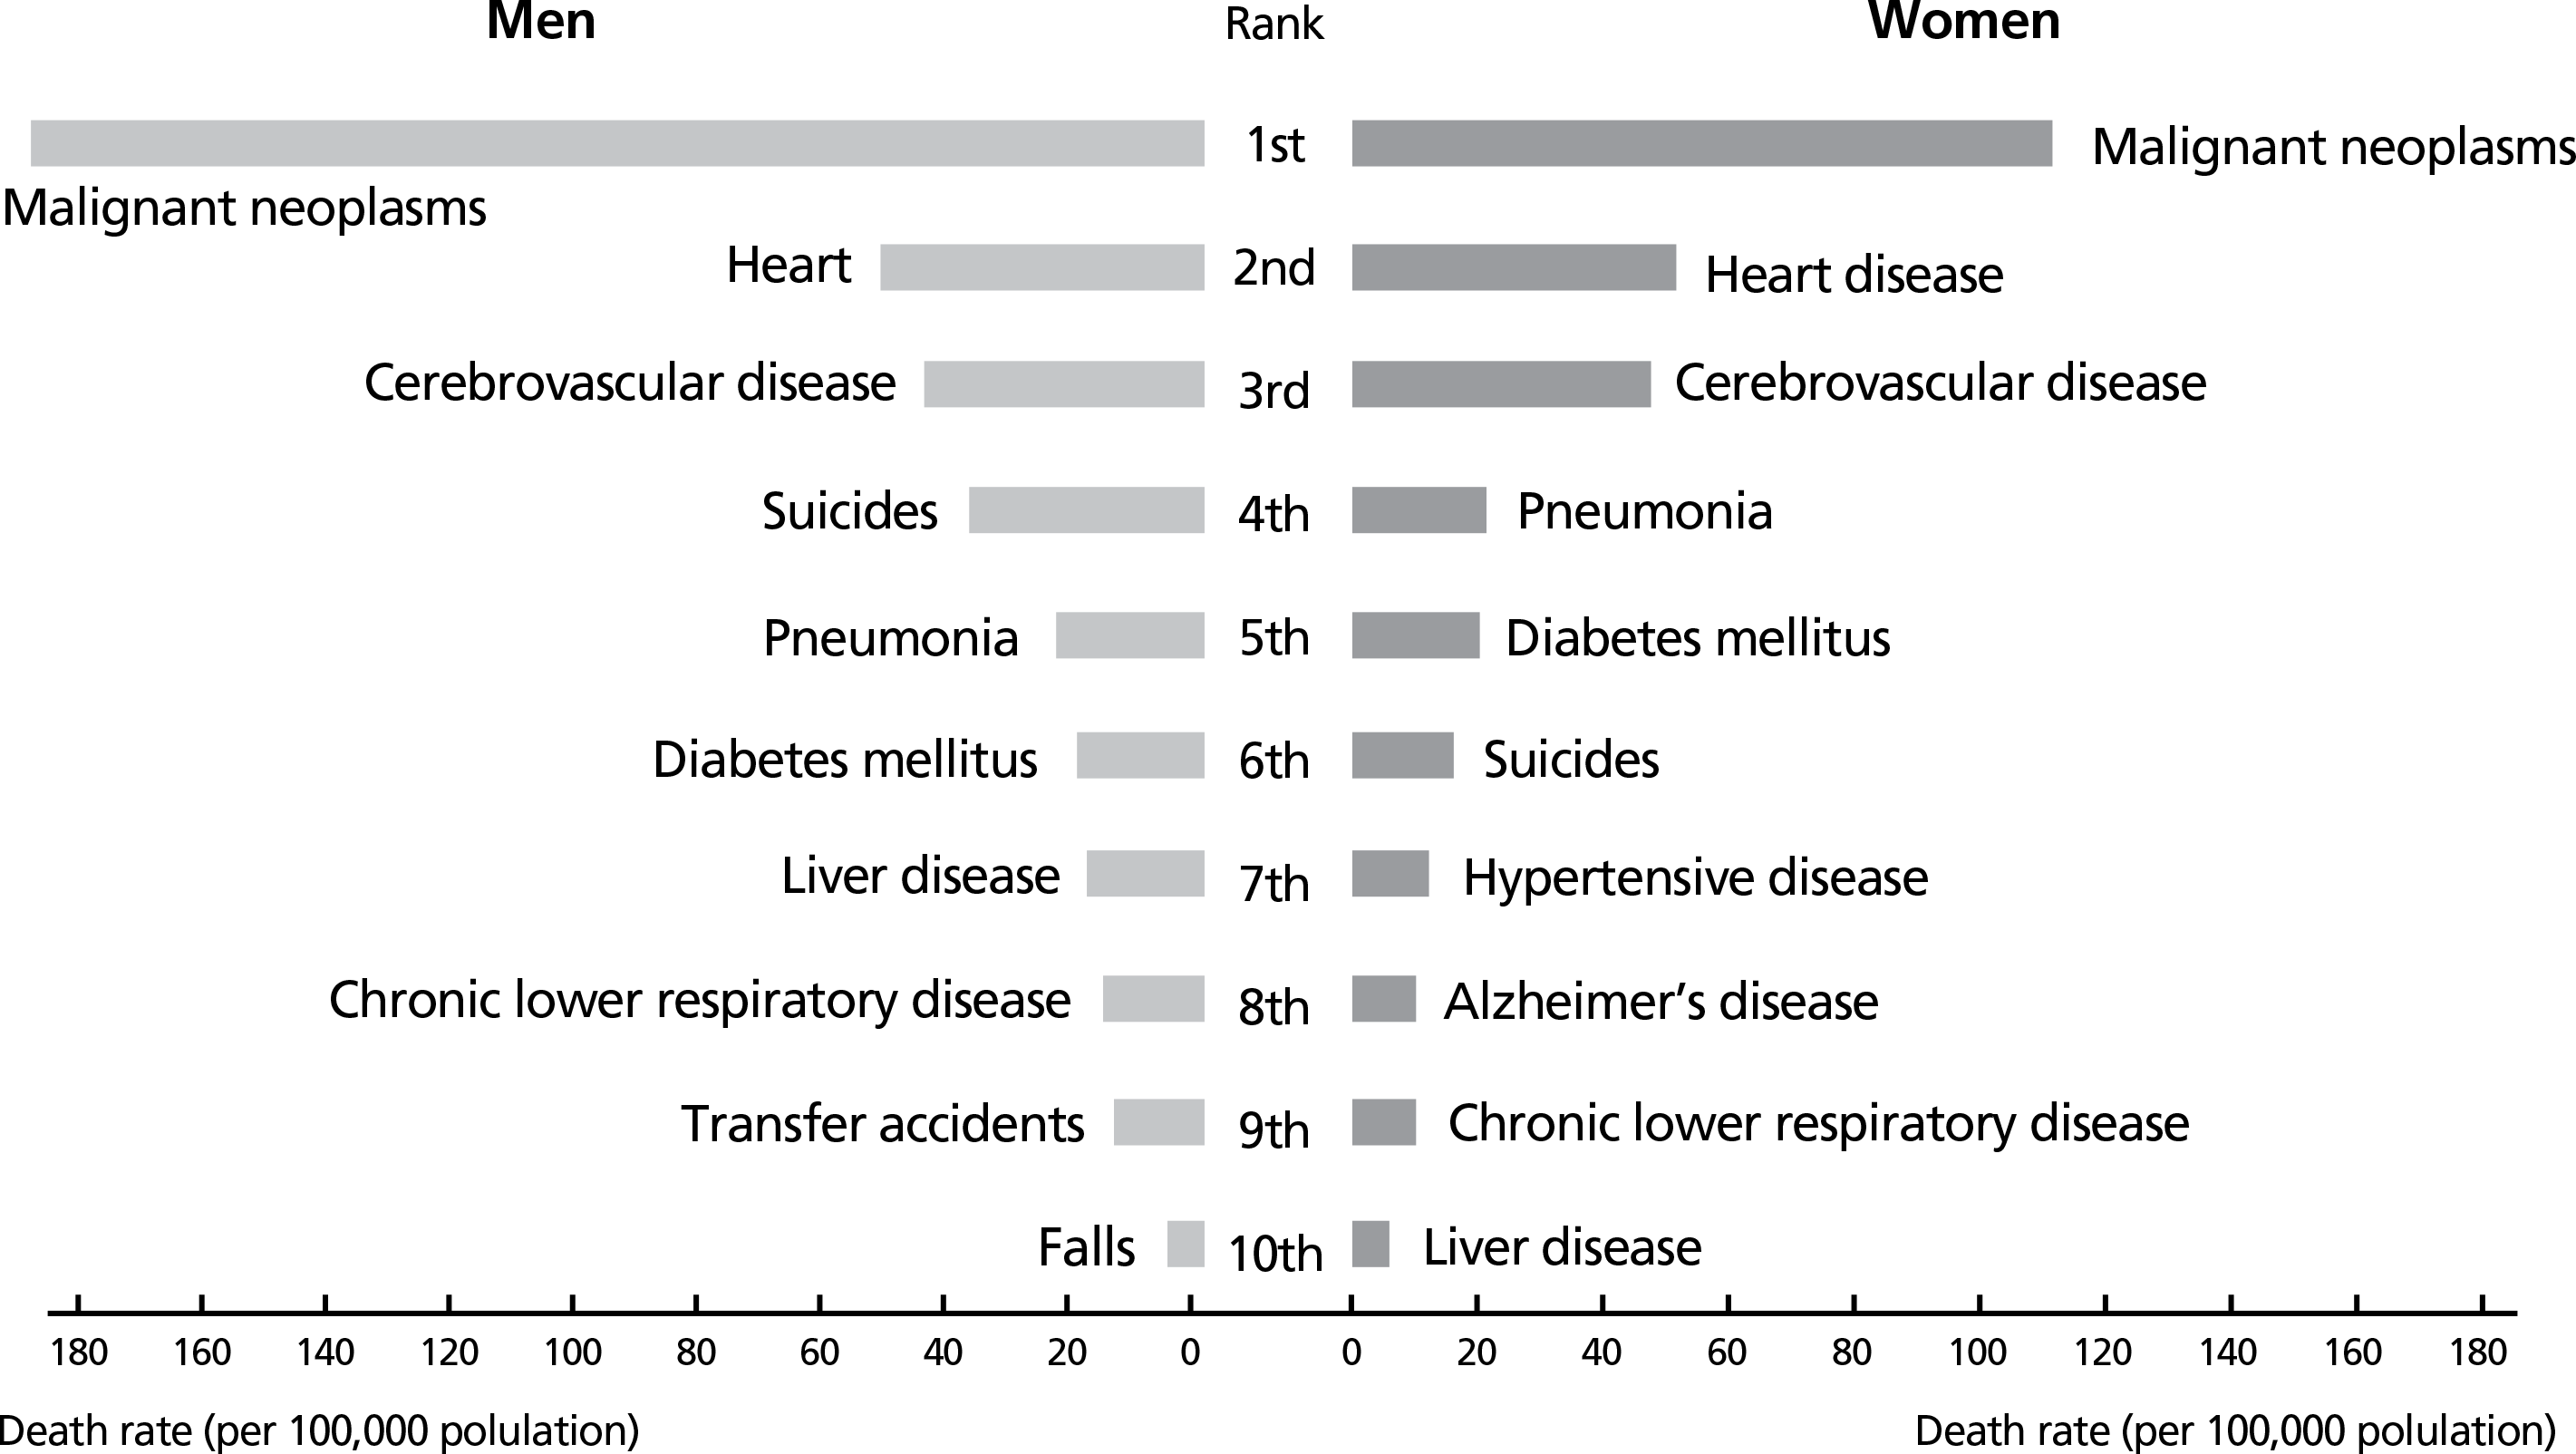 | Figure 2.Leading causes of death by sex in 2014 based on annual cause-of-death statistics for the Korean population. |
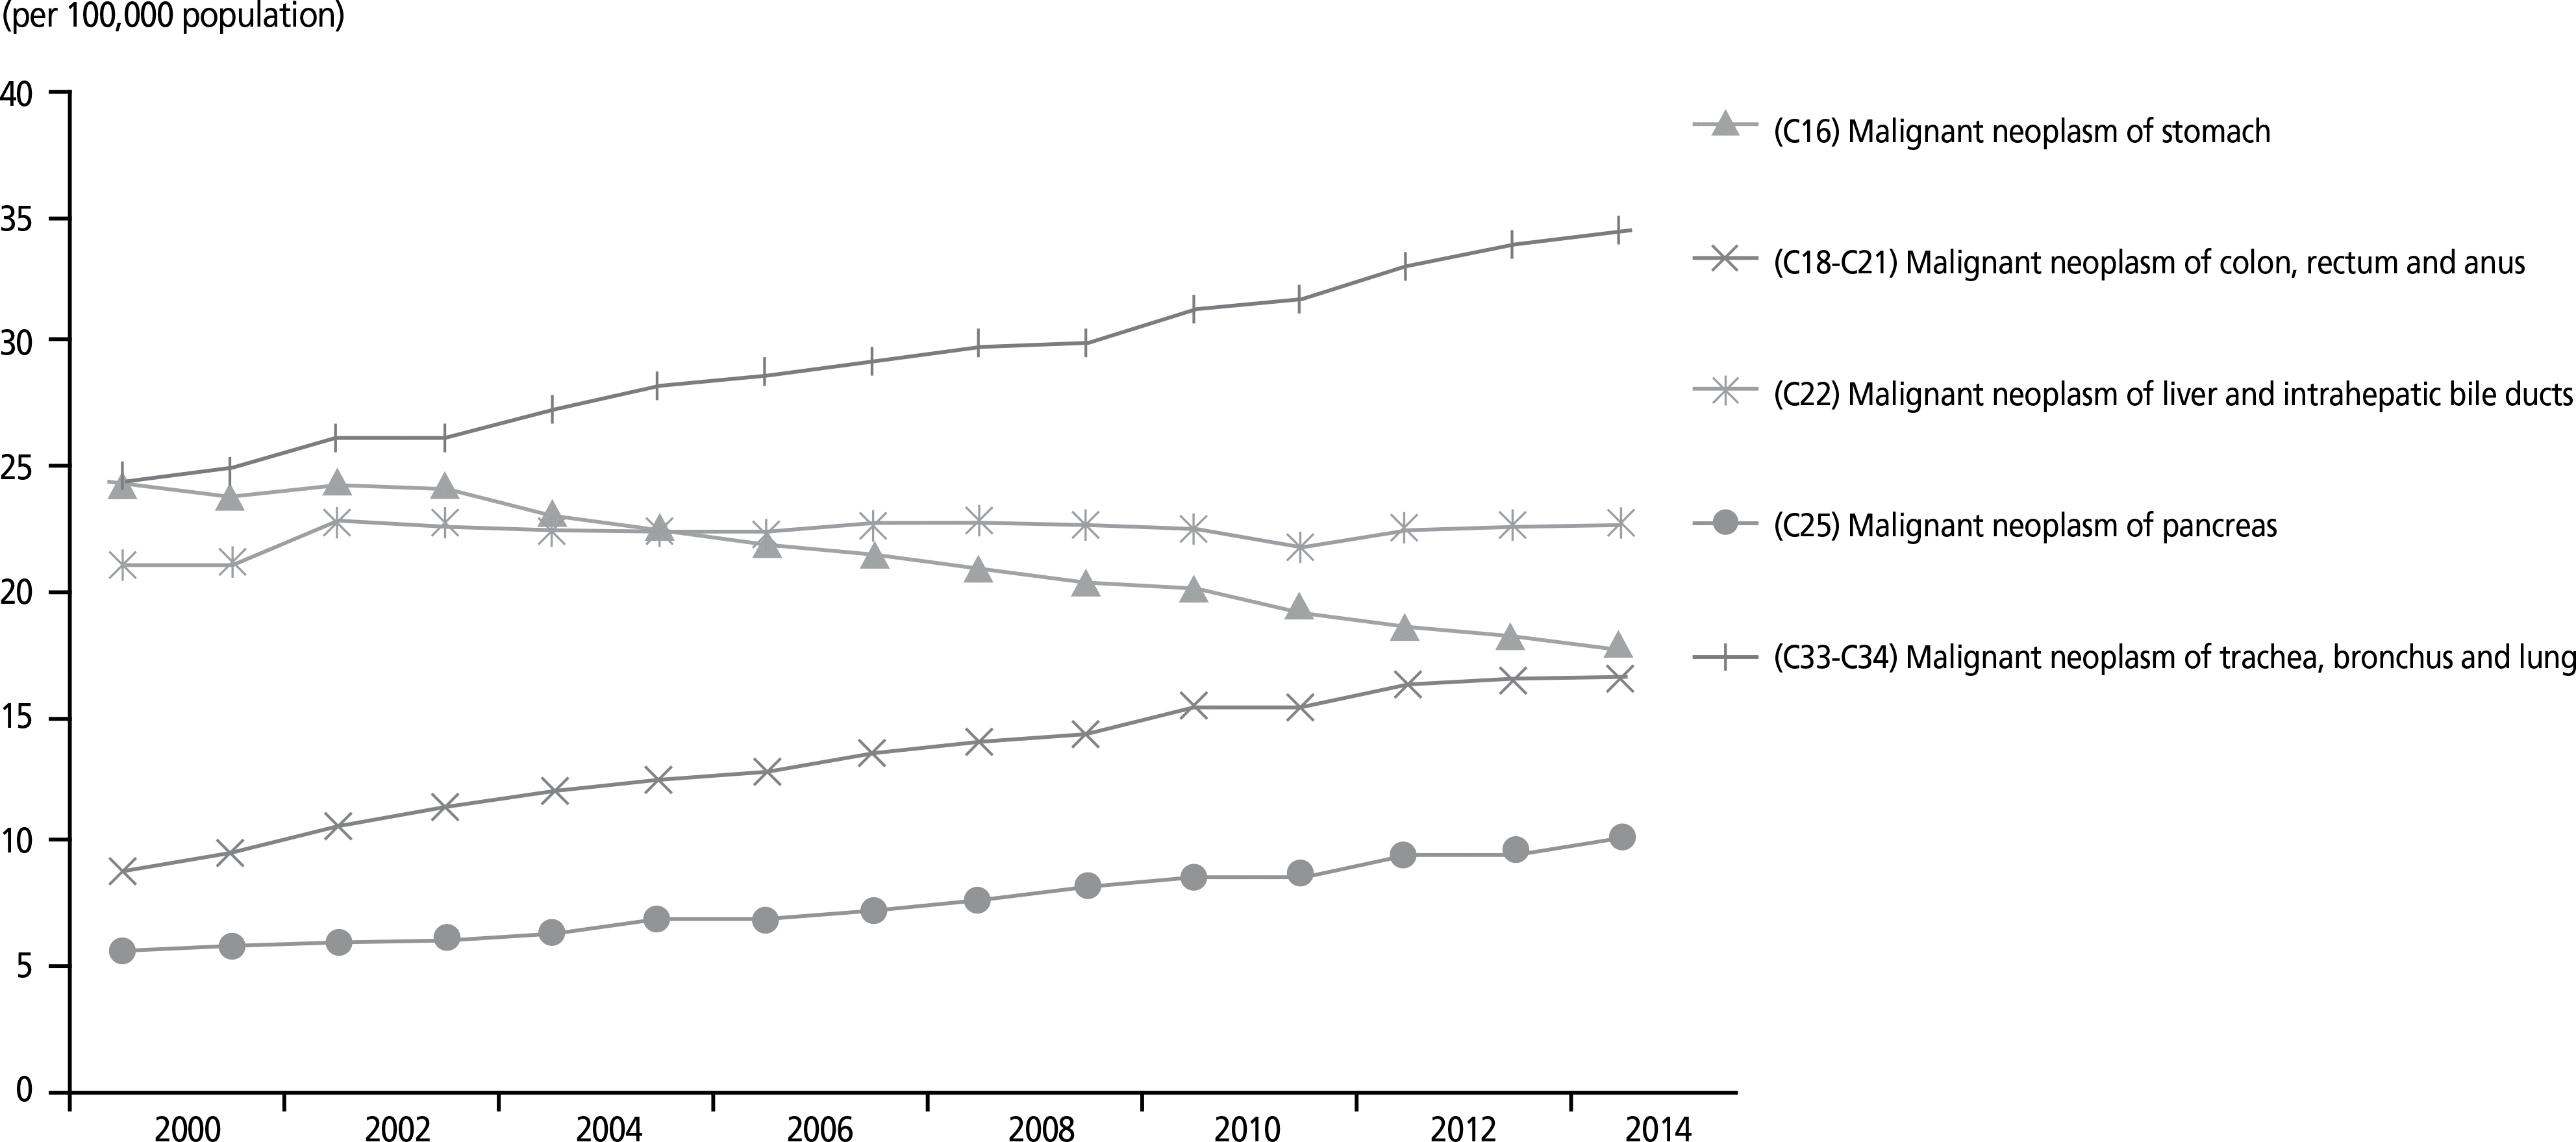 | Figure 3.Trends in the death rate due to the five leading cancers from 2000 to 2014 based on annual cause-of-death statistics for the Korean population. |
 | Figure 4.Trends in the death rate due to cancers by age from 2000 to 2014 based on annual cause-of-death statistics for the Korean population. (A) Malignant neoplasm of stomach, (B) malignant neoplasm of colon, rectum and anus, (C) malignant neoplasm of liver and intrahepatic bile ducts, (D) malignant neoplasm of trachea, bronchus and lung, (E) malignant neoplasm of breast, (F) malignant neoplasm of cervix uteri, and (G) malignant neoplasm of prostate. |
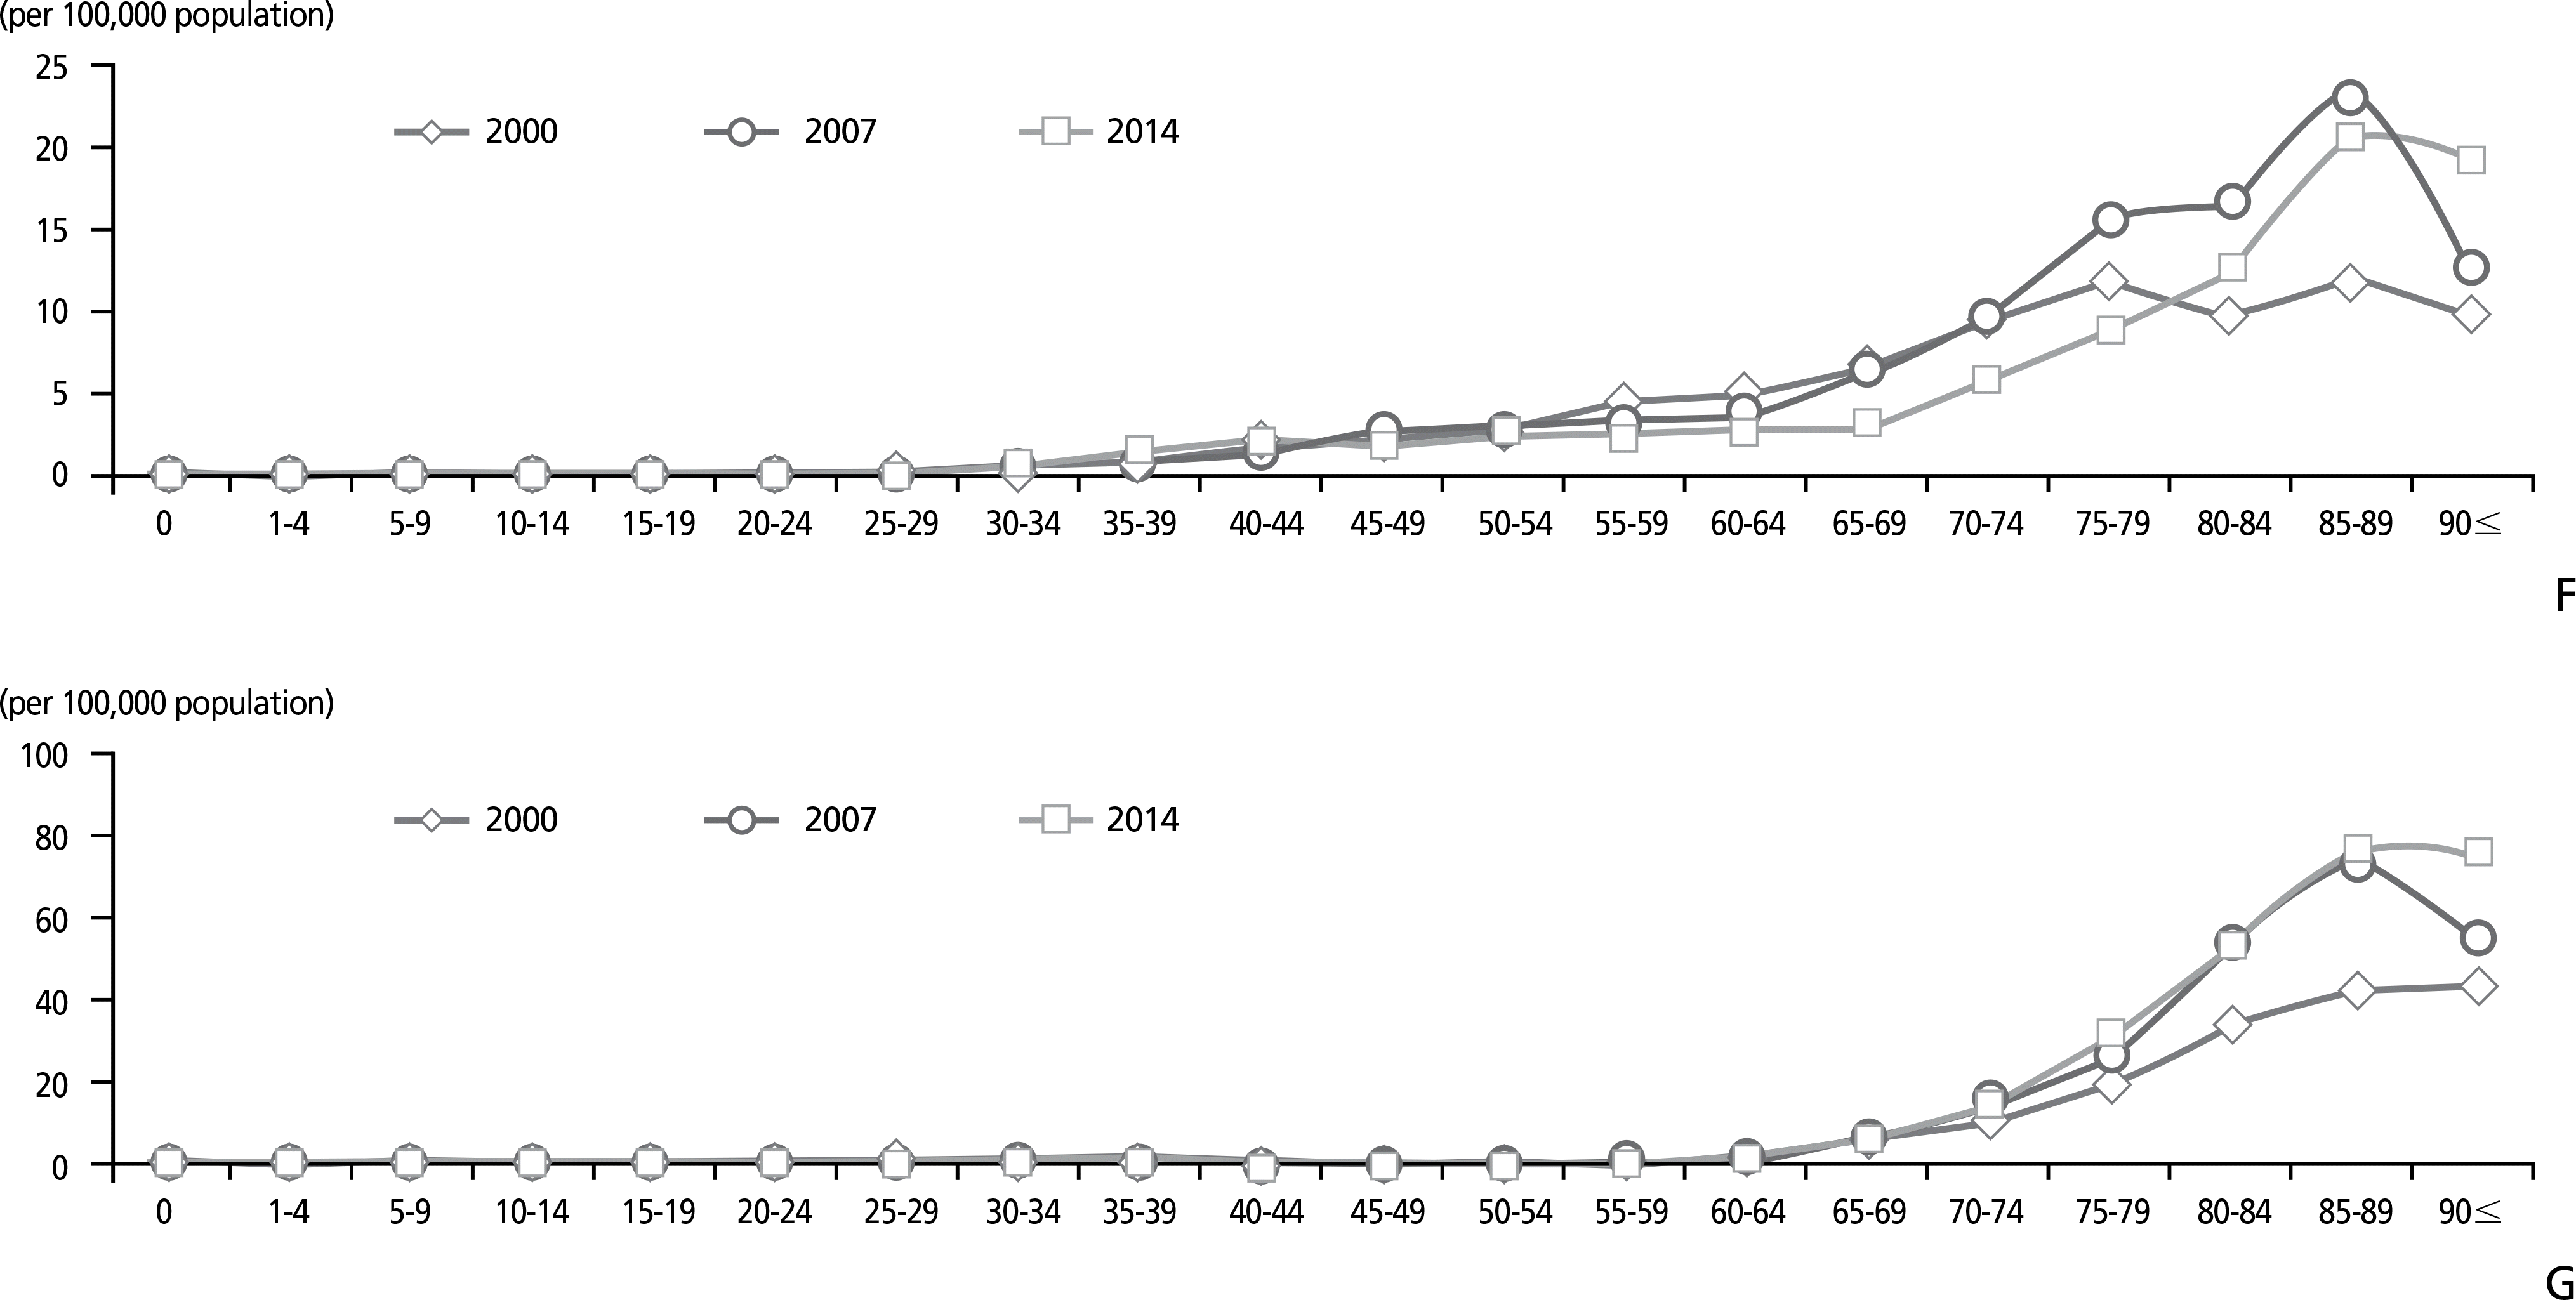 | Figure 4.Trends in the death rate due to cancers by age from 2000 to 2014 based on annual cause-of-death statistics for the Korean population. (A) Malignant neoplasm of stomach, (B) malignant neoplasm of colon, rectum and anus, (C) malignant neoplasm of liver and intrahepatic bile ducts, (D) malignant neoplasm of trachea, bronchus and lung, (E) malignant neoplasm of breast, (F) malignant neoplasm of cervix uteri, and (G) malignant neoplasm of prostate. |
Table 1.
Trends of number of deaths and crude death rates of Korean people from 1990 to 2014
Table 2.
Trends of number of deaths of Korean people by sex and age in 2004, 2013, and 2014
Table 3.
Trends of death rates of Korean people by sex and age in 2004, 2013, and 2014
Table 4.
Trends of leading causes of death of Korean people in 2004, 2013, and 2014
Table 5.
Percentage and death rate of Korean people due to three leading causes by age in 2014
Table 6.
Trends of death rate of Korean people due to cancer by sex in 2004, 2013, and 2014
Table 7.
Trends of death rate of Korean people due to cancer by sex in 2004, 2013, and 2014
Table 8.
Trends of death rate of Korean people due to disease of the circulatory system by sex in 2004, 2013, and 2014
| Disease of the circulatory | Hypertensive disease | Heart disease | Cerebroavascular disease | |||||
|---|---|---|---|---|---|---|---|---|
| Total | Ischemic heart diseasea) | Other heart diseaseb) | ||||||
| Total | 2004 | 119.9 | 10.4 | 36.7 | 26.2 | 10.5 | 70.1 | |
| 2013 | 113.1 | 9.4 | 50.2 | 26.8 | 23.3 | 50.3 | ||
| 2014 | 113.9 | 10.0 | 52.4 | 27.9 | 24.4 | 48.2 | ||
| From 2013 | Change | 0.8 | 0.6 | 2.2 | 1.1 | 1.1 | –2.1 | |
| Percentage change | 0.7 | 6.5 | 4.4 | 4.1 | 4.8 | –4.2 | ||
| Male | 2004 | 114.7 | 6.9 | 38.5 | 27.9 | 10.6 | 66.5 | |
| 2013 | 107.2 | 5.9 | 49.9 | 28.3 | 21.6 | 47.8 | ||
| 2014 | 108.4 | 6.0 | 52.3 | 29.5 | 22.8 | 46.6 | ||
| From 2013 | Change | 1.2 | 0.1 | 2.4 | 1.2 | 1.3 | –1.2 | |
| Percentage change | 1.1 | 1.0 | 4.9 | 4.2 | 5.8 | –2.6 | ||
| Female | 2004 | 125.1 | 13.8 | 34.9 | 24.5 | 10.3 | 73.8 | |
| 2013 | 119.0 | 12.8 | 50.4 | 25.4 | 25.1 | 52.8 | ||
| 2014 | 119.4 | 14.0 | 52.4 | 26.4 | 26.0 | 49.9 | ||
| From 2013 | Change | 0.4 | 1.2 | 2.0 | 1.0 | 1.0 | –3.0 | |
| Percentage change | 0.3 | 9.1 | 3.9 | 4.0 | 3.9 | –5.6 | ||
| Sex ratio (male/ female) | 2004 | 0.92 | 0.50 | 1.10 | 1.14 | 1.02 | 0.90 | |
| 2013 | 0.90 | 0.46 | 0.99 | 1.11 | 0.86 | 0.91 | ||
| 2014 | 0.91 | 0.43 | 1.00 | 1.12 | 0.88 | 0.93 | ||
Table 9.
Trends of death rate of Korean people due to diseases of the circulatory system by age in 2013 and 2014
| Age (yr) | 2013 | 2014 | Hypertensive disease |
Heart disease |
Cerebroavascular disease | ||
|---|---|---|---|---|---|---|---|
| Total | Ischemic heart diseasea) | Otherb) disease heart | |||||
| Total | 113.1 | 113.9 | 10.0 | 52.4 | 27.9 | 24.4 | 48.2 |
| 0 | 5.6 | 4.0 | – | 3.6 | – | 3.6 | 0.2 |
| 1–9 | 0.7 | 0.7 | – | 0.6 | – | 0.6 | 0.1 |
| 10–19 | 1.1 | 0.9 | – | 0.5 | 0.0 | 0.5 | 0.3 |
| 20–29 | 2.3 | 2.3 | – | 1.5 | 0.3 | 1.3 | 0.7 |
| 30–39 | 7.3 | 7.6 | 0.2 | 4.2 | 2.0 | 2.2 | 3.0 |
| 40–49 | 23.4 | 23.2 | 0.3 | 12.2 | 5.7 | 6.4 | 10.1 |
| 50–59 | 55.4 | 54.4 | 1.5 | 29.3 | 16.4 | 13.0 | 22.1 |
| 60–69 | 139.8 | 137.2 | 5.3 | 67.1 | 38.1 | 29.0 | 59.8 |
| 70–79 | 571.2 | 533.9 | 33.7 | 234.6 | 130.5 | 104.1 | |
| 80≤ | 2,398.7 | 2,311.1 | 299.8 | 1,027.2 | 534.1 | 493.1 | 925.1 |


 PDF
PDF ePub
ePub Citation
 Print
Print


 XML Download