

 PDF
PDF ePub
ePub Citation
 Print
Print


Introduction
Deoxynivalenol (DON, vomitoxin) is a type B trichothecene mycotoxin that's predominantly produced by Fusarium graminearum and F. culmorum during growth on crops [27, 34]. Fusarium spp. are the most prevalent toxin-producing fungi in the northern regions of America, Europe and Asia [5]. Since DON is highly stable during the storage, processing and cooking of food, and even at high temperatures, human and animals can be exposed at high levels of DON [29]. Growth retardation and immune suppression are the major toxic effects induced by DON ingestion in farm animals [15,36]. High doses of DON cause feed refusal, emesis, skin irritation, hemorrhage and decreased weight gain [20]. At the cellular level, DON toxicity is induced via the inhibition of protein synthesis by its binding to ribosomes and its interference with the activity of peptidyltransferase [2,30]. Analyzing DON in grains or feed and the clinical signs such as gastroenteritis and feed refusal have been used for the diagnosis of DON intoxication [22]. Suppression of the normal immune function and superinduction of proinflammatory cytokines have been also suggested as supplementary tools for making a diagnosis, but determining the critical parameters for making a rapid diagnosis and exposure assessment are currently limited [13,27].
A biomarker is defined as any substance, structure or process that can be measured in the body and it influences or predicts the incidence of disease [35]. For example, DNA adducts and some enzymes such as sulfotransferase A1 and epoxide hydroxylase have been validated and used as biomarkers for cancer detection [32]. The current advances in proteomics technology enable the identification of specific biomarkers from complex biological specimens [28]. Protein chip technology has been regarded as one of the powerful tools for the identification of potential biomarkers against a variety of diseases, including tumors and diabetes, and the protein chip platform has been designed for more rapid profiling and identification of proteins [37].
In this study, we searched for a sensitive biomarker for DON intoxication based on the profiles of the differential protein expression in blood plasma by using Surface Enhanced Laser Desorption/Ionization - Time of Flight/Mass Spectrometry (SELDI-TOF/MS) in combination with the immunoglobulins (Igs) in the serum.
Materials and Methods
Animals
B6C3F1 male mice (8 weeks old) and Wistar male rats (7 weeks old) were purchased from Charles River (Japan) and they were acclimatized to the SPF mouse and rat rooms for 1 week. The mice and rats were fed commercial γ-irradiated pellets (Purina, Korea) and UV sterilized water ad libitum. Each animal room was maintained at 23 ± 2℃ (relative humidity 50 ± 10%) and a 12-h light/dark cycle. The animal housing and the experiment were performed according to the Code of Laboratory Animal Welfare Ethics, National Veterinary Research and Quarantine Service, Korea.
Chemicals and animal treatment
DON, aflatoxin B1 (AFB1) and zearalenone (ZEA) were purchased from Sigma-Aldrich (USA) and these were dissolved in distilled water for DON and in corn oil for AFB1 and ZEA. In the experiment of mice treated with DON, DON was diluted to doses of 0.83, 2.5 and 7.5 mg/kg body weight (bw) and these doses were administered orally at 10 ml/kg bw via gavage once per day for 8 days to the mice. In the experiment of rats treated with DON, AFB1 or ZEA, rats were orally administered with DON 7.5, AFB1 1.0 or ZEA 240 mg/kg bw via gavage once per day for 8 days. The next day of the last administration, the mice or rats were anesthetized with diethylether and their blood was collected via abdominal vein and it was transferred to a vessel for the serum and to an EDTA-containing vessel for the plasma. The serum and plasma were separated by centrifugation at 12,000 × g for 15 min and they stored at -80℃ until performing the protein profiling and Igs assay.
Protein profiling of the blood plasma protein on the protein chip arrays
The blood plasma of the mice was diluted with lysis buffer (Urea 9.5 M, CHAPS 2% and DTT 1%) and its protein content was adjusted to 5 mg/ml. For the hydrophobic protein profiling, binding of the proteins onto the surface of chip (H50; Ciphergen Biosystems, USA) was conducted in a deep-well type assembly (Bioprocessor assembly; Ciphergen Biosystems, USA). The chip surface was activated twice by 50 µl of 50% acetonitrile for 5 min each time and then twice for 5 min each time by 150 µl of binding buffer (0.1% trifluoroacetic acid in 10% acetonitrile). Twenty µl of the plasma (5 mg protein/ml) was mixed with 80 µl of binding buffer and then this was applied to each spot on a H50 chip. The chip was incubated for 30 min with shaking at room temperature. Each spot was washed three times with 150 µl of binding buffer and once with 150 µl of distilled water for 5 min. For the profiling assay of the copper immobilized proteins, the anionic proteins, the strong or weak cationic proteins and the normal phased proteins, copper immobilized (IMAC30), anionic (Q10), cationic (CM-high and CM-low) and a normal phase (NP20) protein chip (Ciphergen Biosystems, USA) was used, respectively, and each activation and the binding buffer that were used for each protein chip were applied with following the same steps as for the hydrophobic protein profiling. All of the chips were washed after the sample reacted and they were completely air-dried and then treated twice with 1 µl saturated sinapinic acid in 50% acetonitrile and 0.5% trifluoroacetic acid. After complete air-drying, the chip was inserted into the Protein Biology Mass Specrtometry System (SELDI-TOF/MS; Ciphergen Biosystems, USA) for determining the mass peaks (time of flight) at a laser intensity of 215 and a detected ion sensitivity of 9. All the data was normalized by the total ion current and then significant mass peaks compared to those of vehicle control were selected by biomarker wizard programme (version 3.0; Ciphergen Biosystems, USA) and the height or area of the selected mass peaks was compared between each group.
Purification and identification of hydrophobic proteins as biomarker candidates
The blood plasma was diluted to 5 mg protein/ml with adsorption buffer (1 M ammonium sulfate and 50 mM sodium phosphate, pH 7.0). Before the application of the plasma sample, a column (Methyl Ceramic HyperD F column; Ciphergen Biosystems, USA) was equilibrated twice with 200 µl of adsorption buffer. 500 µl of the diluted plasma sample (5 mg protein/ml) was added to the column and hydrophobic protein in the sample was allowed to bind for 30 min at room temperature. After the column was spun in a microcentrifuge, 500 µl of elution buffer (50 mM sodium phosphate pH 7.0) was applied for 10 min for four times each and the fraction of hydrophobic protein was eluted by centrifugation and the eluted fraction obtained at each centrifugation was combined in one vessel. 2 µl of the eluted fractions was applied to a gold chip to confirm that the targeted protein was fractionated by the mass peak analysis via SELDI-TOF/MS. Two ml of the eluted fraction was concentrated 20-fold to 100 µl with using a spin column that was designed for collecting materials with a mass range of 10,000~30,000 and then desalting them (VivaSpin6; VivaScience, Germany). Two µl of the concentrated fraction was then applied to a gold chip in order to reconfirm that the candidate protein with a targeted mass peak was collected by SELDI-TOF/MS analysis. The concentrated fraction of the protein was separated by 12% SDS-PAGE at 80 volts and it was visualized by Coomassie-blue staining [37]. The band of SDS-PAGE gel containing the target protein was excised and then the protein was digested with trypsin. The digested polypeptides were analyzed by LC/Q-TOF (Thermo, USA) and a MALDI-TOF mass spectrometer (Applied Biosystems, USA) and then the candidate protein was identified with the Mascot and ProFound protein web search engine (Matrix Science , USA).
Western blotting for confirming the identified biomarker protein
Twelve µl of the concentrated fraction obtained after column separation of the control mouse plasma or the DON-administered mouse plasma was mixed with 3 µl of sample buffer (0.5 M Tris-HCl pH6.8, 10% glycerol, 10% SDS, 5% 2-mercaptoethanol and 1% bromophenol blue), and this was heated at 95℃ for 5 min and then loaded on the 12% SDS-PAGE. After electrophoretic running at 80 volts, the protein bands were transferred to a polyvinylidene difluoride (PVDF) membrane for 2 h at 100 volts and the membranes were blocked with blocking buffer (PBS buffer containing 0.05% Tween 20 and 7% fat free skim milk). The PVDF membrane was incubated for 2 h in 5 µl of chicken polyclonal primary antibody to haptoglobin diluted 1 : 1,400 along with 7 ml of blocking buffer. After three washes with washing buffer containing 0.05% Tween 20 in PBS for 5 min each time, the membrane was incubated for 1 h in 2 µl of secondary antibody conjugated to alkaline phosphatase diluted 1 : 3,500 in 7 ml of blocking buffer. After five washes, the specific plasma protein was visualized by adding 5-bromo-4-chloro-3-indolyl phosphate/nitroblue tetrazolium as substrate for alkaline phosphatase.
Quantitative validation by ELISA
The amount of haptoglobin in the blood plasma of the mice was quantified with using a mouse haptoglobin ELISA kit (Immunology Consultants, USA). The sample was diluted 1 : 10,000 in diluent (PBS containing BSA, 0.25% Tween and 0.1% Proclin 300). 100 µl of the diluted sample or each dose standard was added to each well that was coated with purified anti-mouse haptoglobin and this was incubated for 15 min at 22℃. Following four aspirations and washings with washing buffer (PBS containing 0.5% Tween), 100 µl of diluted (1 : 100) anti-mouse haptoglobin antibodies conjugated with horseradish peroxidase was added to each well and this was incubated at room temperature for 15 min. After four washes, 100 µl of chromogenic substrate solution containing 3,3',5,5'-tetramethylbenzidine (TMB) and hydroperoxide in citric acid buffer (pH 3.3) was added to each well. After incubation at room temperature for 10 min, the concentration of haptoglobin was measured at 450 nm.
Comparison of the haptoglobin expressions induced by DON, AFB1 and ZEA
To confirm if haptoglobin is a specific biomarker for DON intoxication and exposure as compared with the other mycotoxins AFB1 and ZEA, the level of haptoglobin in the plasma of male rats (8 weeks old, Wistar; Charles River, Japan) that were orally administered AFB1 1.0, ZEA 240 or DON 7.5 mg/kg bw for 8 days was measured by using a mouse haptoglobin ELISA kit (Immunology Consultants, USA).
Determination of the immunoglobulins levels in the serum of the mice and rats
The levels of immunoglobulins in the serum of the mice and rats were quantified with using an ELISA Quantitation Kit (Bethyl Lab, USA). 100 µl of goat anti-mouse or goat anti-rat IgG affinity purified antibody that was diluted 1 : 100 with coating buffer (0.05 M carbonate-bicarbonate, pH 9.6) was coated onto each well for 60 min at room temperature. Each well was washed three times with washing solution (50 mM Tris, 0.14 M NaCl and 0.05% Tween 20, pH 8.0) and the wells were blocked with blocking (postcoat) solution (50 mM Tris, 0.14 M NaCl and 1% BSA, pH 8.0) for 30 min at room temperature. The serum sample was diluted (1 : 1,000 for IgA and IgM and 1 : 10,000 for IgG) in sample diluent (50 mM Tris, 0.14 M NaCl, 1% BSA and 0.05% Tween 20, pH 8.0). 100 µl of the diluted or non-diluted serum sample and each dose standard were then added into each well and this was incubated for 60 min at room temperature. After five aspirations and washes, 100 µl of the goat anti-mouse or goat anti rat Ig antibodies conjugated with horseradish peroxidase and diluted (1 : 50,000 for IgG, 1 : 40,000 for IgA, 1 : 100,000 for IgM and 1 : 20,000 for IgE) with the conjugate diluent (50 mM Tris, 0.14 M NaCl, 1% BSA and 0.05% Tween 20, pH 8.0) was added to each well and this was incubated for 60 min at room temperature. Following five washings, 100 µl of the substrate solution containing the TMB peroxidase substrate and peroxidase solution was added to each well and this was incubated for 30 min at room temperature. To stop the TMB reaction, 100 µl of 2 M H2SO4 was applied to each well and the levels of the Igs were measured at 450 nm.
Results
Plasma protein profiling
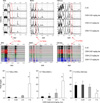
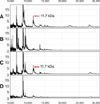
The protein profiles of the plasma of the mice that were administered with DON were acquired by the protein chip arrays of the CM-high, CM-low, Q10, H50, IMAC30 and NP20 ProteinChips. The 9.7 kDa copper-immobilized protein and the 11.7 kDa hydrophobic protein were significantly increased and the 17.4 kDa weak cationic protein was decreased by DON in a dose-dependent manner (Fig. 1). Among those proteins, the 11.7 kDa hydrophobic protein captured on the H50 chip was the most highly expressed (Fig. 2). The average mean peak intensity of the 11.7 kDa protein in the plasma of the mice that were administered with DON 7.5 mg/kg bw was 20 times higher as compared with that of the control.
Purification and identification of the 11.7 kDa hydrophobic protein
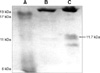
The 11.7 kDa hydrophobic protein that was highly expressed in the blood plasma of mice that were administered DON 7.5 mg/kg bw was purified by a Methyl Ceramic HyperD F column. The column optimizing buffer and binding buffer were 1 M ammonium sulfate and 50 mM sodium phosphate pH 7.0, respectively, and the elution buffer was 50 mM sodium phosphate pH 7.0. The binding and elution was monitored by spotting the eluates of each step on the gold chip and performing SELDI-TOF/MS analysis (Fig. 2). The 11.7 kDa protein that was purified by column fractionation and SDS-PAGE separation (Fig. 3) was identified by performing LC/Q-TOF/MS and MALDI-TOF/MS along with using the Mascot and ProFound protein search engine programs. The search results showed that the top matching protein was haptogloin with 148 top score (p < 0.05) and this protein showed 7% sequence coverage, as determined by LC/Q-TOF/MS, and the haptogloin precursor had a 0.65 z score and 17% sequence coverage, as determined by MALDI-TOF/MS, respectively.
Western blotting analysis of haptoglobin
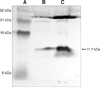
To confirm the identification result of the haptoglobin precursor for the 11.7 kDa hydrophobic protein, western blotting analysis was performed using polyclonal antibody against chicken haptoglobin. The band of 11.7 kDa protein was purified by using a Methyl Ceramic HyperD F column, it was separated by SDS-PAGE and then the protein was transferred to a PVDF membrane. This was reacted with haptoglobin antibody and the protein was expressed at a higher density compared to that of the control (Fig. 4).
The level of haptoglobin in the blood plasma, as determined by ELISA
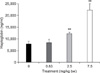
In order to quantify the amount of total haptoglobin in the plasma, ELISA was performed with using polyclonal antibody against mouse haptoglobin. The blood plasma of the mice that were orally administered DON 0.83, 2.5 and 7.5 mg/kg bw and vehicle control (D.W.), respectively, were applied to an ELISA kit. The amount of haptoglobin in the plasma was increased in a dose-dependent manner by DON (Fig. 5). That is, the normal mean value of the haptoglobin was 7,762.82 ng/ml, but it was increased to 8,399.92, 12,252.95 and 22,298.18 ng/ml by DON 0.83, 2.5 and 7.5 mg/kg bw, respectively.
Comparison of the haptoglobin levels induced by DON, AFB1 and ZEA
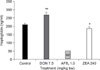
To confirm the potential specificity of haptoglobin as a biomarker for DON intoxication, we compared the expressions of haptoglobin in the rats with DON, AFB1 and ZEA intoxication. The amount of haptoglobin in the blood plasma of the rats that were orally administered DON 7.5, AFB1 1.0 and ZEA 240 mg/kg bw, respectively, for 8 days was measured with a mouse ELISA kit. The normal mean value of the haptoglobin in the blood plasma of a rat was 209 ng/ml, and this was approximately 40 times lower than that of the mouse. The mean value of the haptoglobin in the blood plasma of the rats that were administered DON 7.5 mg/kg bw was 1.3 times higher compared to that of the control, while the haptoglobin was completely decreased by AFB1 1.0 mg/kg bw and was slightly decreased by ZEA 240 mg/kg bw (Fig. 6).
The level of the Igs in the serum of the mice
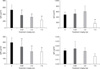
In order to quantify the level of Igs in the serum of the mice, we performed ELISA using goat anti-mouse antibodies against IgG, IgA, IgM and IgE. The serum of the mice that were orally administered DON 0.83, 2.5 and 7.5 mg/kg bw, respectively and the vehicle control (D.W.) was applied to an ELISA kit. The amounts of IgG and IgM in the serum were decreased by DON in a dose-dependent manner and the IgA was decreased at 7.5 mg/kg bw DON without any change of the IgE (Fig. 7).
Comparison of the Igs levels in the rat serum between DON, AFB1 B1 and ZEA intoxication
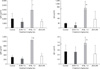
To compare the expression of Igs between DON, AFB1 and ZEA intoxication, the amounts of Igs in the serum of rats that were orally administered DON 7.5, AFB1 1.0 or zearalenone 240 mg/kg bw for 8 days were measured with a rat ELISA kit. IgG and IgA were decreased by DON, but the IgG, IgA, IgM and IgE were all increased by AFB1. No changes in the Igs were observed by ZEA administration (Fig. 8).
Discussion
In this study, the differentially-expressed plasma protein of mice exposed to DON was investigated, and the haptoglobin precursor in the blood plasma in combination with the Igs was found to be a diagnostic indicator for DON intoxication and exposure.
DON induces systemic health problems, including immune dysfunctions and gastroenteritis in both humans and animals and a reduced litter size in animals [8,9,24]. DON is of increasing concern for human health due to its prevalent contamination in cereals in the northern geographic regions and its sustainability during food processing even at high temperatures [5]. The acute oral toxicity (LD50) of DON in mice was determined to be 78 mg/kg bw [6] and the minimum single oral dose that induced vomiting in swine was determined to be 0.075 mg/kg bw [7]. The feed contamination level of DON in wheat and maize is reported to be less than 1 ppm. The level of DON that has no effect for immunologic toxicity in mice is between 0.25 and 0.5 mg/kg bw/day [31]. The Joint Expert Committee of FAO/WHO for Food Additives and Contaminants established a provisional maximum tolerable daily intake of 1 µg/kg bw, based on the no-observed-effect level (NOEL) of 100 µg/kg bw that doesn't have an impact on the immune system, growth or reproduction [34].
We selected the highest dose (7.5 mg/kg bw) of DON based on the LD10 in mice and we selected the lowest dose (0.83 mg/kg bw) that is close to the value of NOEL (0.5 mg/kg bw/day) in mice.
The diagnostic indicators for DON intoxication included a complete blood count for mild anemia and leukopenia and a reduced number of platelets, and the detection of DON in tissue or ingested feed [16,23]. However, diagnostic confirmation by DON detection is difficult because DON is rapidly metabolized and excreted as a de-epoxidation metabolite or as a conjugated DON form into the bile and urine [22]. The development of useful diagnostic parameters is needed for the rapid detection of DON intoxication.
The SELDI-TOF/MS technique has provided a proteomic high throughput approach that can discover potential biomarkers along with determining their mass and charge [37]. Many candidate biomarkers have been found by the SELDI-TOF/MS technique such as amyloid-β peptide for Alzheimer's disease [14,28], α-defensin 1, 2 and 3 for immunodeficiency and so on [38].
In the present study, we profiled the plasma proteins that were sensitive to reaction with DON by using SELDI-TOF/MS technology, and we identified the haptoglobin precursor as a useful protein biomarker for DON intoxication.
Haptoglobin is a glycoprotein that's mainly synthesized and secreted by liver cells [3,17]. Cancer cells and interstitial seminiferous and endometriotic epithelium were also recently reported to produce haptoglobin [25]. Haptoglobin consists of α1 and α2 subunits and these may link to glycosylated β-subunits via disulfide bonds [37]. Haptoglobin functions as a hemoglobin (Hb) scavenger by binding to free Hb released from erythrocytes and thereby inhibits Hb's oxidative activity and allows heme iron recycling. Haptoglobin is increased in patients with acute inflammatory disease as one of positive acute phase proteins (APPs) and it is involved in the regulation of epidermal cell transformation, immune suppression and angiogenesis [21,37]. Ye et al. [37] reported that the haptoglobin-α subunit (MW 11,700 Da) is a potential serum biomarker in human ovarian cancer and it is related with immunosuppression in cancer patients. The release of APPs from hepatocytes and other APPs producing organs was stimulated by pro-inflammatory cytokines such as IL-6, IL-1 and TNF-α, as well as by malnutrition [1,11,19]. DON was observed to upregulate pro-inflammatory cytokines production in vitro and in mice [24,27]. Though the direct reason for the increased haptoglobin by DON was not investigated in the present study, the increased haptoglobin may be related to immune dysfunction, malnutrition and gastroenteritis, which are all induced by DON.
In our former study [12], feed consumption, body weight gain and the absolute and relative weight of the thymus were decreased and mucosal ulceration and submucosal edema of the stomach were found according to oral DON administration of 0.83, 2.5 or 7.5 mg/kg bw in mice. DON was also reported to cause a significant reduction of the thymic and splenic weights and depress the stimulation of B and T cells by mitogenes [26]. IgG, IgA and IgM secretion was significantly impaired in cultured murine lymphocytes that were exposed to DON [33]. Our study also showed decreased IgG, IgA and IgM in B6C3F1 mice with oral DON administration in a dose dependent manner.
Grange et al. [10] showed that there was an inverse relationship between haptoglobin levels and the circulating lymphocyte count in tuberculosis patients. In this study, the levels of haptoglobin and IgG, IgA and IgM showed a reciprocal relationship according to DON administration. IL-1, IL-6 and TNF-α are the main proinflammatory cytokines that stimulate the release of APPs, which were reported to be formed during the acute phase response associated with anorexia [11]. Low protein synthesis and anorexia are the main symptoms of DON intoxication.
In our study, haptoglobin was increased only by DON, but not by ABF1 and ZEA. Haptoglobin was slightly decreased by 240 mg/kg bw ZEA and it was completely decreased to the undetectible range by 1 mg/kg bw AFB1 in rats. However, IgG and IgA were suppressed by DON 7.5 mg/kg bw, but all the Igs (IgG, A, M and E) were increased by AFB1 1 mg/kg bw, and no changes in the Igs were observed by ZEA 240 mg/kg bw. AFB1 is a typical hepatotoxicant that induces centrilobular hemorrhagic hepatic necrosis and cancer [23]. AFB1 inhibits protein synthesis by modifying the DNA template and depressing the synthesis of messenger RNA, which may explain the reduction of haptoglobin synthesis in the liver by AFB1. ZEA binds to cytosolic estradiol-17β receptors and functions as a weak estrogen [23]. Estrogen-deficient rats showed an increased production of pro-inflammatory cytokines, which was attenuated by estrogen-replacement [4]. The slight reduction of haptoglobin by ZEA may be understood according to the inverse relationship between estrogen and proinflammatory cytokines. Our present study suggests that haptoglobin induction and Igs suppression can be used to discriminate between DON intoxication from ZEA and AFB1 intoxication when a case of mycotoxicosis is suspected.
Haptoglobin is a positive APP, and it is increased in the blood plasma by bacterial infectious diseases and viral diseases, and for this reason haptoglobin has been suggested to be a landmark for disease control. Chronic bacterial infections are usually accompanied with induction of Igs, and especially IgG [18]. But in the case of DON intoxication, an increase of haptoglobin with a decrease of IgG, IgA or IgM was observed, and this can help differentiate DON intoxication from infectious disease.
In conclusion, haptoglobin can be used as a biomarker for DON intoxication and exposure, and especially when the Igs are combined into an index.
 XML Download