

 PDF
PDF ePub
ePub Citation
 Print
Print


Introduction
The electroretinogram (ERG) is a test which measures the electrical potential generated by the retina of the eye when it is stimulated by light [40].
An important indication for ERG recordings in dogs is the early diagnosis of generalized progressive retinal atrophy (gPRA) [24]; which is an inherited form of photoreceptor degeneration, analogous to retinitis pigmentosa in humans [23]. The breed with the highest prevalence of gPRA in Korea is the Miniature Schnauzer [29]. The ERG is a reliable diagnostic procedure for the early detection of affected dogs before the ophthalmoscopical abnormality becomes apparent [39]. The ERG is also used to diagnose inherited and nutritional photoreceptor degenerations in cats [22,36] as well as retinal disorders in a number of other species, uncluding chickens [5,34], pigeons [9], rabbits [11,33,35], sheep [12], and monkeys [4,8].
It is often necessary to place the patient under general anesthesia to record ERG in order to prevent muscular movement, reduce stress, and allow the examiner to fix and position the electrodes [1]. Even though most animals need to be under general anesthesia to properly measure ERG, various sedatives and anesthetics have been documented to affect ERG responses [10,15,16,27,38]. It is also important to be aware of species variation as to the suitable types and dose levels of anesthetics [9,13,33,34,36].
Although infants and young children have a short attention span and do not want to hold still for recordings of ERG's, it is possible to record ERG without sedation and anesthetics [2,17,19,37]. Previous studies also exist regarding ERG recordings from conscious animals such as yucatan micropigs [26], rats [32], and dogs [28]. The studies revealed that recording artifacts from blinks, eye, and head movements are frequent in the conscious dogs, which necessitate the averaging of the multiple responses in order to reduce the artifcact effect [17].
Past studies documenting the ERG of unanesthetized dogs are relatively rare and generally refer to anesthetized animals. For this reason, a procedure for recording the ERG in conscious and non-stressed dogs was investigated. The purpose of this study was to determine the dark adaptation time needed for ERG recordings in order to evaluate general retinal function in Miniature Schnauzer dogs without anesthesia or sedation using an ERG recording unit with a contact lens electrode and a built-in LED light source.
Materials and Methods
Experimental animals
Nine healthy male Miniature Schnauzer dogs were used in this study. The mean ± SD of ages and body weights was 3.8 ± 1.9 years and 6.2 ± 1.2 kg, respectively. They were housed individually and were fed commercial dry food and water ad libitum. The pupillary light reflex, menace reflex, Schirmer's tear test, tonometry, slit lamp examination, direct ophthalmoscopy and indirect ophthalmoscopy were performed prior the ERG studies. Only the dogs with normal retinal function were included in the study. The experiments adhered to the strict guidelines of the "Guide for the Care and Use of Laboratory Animals" of Seoul National University, Korea.
ERG equipment
The ERG signals were recorded with a commercial system (RETIcom; Ronald Consult, Germany) using a band pass of 1 to 300 Hz. Moreover, light stimulation, using a contact lens electrode with a built-in light resource (Kooijman/Damhof ERG lens; Medical Workshop BV, Netherlands), was used. The obtained responses were transferred to a computer system for data storage and printing the recordings. The reference and ground electrodes were plantinum subdermal needle electrodes (Astro-Med, USA).
Experimental procedure
For mydriasis, 1 drop of 1% tropicamide (Alcon-Couvreur, Belgium) was applied in two treatments, separated by a 15 min interval. The ground electrode was placed subcutaneously over the external occipital protuberance. Similarly, the reference electrode was placed about 2 cm caudal to the lateral canthus.
A topical anesthetic eyedrop, 0.5% proparacaine hydrochloride ophthalmic solution, (Alcon-Couvreur, Belgium) was applied. Following this, a 17 mm in diameter LED (light emitting diode)-electrode was placed on the cornea using 0.3% hydroxypropyl methylcellulose (Unimed Pharm, Korea) wetting solution to protect the cornea and to ensure proper electrical contact between the electrode and the cornea. ERG's were recorded at 1, 10, 20, 30, 40, 50, and 60 min after the beginning of dark adaptation at an intensity of 2.5 cd·s/m2 using a white light. At each recording time (four consecutive times), unfiltered flashes were presented at 10-sec intervals, and an ERG was recorded for each flash. The examinations were performed under a dim red light.
To overcome the difficulties of recording stable ERG's in conscious dogs, halters and manual restraints were employed during recording as dictated by the animal's behavior. In addition, no systemic drugs were used in this study. We found semi-restraint to be adequate to properly perform the ERG examinations in the conscious dogs, which were positioned on the table (Fig. 1).
Signal averages
The recordings obtained were the averages of four responses which were elicited by the LED-electrode flashes presented at 10-sec intervals.
Evaluation of ERG
The amplitude and implicit times were determined for each response. The amplitude of the a-wave was measured from the baseline to the peak of the first negative deflection, whereas the amplitude of the b-wave was measured from the peak of the a-wave to the first positive peak of the ERG. The implicit times of the a- and b-waves were measured from the onset of the light stimulus, to the peak of the a- and b-waves, respectively.
Statistical analysis
All statistical analyses were performed with SPSS (Windows Release 12 Standard Version; SPSS, USA). Statistical significance was set at p < 0.05. The repeated measures ANOVA test was used to verify the significance of the changes attributed to the variation in the dark adaptation time.
Results
Amplitudes of the a-wave
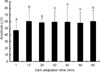
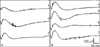
The amplitude of the a-wave significantly increased up to 10 min. Beyond the 10 min of dark adaptation, the mean ERG's a-wave amplitude was 60.30 ± 18.47 µV. However, no significant differences were observed after 10 min of dark adaptation, and the curve approached a plateau after this time (Figs. 2 & 6).
Implicit times of b-wave
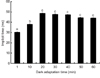
The implicit times of the b-wave significantly increased up to 20 min. Beyond the 20 min of dark adaptation time, the mean b-wave implicit time was 48.60 ± 9.64 msec. However, there were no significant differences after 20 min dark adaptation, and the curve approached a plateau after 20 min of dark adaptation (Figs. 5 & 6).
Discussion
This study was carried out to establish the dark adaptation time on ERG in conscious Miniature Schnauzer dogs using a commercial ERG system with a contact lens electrode and a built-in LED light source. The type of ERG performed in this study was an integral part of the presurgical work-up for cataract surgery when funduscopy was impossible to perform due to the presence of cataracts. Because many breeds predisposed to develop cataracts, may also have hereditary PRA, retinal function using ERG should be performed before cataract surgery [14]. This was the reason why Miniature Schnauzer dogs were selected for this study, and in particular, since a high prevalence of PRA exists in Miniature Schnauzer dogs in Korea [29].
ERG has a characteristic waveform that varies depending on several factors. Therefore, the normal ranges of ERG must be specified for each ERG system as well as the species and breeds evaluated [6]. With the aim of solving these problems, the guidelines for dog ERG protocols were presented by special a committee of the European College of Veterinary Ophthalmology in 2002. The guidelines stipulated that dogs be dark adapted for 20 min when testing the mixed rod and cone function using a white standard flash (2-3 cd·s/m2) [18,21].
Most animals need to be under general anesthesia for the proper recording of ERG's. According to Acland [1], the success of ERG's recordings on unanesthetized animals is influenced by muscular movement. A precisely controlled alignment of the light delivery system with the eye is thus required to obtain consistent readings. The positioning of the recording electrodes due to patient movements may also affect recorded ERG parameters [1]. However, an exception might be the rapid evaluation of retinal function before cataract surgery and the quick differentiation of the retinae from central blindness under sedation or semirestraint in dogs [21]. Anesthesia is known to affect electrophysiological responses due to changes in body temperature as well as cortical depression, which lead to an increase in latency for the evoked responses [28]. Moreover, it is possible that repeated administration of anesthetics prior to recording may enhance the effects of the anesthetics on the ERG [3,25]. As no anesthetics or sedatives were used, signal averaging was adopted to reduce electromyographic noise. Signal averaging will reduce the artifacts encountered when performing ERG recordings in conscious animals [28].
Successive trials involving the presentation of single or multiple flashes were separated by a dark adaptation period of at least 1 min [30]. If averaging is necessary, not more than one flash every 10 sec is recommended in order not to light adapt the rods [21]. In 2004, the International Society for Clinical Electrophysiology of Vision (ISCEV) presented a standardized and updated protocol for clinical ERG's in humans [19]. According to the updated version of ISCEV's recommendations for humans, an interval of at least 10 sec between stimuli was recommended when performing an ERG's with the photopic standard flash (1.5-3.0 cd·s/m2) in the dark-adapted state (in order not to light adapt the rods). In this study, ERG was recorded at 1, 10, 20, 30, 40, 50, and 60 min after the beginning of dark adaptation at an intensity 2.5 cd·s/m2. For each recording time, four consecutive, unfiltered flashes were presented at 10-sec intervals, with an ERG recording following each flash as in a previous study [31]. A contact lens electrode with a built-in high luminance diode (LED-electrode) was recently developed, which may enable ERG's to be performed economically with regards to space and cost. The LED-electrode has three to four built-in high luminance diodes, which enable the creation of similar conditions as the Ganzfeld dome when placed on the cornea in humans [18]. In this study, ERG's were recorded using a LED-electrode as an active electrode. This device enabled reproducible ERG examination in conscious dogs because the light source using the LED-electrode can move in conformity with movements of the animal's eyes.
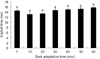
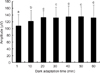
The amplitudes and implicit times of a- and b-waves are important parameters of clinical ERG recordings. At the beginning of the dark adaptation period (1 min), the amplitudes of the a- and b-waves were low. As the dark adaptation time increased, the amplitudes of both waves increased gradually. The most notable change in a-wave amplitude was evident between 1 and 10 min of dark adaptation. No significant changes were observed beyond that point. Moreover, the amplitudes of the b-wave were prolonged and reached a plateau after 20 min of dark adaptation time. The means (± SD) of the a- and b-wave amplitudes were measured and the highest amplitudes obtained were 60.30 ± 18.47 µV and 132.92 ± 17.79 µV, respectively. On the other hand, the implicit time of the a-wave did not show any clear dark adapted changes. The implicit times of the b-wave increased markedly during the first 20 min of dark adaptation, beyond which there was little change. The mean implicit time value after 20 min of dark adaptation time was 48.60 ± 9.64 msec. These values, including the amplitude and implicit time of both a- and b-waves, were comparable to those obtained from chemically immobilized dogs [7,20].
The results of the present study suggest that at least a 20 min dark adaptation period is required to perform ERG's under clinical conditions in conscious Miniature Schnauzer dogs. In addition, the outcome of this study indicates that a high reproducibility of ERG recordings can be obtained by using signal averaging in dogs that are not anesthetized or sedated.

 XML Download