

 PDF
PDF ePub
ePub Citation
 Print
Print


Introduction
Cerebrovascular accident or stroke is defined as a sudden onset focal central neurological deficit resulting from cerebrovascular disease. A previous canine study reported that ischemic and hemorrhagic stroke accounted for only 1.5% to 2% of reported neurological cases [19]. However, the true prevalence of ischemic stroke is unknown, since a confirmed diagnosis requires post-mortem examination. Therefore, definitive diagnosis is only made in severely affected dogs, or dogs with significant comorbidities, underlying disease, or causative pathology. These factors lead to marked underrepresentation of patients with an ischemic stroke and insignificant clinical impairment [91319]. In recent years, stroke diagnosis has become more frequent following the introduction of advanced imaging modalities such as magnetic resonance imaging (MRI).
Previous studies have described MRI features that have improved the diagnostic sensitivity and specificity of ischemic brain infarction [591113]. Previous conventional magnetic resonance studies, including T1-weighted (T1W), T2-weighted (T2W), and fluid-attenuated inversion recovery (FLAIR) sequence MRI, described ischemic brain infarct as hypointense on T1W but hyperintense on T2W and FLAIR imaging [513]. The introduction of diffusion-weighted imaging (DWI) facilitated the detection of early ischemic change. DWI is a functional MRI technique that measures physiological changes within the brain, by detecting changes in Brownian motion of water within tissues [5,9]. One study reported on six dogs with presumed ischemic brain infarction and suggested that the classic appearance of DWI over time was similar to that of humans [13]. In humans, MRI characteristics of ischemic brain infarction over time (e.g., hyperacute, acute, subacute, chronic phases) have been established [118]. However, there have been no reports on conventional MRI characteristics of ischemic brain infarction over time in dogs. In addition, no studies have used a canine infarct model for evaluating MRI characteristics over time in a single subject within a well-controlled environment.
This study aimed to describe the MRI characteristics of ischemic brain infarction in a canine stroke model (14 dogs) by using T1W, T2W, FLAIR, DWI, apparent diffusion coefficient (ADC), and assessing changes in lateral ventricular size over time.
Materials and Methods
Preparation of allogeneic blood clots
Venous blood samples (20 mL) were collected from normal beagle dogs and maintained at room temperature for 2 h. The upper serum layer was subsequently removed, and the lower thrombus layer moved into a 10 mL syringe. For homogenization, a 3-way stopcock filled with sterile saline was connected to the thrombus-filled syringe and an empty 10 mL syringe. Steady pressure was applied for 5 sec to the thrombus-filled syringe to move the thrombus to the opposite empty syringe; this was repeated five times. The 3-way stopcock opening was reduced by two-thirds, and the same process repeated five times. Finally, 0.3 mL of homogenized thrombus was transferred to a 1.0 mL syringe and kept sterile.
Stroke model preparation
The surgical and experimental protocols were approved by the institutional animal care and use committee of Korea Animal Medical Science Institute (IACUC No. 12-KE-011). Fourteen healthy male beagle dogs (mean body weight, 9 kg; weight range, 7–10 kg; mean age, 9 months; age range, 8–10 months) were used in the study. All dogs yielded normal physiological examination, complete blood count, serum chemistry, and neurological examination results, and they had no history of neurological disorder. The dogs were fasted for 12 h before undergoing general anesthesia. Thiopental sodium (20 mg/kg intravenous, Pentothal Sodium; JW Pharmaceutical, Korea) was used for anesthesia induction; isoflurane (Terrel Solution; Kyongbo Pharmaceutical, Korea) was administered for maintenance.
Canine middle cerebral artery (MCA) occlusion models were induced by using allogeneic blood clots. Anesthetized dogs were positioned in dorsal recumbency on a surgical table. Hair was shaved from the left ventral neck, and povidone-iodine and alcohol were applied for disinfection. The common carotid artery was exposed via skin incision. Using blunt dissection, the common carotid artery was separated from the vagosympathetic trunk, and the internal and external carotid arteries were identified. Subsequently, a surgical rubber band was applied to the exposed internal carotid artery to temporarily stop blood flow. A customized 16-gauge catheter was inserted into the left internal carotid artery through the carotid bulb, and the surgical rubber band was removed. Next, a 0.3 mL thrombus was inserted through the 16-gauge catheter over a 15 sec period, followed by 3 mL of sterile saline over a 15 sec period. The internal carotid artery and cervical incision site were closed using standard suture procedures. After surgery, dogs were observed four times per day. Tramadol (2 mg/kg intravenous, Humedix Tramadol HCl Injection; Humedix, Korea), for pain control, and ampicillin (20 mg/kg oral administration, Ampi-10; Uni Biotech, Korea), for infection prophylaxis, were administered three times daily for one week. Dressings and povidone-iodine were applied daily for disinfection, and post-surgery complications were evaluated daily.
MRI scanning
MRI scans were performed at 3 h and 3, 8, and 35 days after MCA occlusion. Due to the high risk of re-anesthesia immediately after surgery, only three randomly selected dogs were scanned at 3 h post-occlusion. Scanning was performed under general anesthesia while in ventral recumbency with the head on a circularly polarized extremity coil. The animals underwent 0.32 T MRI (Magfinder II; AILab, Korea) at 3 h and 3 days, and 3.0 T MRI (Achieva; Phillips Medical System, The Netherlands) at 8 and 35 days post-occlusion. Transverse T1W, T2W, and FLAIR imaging data were obtained during all MRI scans. The following parameters were used for all sequences: field of view, 16 cm; matrix, 256 × 256; and section thickness, 5 mm with 0.32 T MRI or 2 mm with 3.0 T MRI. Specific T1W parameters included a repetition time/echo time (TR/TE) of 470/15 msec with 0.32 T MRI and 655/8 msec with 3.0 T MRI. Specific T2W parameters included a TR/TE of 4,500/120 msec with 0.32 T MRI and 3,982/120 msec with 3.0 T MRI. Specific FLAIR parameters included a TR/TE/inversion time (TI) of 7,800/104/2,400 msec with 0.32 T MRI and 10,000/125/2,500 msec with 3.0 T MRI. DWI and ADC were additionally performed at days 8 and 35. DWI (TR/TE, 5,608/93 msec) was obtained by using an echo planar spin echo sequence with a b value of 1,000 sec/mm2. The ADC was calculated from the DWI.
Imaging assessment
Based on the MRI results, the infarcts were classified according to (1) location (unilateral or bilateral, anatomical location, and suspected arterial territory involved), (2) distribution (focal or multifocal), (3) border (ill-defined or clear margin), and (4) serial signal intensity change in the infarct. In addition, changes in lateral ventricular size over time were assessed. The changes in lateral ventricular shape were evaluated and determined to be generalized or focal changes. For the lateral ventricular size analysis, dogs were divided into two groups based on lesion location and then further subdivided into two subgroups each based on lesion side as follows: Group 1a, dogs with unilateral cerebrocortical lesions; Group 1b, dogs with bilateral cerebrocortical lesions; Group 2a, dogs having unilateral lesions without cerebrocortical lesions; and Group 2b, dogs having bilateral lesions without cerebrocortical lesions. The lateral ventricular size was measured as the lateral ventricle height/brain height ratio at the level of the interventricular foramen on transverse T1W images, as described previously [10]. By using IBM SPSS Statistics software (ver. 22.0; IBM, USA), the Mann-Whitney U test was implemented to analyze changes in the lateral ventricular size relative to the cerebral lesion side between 3 and 35 days and between 8 and 35 days post-occlusion. A p value < 0.05 was considered to indicate statistical significance.
Gross findings and microscopic examination
Forty days after inducing MCA occlusion, all dogs were euthanized with sodium pentobarbital (80 mg/kg intravenous, Entobar Injection; Hanrim Pharmaceutical, Korea). The entire brains were carefully harvested and dissected into transversal 1.0 mm sections. The brain slices were immersed in a 2% solution of 2, 3, 5-triphenyl-tetrazolium chloride at 37℃ for 30 min. Subsequently, the brain slices were immersed in 10% paraformaldehyde in phosphate buffer. After 72 h of immersion fixation, the slices were dehydrated and embedded in paraffin. Transverse sections were obtained at a volume of 5 mm3 and stained with hematoxylin and eosin. Histopathologic changes related to ischemic stroke were confirmed through light microscopic examination.
Results
Initially, 14 beagle dogs were included in the lesion analysis. However, two dogs that failed to develop significant lesions at 3 days after MCA occlusion were excluded. One dog with three lesions (bilateral caudate nucleus and cerebral temporal lobe) died during recovery from anesthesia at 3 days post-occlusion.
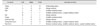
Anatomical locations and vascular supplies of 29 lesions in 12 dogs are summarized in Table 1. Thirteen of the 29 brain infarcts occurred in the caudate nucleus, within the territory of the striate arteries; five of these 13 additionally extended to the internal capsule and putamen, within the territory of the striate arteries. One lesion was limited to the internal capsule in the territory of the striate arteries. Nine lesions were located in the thalamus, in the territory of the perforating artery. Six cerebral lobe lesions were identified in regions supplied by one or more of the main territorial cerebral arteries (e.g., rostral, middle or caudal cerebral artery). Six dogs had nine unilateral left-side lesions and the remaining six dogs had bilateral lesions (left, 13; right, 7).
Infarcts were distributed focally in two dogs and multifocally in ten dogs; this distribution did not change over time (3–35 days post-occlusion). However, changes in lesion distribution between 3 h and 3 days post-occlusion were detected in three dogs. One dog without lesions at 3 h exhibited a focal infarct in the thalamus at 3 days. Another dog with bilateral caudate nucleus lesions at 3 h exhibited bilateral caudate nucleus and temporal lobe lesions at 3 days. The third dog had a focal caudate nucleus lesion at 3 h and multifocal lesions in the caudate nucleus, thalamus, internal capsule, and putamen at 3 days.
On T2W images, lesion borders tended to become clearer over time. At 3 days post-occlusion, 24 and 5 lesions had ill-defined and clear margins, respectively. At 8 days, 4 and 22 lesions had ill-defined and clear margins, respectively. At 35 days, all infarcts had clear margins.
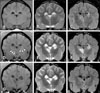
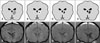
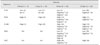
MRI intensities over time are summarized in Table 2. Lesion intensity was compared to that of the surrounding tissue. On T1W, lesions exhibiting hypointensity or isointensity at 3 h (2/3, 1/3) and 3 days (11/29, 18/29) appeared with peripheral hyperintensity (24/26) and small isointense to hypointense centers at 8 days. At 35 days, most of these lesions were hypointense (18/26) (Figs. 1 and 2). Eight remaining lesions were peripherally hyperintense with large hypointense centers; all eight had been peripherally hyperintense with small isointense centers at 8 days post-occlusion.
On T2W and FLAIR, three lesions detected on the 3 h scans were hyperintense, while some lesions detected at 3 days were not observed at 3 h. At 3 days, all T2W- and FLAIR-detected lesions were hyperintense. At 8 days, some lesions appeared to have hypointense to isointense centers and peripheral hyperintensity on T2W (12/26) and FLAIR (16/26); the centers of these lesions appeared smaller than those on T1W images, particularly lesions with spot-like centers on T2W. At 35 days, most lesions appeared hyperintense on T2W (21/26) and FLAIR (19/26).
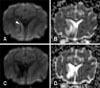
On DWI, lesions appeared with hypointense to isointense centers and peripheral hyperintensity (17/26) or as fully hypointense (5/26) or hyperintense (4/26) at 8 days post-occlusion, and as hypointense (19/26) or with hypointense centers and peripheral hyperintensity (7/26) at 35 days. Six peripherally hyperintense lesions with isointense centers at 8 days changed and appeared as hypointense lesions (2/6) or peripherally hyperintense lesions with hypointense centers (4/6) at 35 days (Fig. 3). On ADC, most lesions appeared hyperintense at both 8 (20/26) and 35 days (26/26).
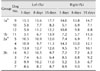
Lateral ventricular sizes over time are summarized in Table 3. The changes in lateral ventricular size as a percentage of brain height (100 × ventricular height/brain height) from 3 to 35 days post-occlusion and from 8 to 35 days were significantly larger in subjects with cerebral lesions (Group 1a and Group 1b) than in subjects with non-cerebral lesions (Group 2a and Group 2b; p < 0.05). Generalized ventricular enlargement was observed in Group 1a and Group 1b on the side with the cerebrocortical lesion.
All 12 dogs with suspected brain infarct on MRI underwent histologic confirmation. Gross findings revealed atrophic and necrotic changes in areas corresponding to the lesion locations identified on MRI (Table 1). The lesions were clearly distinguishable from normal brain parenchyma. Microscopic findings of brain lesions confirmed the presence of brain infarction features such as pyknotic nuclei, neuronal cell body shrinkage, and amorphous granular cellular debris.
Discussion
The canine MCA occlusion model is widely used in brain infarct studies because of its similarity to human brain infarct features and its high reproducibility without craniotomy [89122122]. Herein, we adopted a canine MCA occlusion model to evaluate brain infarct.
In this study, there was variety in the distribution of infarcts, and that variation in the distribution of infarcts might be attributable to the cerebral vascular anatomy. The MCA derives from the internal carotid artery near the origin of the caudal communicating artery and divides into the cortical and central branches [3]. The central branch forms striate vessels that supply blood to the caudate nucleus, internal capsule, and putamen, whereas the caudal communicating artery divides into perforating arteries that supply blood to the thalamus [7]. In addition, anastomoses between the internal carotid artery and the MCA are relatively abundant in dogs [12]. In these anatomical structures, clots from the internal carotid artery might follow the blood flow and thus block the striate or perforating artery. Other possibilities include the presence of small-sized or fragmented allogenic blood clots [1215], unskilled injection velocity, or increased pressure due to blood clots. Despite a clot injection site in the left internal carotid artery, bilateral lesion induction may also result from small-sized or fragmented allogenic blood clots. Such clots could block not only the left cerebral artery but also the right cerebral artery since the clots follow blood flow.
When examining the 3 h to 3 days post-occlusion MRI findings, the earliest lesions appeared at the caudate nucleus. The present study results are consistent with those of a previous study in which caudate nucleus lesions were detected at 3 h on FLAIR images, whereas cerebral lobe lesions were detected at 24 h [22]. This difference might be due to the presence of abundant distal cerebral collateral anastomoses. Whereas, deep brain areas, such as the caudate nucleus, do not have extensive collateral circulation in dogs [12]. A previous study conducted in humans reported that collateral branches permit partial blood flow maintenance in ischemic brain lesions, thus delaying or preventing cell death [20]. Therefore, we propose that lesions in the cerebral cortex, with abundant collateral circulation, could have delayed infarct induction times compared to lesions in deep brain areas. In addition, the presence of later-fragmented allogenic blood clots could account for differences in vascular occlusion times. However, these assumptions have several limitations since the number of cases in our study that underwent MRI scans from 3 h to 3 days was small, and repeat MRI at shorter intervals than 3 h to 3 days was not performed. Further research on lesion-detection times during a series of short-interval MRIs with a large number of cases is needed.
Conventional MRI sequences, including T1W, T2W, and FLAIR, were obtained during all phases. The appearance of infarcts on T1 changed over time; whereas, infarct appearance on T2W and FLAIR was more static, with hyperintensity maintained in many dogs from 3 h to 35 days post-occlusion. In human brain infarct studies, T1W hyperintensity indicates a hemorrhagic infarct, but such hyperintensity may also be seen in an incomplete infarct with selective neuronal loss due to gemistocytic astrocyte accumulation, tissue calcification, and lipid or paramagnetic substance deposition [12]. Based on those studies, peripheral T1W hyperintensity at 8 days was considered to indicate incomplete infarction in this study. An increasing hypointense infarct center and the narrowing peripheral hyperintense field from 8 to 35 days suggested a transition from incomplete to complete infarction, identical to neuronal necrosis. Center lesions detected on T1W were not always distinguishable from peripheral lesions on T2W and FLAIR. If detected, center lesions were smaller hypointense to isointense spots, especially on T2W, compared to those on T1W. These results suggest that T1W might be more useful for monitoring the progression of ischemic brain infarcts or estimation of infarct age.
DWI and ADC mapping were undertaken for 26 lesions in 11 dogs at 8 and 35 days post-occlusion. We adopted a b value of 1,000 as it provided better brain infarct tissue characterization in a previous study [14]. On DWI, brain infarct hyperintensity has been correlated with excess intracellular water accumulation or cytotoxic edema, which reduces water molecular diffusion rates in affected tissues [118]. On DWI, lesions have exhibited hyperintensity with reduced ADC values from 30 min to 5 days, mild hyperintensity with pseudonormal ADC values from one to four weeks, and variable intensity with increased ADC values after several weeks to months [18]. In this study, isointense to hypointense lesion centers with peripheral hyperintensity on DWI at 8 days changed to hypointense lesions at 35 days. Four hyperintense lesions on DWI were shown to result from a T2 shine-through effect when ADC and T2W images were compared. These changes in the intensity of central and peripheral lesions on DWI may reflect the process of cell and axonal loss, gliosis, and encephalomalacia that contain water-filled cysts with unrestricted water motion [16]. Therefore, these processes may result in hypointense lesions on DWI with increased ADC at 35 days, similar to those of a chronic infarct. The limitations of the present study include the lack of DWI and ADC results during MRI scans obtained at 3 h and 3 days post-occlusion.
Previously, no studies have investigated changes in ventricular size in dogs with brain infarct. In human studies, however, ependymal lining destruction following injury, neurodegeneration, vascular defects, or inappropriate protein accumulation have caused ventriculomegaly [17]. In rat brain ischemic models, cerebral ischemic infarction can induce DNA fragmentation, a hallmark of cell death, in the choroid plexus, and choroid plexus death can disrupt the blood-cerebrospinal fluid barrier [46]. Based on these reports, cerebral infarction might have induced ependymal cell death and resulted in lateral ventricle enlargement in the dogs in this study. Further studies regarding the physiopathological mechanism of ventricle enlargement in dogs with cerebral ischemic infarct are needed.
In conclusion, MRI was useful for ischemic brain infarct phase diagnosis. T2W and FLAIR were useful for detecting early stage (3 h to 3 days) brain infarct. T1W and DWI provided supplemental information for detecting neuronal necrosis and time-related brain infarct changes. In addition, cerebral lobe infarct might result in lateral ventricular dilatation.
 XML Download