

 PDF
PDF ePub
ePub Citation
 Print
Print


Introduction
Multi-phase computed tomography (CT) has been applied for imaging of canine abdominal organs such as the liver, pancreas, vasculature, mesentery and lymph nodes [8172122232833]. To maximize contrast enhancement of the target organ for each phase, contrast-enhanced CT techniques such as fixed scan delay, test bolus, and bolus tracking, which provide information for CT scan timing, have been described for multi-phase CT imaging in humans [1271315]. The test bolus method is the most common protocol used to determine the scan timing in multi-phase CT of the canine liver and pancreas [832]. Fixed scan delay is determined based on previous data and operator's experience without consideration of individual variations, and the results of contrast enhancement patterns in a few previous veterinary studies are applied as fixed scan delays for the arterial and portal phase, in spite of the wide range of values for arrival times after injection of the contrast material [81732]. The bolus-tracking technique is a popular option for use of multi-phase CT in human patients, particularly with multi-detector scanners in which scans occur so fast that it would be easy to miss a vascular phase without this technique [19]. It has been reported that, for single-detector CT angiography, the arterial phase of the multi-phase CT scan starts at aortic enhancement appearance (AEA) in veterinary and human medicine [8272932]. However, the timing resulted in too early scanning for the arterial phase using a high speed CT scanner. Therefore, it is critical to include an appropriate additional delay, which is known as the diagnostic scan delay, in the bolus-tracking technique [249].
Contrast enhancement timing for CT examinations is affected by numerous interacting factors. Among these, the injection duration of the contrast material is a major injection-related factor influencing contrast enhancement timing in CT [230]. In veterinary literature, arrival times to the aortic enhancement peak (AEP) and hepatic parenchymal peak (HPP) following 30 and 60 sec injection durations of contrast material have been reported [30]. In addition, the optimal diagnostic scan delay of the arterial and pancreatic parenchymal phases was recently investigated using a fixed injection rate of contrast material [10]. However, contrast enhancement patterns for each organ obtained upon shorter injection duration of contrast materials have not been studied in veterinary medicine. The fixed values from the contrast enhancement patterns are required for the clinical application of fixed scan delay and bolus-tracking technique in canine abdominal multi-phase CT.
This study was conducted to evaluate the effect of contrast material injection duration on the contrast enhancement pattern of abdominal organs and vessels during CT scans of normal Beagle dogs, and to determine the optimal fixed scan delays and diagnostic scan delays of the bolus-tracking technique using various contrast material injection durations in canine abdominal multi-phase CT scans.
Materials and Methods
Experimental animals
This study was conducted under the guidance of the Chungnam National University Animal Care and Use Committee (CNU-00588). Four intact male and four intact female Beagle dogs (age, 3–5 years; body weight, 8–11 kg) were used for the study. The dogs were checked to ensure clinically healthy status based on physical examinations, complete blood cell counts, serum chemistry analyses, and radiography of the thorax and abdomen. Upon echocardiography, left ventricular ejection fraction by Simpson's method and mitral valve inflow by pulsed-wave Doppler examination were measured to identify the normal cardiac function in all dogs.
Preparations for experimental CT scan
The dogs were not fed for 6 hours before the anesthetic procedure, and a 20-gauge catheter was placed in the cephalic vein. The dogs were premedicated with 0.3 mg/kg midazolam (Midacum Inj.; Myungmoon Pharm, Korea), and induced with 5.0 mg/kg of propofol (Provive Inj.; Myungmoon Pharm) intravenously. The maintenance of anesthesia was performed with isoflurane (Ifran; Hana Pharm, Korea) and oxygen. The anesthetized dogs were placed in ventral recumbency, and an angiographic power injector (Salient; Imaxeon, Australia) was connected to the intravenous catheter. Breath-holding was conducted using 15 cm H2O applied with intermittent positive pressure during the CT scan. A survey scan was conducted with the range from the diaphragm to the hip joint using a 32-detector-row CT scanner (Alexion; Toshiba, Japan). The scan parameters were 120 peak kilovoltage (kVp), 150 mA, 1 mm slice thickness, 0.75 sec rotation time, and 0.938 collimation beam pitch.
Experimental CT scan technique and image analyses
Experiment 1:
Three dynamic scans were performed using the crossover method with different injection parameters of contrast material. The inter-scan interval was 20 min to minimize the effects of the prior contrast material. A non-ionic iodinated contrast material, iohexol (Omnipaque; GE healthcare, Ireland), containing 200 mg iodine/kg was administered with 5, 10 and 15 sec injection durations using an angiographic power injector in three dynamic scans. The injection pressure was limited to 200 pound per square inch. A continuous dynamic scan was initiated at the time of the contrast material injection and continued for 60 sec. The scan parameters were 100 kVp, 50 mA, 3 mm thick slices and 1 sec rotation time, and the images were reconstructed with a 1 sec interval. The acquired CT images were evaluated using a commercial software program (Rapidia; INFINITT Healthcare, Korea). Four regions of interest (ROI) were placed at the aorta, pancreatic body, portal vein and liver, and a time attenuation curve (TAC) was generated. Arrival times to the AEA, AEP, pancreatic parenchymal peak (PPP), portal vein peak (PVP) and HPP after injection of the contrast material started were measured. The intervals for each arrival time were calculated from the measured values. Data were analyzed using the SPSS statistical software program (SPSS Statistics 22.0; IBM, USA). The values for the aorta, pancreatic parenchyma, portal vein, and liver were evaluated by the Kruskal-Wallis test with Bonferroni correction for multiple comparisons.
Experiment 2:
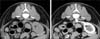
Six multi-phase CT scans using the bolus-tracking technique were performed employing a crossover design, and a period of 3 days among CT scans was allowed to avoid residual effects of anesthetic drugs. The six CT scans were divided into three subexperiments with 5, 10, and 15 sec injection durations. Each subexperiment consisted of two CT scans with another diagnostic scan delay [20]. Five phase series were obtained in every multi-phase CT scan. The diagnostic scan delays after trigger at the aorta were 0, 10, 20, 30 and 40 sec in the first, and 5, 15, 25, 35 and 45 sec in the second CT scan. A non-ionic iodinated contrast material was injected intravenously at a dose of 600 mg iodine/kg with 5, 10 and 15 sec injection durations using an angiographic power injector in every subexperiment. After the contrast material was injected, the aortic contrast enhancement was monitored at the level of the scan starting position using a bolus-tracking program (SureStart; Toshiba). When the aortic enhancement reached 50 Hounsfield units (HU), the first CT scan was started immediately (Fig. 1). All phases were scanned over 5 sec, and the middle of the scan range was the porta hepatis level. With the exception of the first scan of a caudocranial direction, the other four scans were conducted in a craniocaudal direction. The scan and reconstruction parameters were 120 kVp, 150 mA, 3 mm slice thickness, 0.75 sec rotation time, 1.438 collimation beam pitch, 1.5 mm reconstruction interval, and standard algorithm. Attenuation values were measured from four ROI placed at the aorta, pancreatic body, portal vein, and liver on the same level of the CT images in all series using a software program (INFINITT PACS; INFINITT Healthcare). Mean attenuation values of the aorta, pancreatic parenchyma, portal vein and hepatic parenchyma at each scan delay were evaluated statistically using the Mann-Whitney and Kruskal-Wallis tests with Bonferroni's correction for multiple comparisons in SPSS. A p value < 0.05 was considered to be statistically significant.
Results
Experiment 1
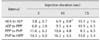
There was no significant difference in mean arrival time to the AEA among the three dynamic scans. The mean arrival time to the AEA of 7.4 sec with a 5 sec injection duration was shortest. Overall, the mean arrival times to AEP and PPP among the three dynamic scans increased as the injection duration increased. The values of 12.0 and 17.8 sec with a 5 sec injection duration were significantly shorter than 15.6 and 25.1 sec with a 10 sec injection duration. The mean arrival time to AEP with a 10 sec injection duration was p =significantly shorter than 18.6 sec with a 15 sec injection duration, and the values of PPP did not differ significantly between the 10 and 15 sec injection duration. When injection duration increased, mean arrival time to PVP (p = 0.056) and HPP (p = 0.065) tended to increase, but there was no significant difference among injection durations (Table 1).
When injection duration increased, the mean interval between AEA and AEP increased gradually. The value (6.9 sec) of the 10 sec injection duration was significantly longer than that (3.8 sec) of the 5 sec injection duration, and significantly shorter than that (10.1 sec) of the 15 sec injection duration. The interval between AEP and PPP tended to increase, but was not significantly different (Table 2).
Experiment 2
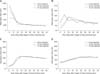
The mean attenuation value at the aorta with 5 sec injection duration was highest in the scan section of 0–5 sec with no diagnostic scan delay after triggering, and this value was significantly higher than that in the next scan section of 5 to 10 sec with a 5 sec diagnostic scan delay (panel A in Fig. 2). With the 10 sec injection duration, the mean attenuation value at the aorta was highest in the scan section with no diagnostic scan delay, and was not significantly different from that in the next scan section; however, it was significantly higher than that in the scan section with a 10 sec diagnostic scan delay. With a 15 sec injection duration, the mean attenuation value at the aorta was highest in the scan section with a 5 sec diagnostic scan delay. The value was not different significantly from that in the former scan section with no diagnostic scan delay, and was significantly higher than that in the next scan section. The peak curve in mean attenuation values for the aorta had a longer plateau with a 10 and 15 sec injection duration than with a 5 sec injection duration, and shared a similar pattern since as the scan section with a 15 sec diagnostic scan delay.
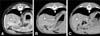
The pancreatic mean attenuation values with 5, 10, and 15 sec injection durations were highest in the scan sections with 5, 10 and 10 sec diagnostic scan delays, respectively (panel B in Fig. 2 and Fig. 3). The maximum attenuation value with a 5 sec injection duration was significantly higher than those in the former and subsequent scan sections. The peak values with 10 and 15 sec injection durations were significantly higher than those in the former scan section, and were not significantly different from those in the next scan section. The change in the mean attenuation values for the pancreas showed a prolonged peak point with 10 and 15 sec injection durations, and had the longest plateau with a 15 sec injection duration.
Overall, the mean attenuation values of the portal vein and hepatic parenchyma were high in the scan sections with 15 and 35 sec diagnostic scan delays in all subexperiments. The contrast enhancement changes about portal vein and hepatic parenchyma in all subexperiment had the similar pattern (panel C and D in Fig. 2).
Peak mean attenuation values of the aorta in each subexperiment decreased when injection duration increased. The value observed for the 10 sec injection duration was significantly lower than that of the 5 sec injection duration, while it was significantly higher than that of the 15 sec injection duration (panel A in Fig. 2). There was no significant difference among peak mean attenuation values of the pancreas, portal vein, and liver.
Discussion
Arrival time to the AEA after injection of contrast material is affected by delivery rate from the injection site to the aorta, while the blood flow rate and distance between the contrast material injection site and aorta determine the delivery rate [2]. Therefore, it is believed that the arrival time to the AEA is highly influenced by the injection rate of the contrast material. In human medicine, it has been reported that a faster injection rate increases the delivery rate [261114]. In the present study, the mean arrival time to the AEA of the contrast material was longer when there was a 10 sec injection duration than with a 5 sec injection duration, but the mean arrival time with a 15 sec injection duration was not longer than that with a 10 sec injection duration, despite the decrease in injection rate. A low injection rate of 1.2 to 2.0 mL/sec is appropriate for procedures with a long scan duration because of the long injection duration in human studies, but a long injection duration with a fixed small volume of contrast material may result in too low an injection rate to generate sufficient contrast enhancement [226]. Such a low injection rate can lead to unexpected arrival times at the AEA with a 15 sec injection duration.
In a theoretical physiologic model, the arrival time to the AEP is the sum of the injection duration and the contrast material arrival time [36]. In this study, we found that the arrival time to the AEP increased with increased injection duration. The difference in mean arrival time to the AEP between 5 and 15 sec injection durations was over 6 sec in this study, which means that the injection duration should be considered when determining the scan delay for the arterial phase with a short plateau of contrast enhancement. With a fixed volume of contrast material, a short injection duration increases the contrast enhancement, as occurred in this study, while a longer injection duration allows for a long scan duration with appropriate contrast enhancement [26]. A CT scan with a diagnostic scan delay and injection parameters during a 5 sec injection duration is recommended to obtain better quality images for the arterial phase.
The PPP has a more similar contrast enhancement pattern to the aorta than the liver because of the arterial blood supply of the pancreas, which has a first-pass effect via rapid delivery of contrast material, and is not influenced by portal circulation [31]. In this study, when injection duration increased, the arrival time to the PPP increased similar to that of AEP. Thus, the contrast enhancement pattern of the pancreas may have a major effect on the injection duration, and the fixed scan delays or diagnostic scan delays using the bolus-tracking technique should be determined with regard to injection duration of contrast material in multi-phase CT scans of the canine pancreas.
Contrast enhancement of visceral organs such as the liver increase more gradually than aortic enhancement because of the portal circulation with the long pathway [26]. The results of this study showed that the CT images of the portal phase and hepatic parenchymal phase are influenced to a relatively lesser degree by injection duration in the multi-phase CT scan. However, a longer injection duration of 30 and 60 sec resulted in differences in the hepatic parenchymal enhancement peak in a veterinary study [30]. In previous veterinary literature, although the start of the portal phase cannot always be set at the PVP by the inter-scan reset, it has been reported that the variation does not affect scan quality [32]. In humans, CT scan with a more delayed time for the portal phase was recommended because the scan delay of the PVP may not be optimal for evaluating venous invasions owing to the frequent presence of heterogeneous enhancement caused by incompletely mixed contrast material returning from organs through the portal veins [12]. In this study, changes in mean attenuation with 5 sec intervals for portal vein and hepatic parenchyma had long enhancement plateaus, similar to those with 5, 10 and 15 sec injection durations. These findings indicate that the scan duration for the portal or delayed phase can be set up at any point within the long plateau. It is believed that the variation in scan delay in response to a shorter injection duration is not important in the portal or delayed phase, although the arrival time to the PVP and HPP tended to increase as injection duration increased in this study.
The bolus-tracking technique is a useful method for determination of scan timing in multi-phase CT [19], and accurately knowing the diagnostic scan delays is important for obtaining optimal phase images. Considering the CT scan-related factors affecting scan timing, optimal scan delay was calculated as the enhancement peak time minus half of the scan duration [2]. Thus, the attenuation values for every 5 sec scan section in this study will provide useful information for determination of the diagnostic scan delays regarding the effects of contrast material injection duration during canine abdominal multi-phase CT scan using a bolus-tracking technique. On the contrary, because a scan duration of 5 sec was used for image acquisition in this study, it could be difficult to provide information regarding the optimal diagnostic scan delay of the arterial and pancreatic parenchymal phase when a CT scan with a duration under 5 sec is performed using the bolus-tracking technique.
Pancreatic parenchymal enhancement has a short plateau with fast growth, and the interval between AEP and PPP is shorter in dogs than in humans [1020]. Although it was not significant, the interval between AEP and PPP tended to increase when the injection duration increased. This was presumably because the TAC of the pancreas is less influenced by injection duration of the contrast material than the aorta. To acquire the optimal images of both the arterial and pancreatic parenchymal phase in dogs, higher speed CT scan is required. If a long scan time is required by a low speed CT scanner, the injection duration should be prolonged to maintain good enhancement throughout image acquisition.
These results do not provide coverage for the limitation of fixed scan delay, regardless of cardiac output as a major patient-related factor. Decreased cardiac output results in prolonged contrast enhancement, and the contrast enhancement pattern is little affected by body weight, size, age, and pathological conditions of hepatic and renal diseases [516182425]. In situations affected by these factors, it will be better to perform CT scans using the test bolus method.
Arrival times to AEP and PPP were delayed as injection duration increased, and the optimal scan delays of the arterial and pancreatic parenchymal phase in the multi-phase CT scan using a fixed scan delay or the bolus-tracking technique should be determined with consideration of injection duration. A 5 sec injection duration would be appropriate for high contrast enhancement using a high-speed CT scanner, while a 15 sec injection duration is recommended for low-speed CT, or for large animals requiring a large amount of contrast material. Fixed scan delay or diagnostic scan delay for the injection duration could be determined based on the results of this study. In conclusion, injection duration and scan delays should be simultaneously considered while performing multi-phase CT scans for canine abdominal organs.
 XML Download