

 PDF
PDF ePub
ePub Citation
 Print
Print


Introduction
Mycoplasma (M.) hyosynoviae is known for causing non-purulent arthritis in growing pigs [1622], and its ubiquitous nature in pig populations [1122]. Pigs of all ages are believed to be susceptible to colonization [1012]. Sows are presumably the primary infectious reservoir, and piglets can become colonized prior to weaning, or by horizontal transmission post-weaning [817]. Upon colonization, M. hyosynoviae can persist in the tonsils and animals may become life-long carriers [217]. Bacteremia occurs in a subset of susceptible pigs, and has been shown to precede clinical disease [7]. Although the disease risk factors are not fully understood, M. hyosynoviae-associated arthritis is often reported to occur upon exposure to environmental stressors such as temperature fluctuation, increased stocking density, and commingling of non-litter mates [15]. However, the virulence determinants and host pathways that converge to the occurrence of the disease phenotype typically seen in field cases are still not understood [111]. Although M. hyosynoviae-associated disease has been experimentally reproduced before [71218], this study was conducted to determine if distinct clinical isolates could have different disease phenotypes, and which inoculation route and infectious dose combination would be more robust to reproduce them. Additionally, multiple diagnostic specimens were tested for the presence of M. hyosynoviae and induced histological alterations to determine the optimal criteria for clinical diagnosis.
Materials and Methods
Two clinical isolates obtained from temporally, spatially, and herd-source differing field cases (diagnosed by the Iowa State University Veterinary Diagnostic Laboratory; ISU-VDL) of pig M. hyosynoviae-associated arthritis (i.e., 3491 and 3496) were used to challenge pigs intranasally (IN) or intravenously (IV). Pigs inoculated IN with isolate 3491 received either 5 mL (n = 5 per group) or 10 mL (n = 5 per group), while all pigs inoculated IN with isolate 3496 received 10 mL (n = 5 per group). Animals inoculated IV received 2 mL of either 3491 (n = 11) or 3496 (n = 7). Control animals (n = 4) received the same medium used to grow this bacterium either IN (n = 3) or IV (n = 1). For this study, six to twelve week old cesarean-derived colostrum-deprived (CDCD) specific-pathogen-free (SPF) pigs were acquired from a herd known to be free of all major swine mycoplasmas including, M. hyopneumoniae, M. hyosynoviae, M. hyorhinis, and M. flocculare, as determined by serology and species-specific conventional or quantitative polymerase chain reaction assays (qPCR) of nasal swab and tonsil scraping fluid samples from all experimental animals [3521]. The pigs were housed in a BSL-2 facility at the ISU-VDL and all husbandry procedures were carried out following routine SPF facility biosecurity protocols to prevent cross-contamination. Pigs were fed commercial feed with no antibiotics (Nature's Made; Heartland, USA). Prior to M. hyosynoviae inoculation, all pigs were treated intramuscularly with 2 mL of ceftiofur sodium (Excede; Zoetis, USA) to prevent post-arrival infection with any other bacteria. All animal experimental protocols were approved by Iowa State University's Institutional Care and Use Committee.
Inoculum preparation and animal inoculation
Culture of M. hyosynoviae was carried out using previously described protocols [1820]. The two clinical isolates used herein were isolated from clinical specimens known to be devoid of any other major swine bacterial and viral pathogens by the ISU-VDL (i.e., Haemophilus parasuis, Streptococcus suis, M. hyorhinis, Salmonella spp., Erysipelothrix rhusiopathiae, Porcine circovirus, and Porcine reproductive and respiratory syndrome virus). For isolation, a 1 : 10 ratio of filtered joint fluids from selected clinical specimens were inoculated into Difco pleuropneumonia like organism (PPLO) (Difco; BD Biosciences, USA) based media with turkey serum (15%) and mucin from porcine stomach (5%) broth and incubated at 37℃ for 3 to 7 days. After the initial culture, an aliquot of culture fluid was tested for the presence of M. hyosynoviae by qPCR [3]. To confirm the absence of contaminating bacteria, routine aerobic culture for non-mycoplasma species was also performed using both chocolate agar and blood agar plates. To develop challenge material, 1 mL of frozen stock of each isolate was adapted to Difco PPLO media supplemented with 15% heat-inactivated horse serum (Donor Horse Serum; Atlanta Biologicals, USA), termed Difco horse sera (DHS). All sera utilized throughout the study were heat inactivated at 56℃ (via water bath) for 30 min prior to use. Media was mixed and pH adjusted to 7.4 (via 1N HCl or 1N NaOH) before being 0.22 µm filtered and placed at 37℃ for 48 h to check for contamination by visual inspection for turbidity. Each media was then aliquoted into 1.8 mL in 30 tubes to set up a ten-fold serial dilution series in triplicate. Frozen stock M. hyosynoviae cultures at passage 2 (p2), 3491 and 3496, were thawed at room temperature, after which 0.5 mL was used to inoculate 5 mL of D-TS. Prior to DHS inoculation, Difco Turkey Serum was used for the initial passage to ensure growth from frozen stock. Following 24 h of incubation at 37℃, 0.2 mL of p3 were serially diluted into DHS and incubated. The challenge inocula were prepared in Difco PPLO media supplemented with 15% heat-inactivated horse serum (Donor Horse Serum; Atlanta Biologicals) to prevent anaphylaxis. To prepare challenge material, 1 mL of each DHS-adapted isolate was passed into 5 mL of fresh DHS, after which a final inoculum was passed into 25 mL of media for challenge administration. A 100 µL (10−1 dilution) sample was subsequently spread plated onto blood and chocolate agar plates for purity verification. Next, 10 µL (10−2 dilution) was plated onto brain heart infusion (BHI) agar plates to confirm mycoplasma growth by morphology. All plating was performed in triplicate throughout the experiment. Quantification of all inocula, as per color-changing unit-CCU per mL, was performed by dilution plating on DHS agar plates and inoculating broth [20]. Color-changing units per mL were calculated using arginine and phenol red, and a total of 1010 CCU per mL was used for IV and IN inoculation upon restraining all animals as previously described [720]. For inoculation, animals were restrained with a snare as previously described [10]. Despite the route and volume of inoculum administered, a 1010 CCU per mL of either isolate was used. IV inoculation was carried out using a butterfly catheter in an ear vein; whereas, for IN administration half of the inoculum was placed into each nostril using a sterile syringe [718].
Clinical observations and in vivo sampling
Pigs were clinically monitored prior to and after inoculation for any clinical signs, particularly lameness. A single evaluator collected all observations throughout the study to ensure consistency. Lameness was scored from 0 to 3 (from slightly to severe clinical signs) as previously described [12]. Whole blood, nasal swabs, and tonsil scraping samples were collected prior to inoculation, and every 2 to 3 days post-inoculation (dpi) until necropsy. A fraction of all blood samples was then centrifuged at 2,000 × g for 10 min, after which serum was aliquoted into 5 mL tubes (BD Falcon; BD Biosciences, USA). Whole blood was collected using a 10 mL EDTA (K2) tube (BD Vacutainer; BD Diagnostics, USA). Nasal swabs were collected using a single 15 cm sterile nylon flocked swab (Puritan; Puritan Medical Products, USA) sampling both nares each time, and placed into 5 mL polystyrene round bottom snap-cap tubes (BD Falcon; BD Biosciences) containing 2 mL of 1× sterile phosphate buffer saline solution (PBS; Invitrogen, USA). Tonsil scrapings were collected by holding the mouth open with a sterilized oral speculum and scraping the surface of the tonsil using a sterilized, blunt stainless steel spoon with an elongated handle [23]. Tonsil scraping contents were then collected from the steel spoon using a 15 cm sterile nylon swab (Puritan; Puritan Medical Products) and placed into 5 mL tubes (BD Falcon; BD Biosciences) containing 3 mL of sterile 1× PBS. All samples were stored at −20℃ until assayed.
DNA extraction and quantitative PCR
DNA extraction was performed using magnetic beads (MagMAX Total Nucleic Acid Isolation Kit; Applied Biosystems, USA) in a semi-automatic system (KingFisher 96 Magnetic Particle Processor; Thermo Fisher Scientific, USA) according to the manufacturer's instructions, after which samples were frozen at −20℃ until assayed for M. hyosynoviae by qPCR [3]. All clinical specimens including nasal swab, whole blood, serum, tonsil scraping, and synovial fluids or swabs were tested in duplicate for M. hyosynoviae by qPCR [3519]. qPCR was also used to detect the presence (1) or absence (0), and to determine the M. hyosynoviae load per 2.5 µL of blood, serum, and joint samples [3].
Necropsy and histopathology
Euthanasia was performed by administering a barbiturate overdose (Fatal-Plus; Vortech Pharmaceuticals, USA) via IV injection. At 12, 14 or 15 dpi, animals were necropsied, and the following joint cavities were sampled: scapula-humeral, humero-radial, coxi-femoral, femoro-tibial, and tibio-tarsal from the right and left side of each animal. Joint fluids or swabs were aseptically collected for M. hyosynoviae qPCR. Synovium tissues were placed into a 10% buffered formalin solution for histopathology evaluation. In addition, tonsil tissues were collected and ground in 10 mL of 1× PBS for M. hyosynoviae qPCR detection. Joint fluids were also plated on blood agar, chocolate agar, and BHI, and were cultivated aerobically at 37℃ for 3 to 5 days to check for extraneous bacterial growth. The histopathology scoring used was modified from a previously described method [6]. Histopathology scores for each sample were combined to provide a composite inflammatory score ranging from 0 to 15. Scoring was conducted by a board certified veterinary pathologist who was blinded to all treatments.
Statistical analysis
Statistical analysis of the data was performed using the GraphPad Prism 6 (GraphPad Software, USA) and MedCalc 15.6 (MedCalc Software, Belgium). Descriptive analysis was initially conducted to assess the overall quality of the data. The proportion of clinical cases, degree of lameness cases, and qPCR positive joints per group, were analyzed using a Chi-squared test (GraphPad Prism 6). One-way ANOVA was used to compare the percentage of clinical cases across treatments over time. Histopathology scoring was analyzed using a non-parametric one-way ANOVA (Kruskal-Wallis) followed by multiple group comparison using Dunn's test. The significant level across all analyses was based on a p < 0.05. Receiving operating characteristic curve analysis was used to determine the cut-off point for the histopathology score to differentiate diseased vs. non-diseased animals using MedCalc 15.6. After establishing the cut-off, the histopathology results were converted to a binary variable, with 0 indicating joints below the threshold histopathology score threshold of 1, and 1 indicating all other values. It should be noted that the binary value of 1 is different than the histological score of 1. It simply happens that the threshold established for the microscopic alteration equals 1. This was justified based on the microscopic score of 0 for all joints in the control group and the score of 1 in the disease group being a morphological alteration typically found in M. hyosynoviae infected animals (i.e., synovial cell proliferation). The qPCR test results were also interpreted as negative (0) or positive (1) [3]. The combination of both metrics (i.e., histopathology and qPCR) was then used to verify the odds ratio-OR to predict clinical disease. The OR was subsequently analyzed using a 95% confidence interval, which implies that if the value of 1 is included in this interval, there is absence of difference for disease vs. no disease occurrence given this diagnostic criterion.
Results
Clinical findings
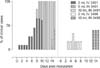
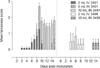
All pigs used in the study were clinically healthy prior to challenge. Anaphylaxis did not occur upon inoculation. Lameness was clinically evident post challenge; however, it varied in severity in pigs from each inoculation group, regardless of isolate, volume, or route of inoculation (Fig. 1). Overall, a higher proportion of cases was observed in animals inoculated with isolate 3491 vs. 3496, with disease developing more rapidly upon IV inoculation. IN inoculation also led to robustness in the development clinical disease when using 10 mL of inocula. A significantly higher proportion of cases and longer duration of lameness were observed for isolate 3491 vs. 3496. Due to limited availability of CDCD-SPF pigs, the 5 mL volume for IN was only assessed for isolate 3491. A significantly higher mean lameness score was observed for animals inoculated IN with 10 mL of isolate 3491 compared to 5 mL, and this was greater than IV administration (Fig. 2). Overall, only mild lameness was observed for isolate 3496, despite the inoculation route.
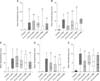
M. hyosynoviae detection by qPCR
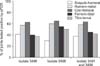
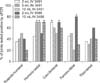
At least 30% of the joints tested positive for M. hyosynoviae by qPCR at necropsy, regardless of the route of inoculation and isolate used in the challenged groups. Approximately 60% of all samples tested from two joints (humero-radial and coxi-femoral) were qPCR positive when combining data from all routes of inoculation for each isolate separately or together (Fig. 3). No significant differences were found when comparing either the proportion of M. hyosynoviae positive joints among anatomical location were observed within each inoculated group, or in the log10 bacterial load/2.5 µL of sample among positive samples across groups (data not shown). Conversely, significant differences in the proportion of M. hyosynoviae positive joints were found when inoculated groups were compared within each anatomical location. Specifically, a higher proportion of positive samples was found for the following groups given in three joints: 5 mL IN 3491, 10 mL IN 3491, and 10 mL IN 3496 for the humero-radial joint (p = 0.0238); 2 mL IV 3491 and 3496 for the coxi-femoral joint (p = 0.025); and 2 mL IV 3496 for the femoro-tibial joint (p = 0.0115) compared to other challenged and control groups (Fig. 4). The tonsils of all inoculated animals were consistently positive for M. hyosynoviae; however, bacteremia was very rarely detected in whole blood or serum (data not shown). All control animals were negative for M. hyosynoviae in the joint cavity, tonsils, blood, serum, and nasal cavity. No other bacteria were found in the joints of inoculated animals.
Histopathology
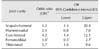
All challenge groups had at least one joint that was significantly more affected than the control group. The coxi-femoral joint was most consistently more affected in the challenge group than the control group. Specifically, with the exception of the group receiving 10 mL IN of 3496, all challenged groups had significantly higher histopathological alterations in the coxi-femoral joint than the non-challenge group (Fig. 5). When combining the histopathological and qPCR findings into a diagnostic metric, a significantly higher likely of developing clinical disease vs. none was associated with being qPCR positive and having histopathological lesions in joints except for the femoro-tibial joint (Table 1).
Discussion
Mycoplasma hyosynoviae is one of the major causative agents of arthritis in post-weaning pigs, particularly in growing-finishing animals, along with M. hyorhinis, and other bacteria such as Haemophilus parasuis, Streptococcus suis, Erysipelothrix rhusiopathiae, and Salmonella enterica serovar choleraesuis [4]. M. hyosynoviae induces a non-suppurative self-limiting lameness in growing-finishing pigs [22]. Because M. hyosynoviae-associated arthritis is considered a re-emerging problem in swine production, particularly in the United States [4], there is an increasing need to further investigate the epidemiology and pathobiology of the disease associated with it. While experimental induction of arthritis by this bacterium has previously been described by both intranasal and intramuscular inoculations [71218], the present study was conducted to compare the robustness of such an experimental approach when varying the clinical isolate origin, route of inoculation, and volume of inocula. Additionally, sampling of multiple clinical specimens was conducted prior to and at necropsy in attempt to propose an optimal diagnostic approach for M. hyosynoviae detection and case confirmation. The pathogen detection was then compiled with the histopathological scoring to create a criterion to be used in defining the disease status of an infected animal.
It is particularly important to mention that the use of CDCD-SPF pigs ensured experimental success in this setting. This approach prevented potential confounders such as the presence of cross-reactive antibodies with other swine mycoplasmas, as well as co-infections with other major swine pathogens from impacting the study outcome [5]. As age had been previously shown to not influence disease severity of M. hyosynoviae-associated arthritis, six to twelve week-old CDCD-SPF pigs were used in this study [12]. Following inoculation, and irrespective of the isolate, route, and volume of inocula, a high prevalence of animals tested positive for M. hyosynoviae in the tonsil, but not in the nasal cavity. Although this finding is not correlated with clinical outcome, it suggests that the tonsil might be the primary reservoir for long-term carriage [71012]. Factors driving M. hyosynoviae tropism for the tonsil rather than the nasal cavity are currently unknown [111]. Given that long-term carriage in the tonsil is the likely source of joint infection via septicemia within an animal, it is possible that a source (tonsil)-and-sink (joint) infection dynamic could explain the infection process [914]. Although bacteremia was rarely in the whole blood or serum, as opposed to in previous studies [7], the absence of the pathogen from certain joints at necropsy supports this potential dynamic. Specifically, disease re-occurrence within an animal, or joint inflammation driven by this pathogen, would be dependent on multiple joint invasions from organisms from the tonsil. Even though this is an interesting association, it is yet to be experimentally demonstrated. Nonetheless, it is important to mention that, for epidemiological surveillance, tonsil sampling may be more effective than nasal swabbing. These findings also suggests that pen-based oral fluids can be effective in herd screening [3].
The comparison between the two M. hyosynoviae clinical isolates indicates that isolate 3491 is more virulent than 3496. The IV route tends to induce clinical disease faster than IN for both isolates, but to last for a shorter period than IN. That distinctive pattern of IV vs IN may be explained by how fast the bacterial population can invade the joint tissue. However, the fact that clinical diseases show a more rapid decrease in prevalence and severity via the IV route than when using 10 mL of inocula IN indicates that the resolution of the inflammatory process is also more rapid for the former. This is an important finding because there are advantages and disadvantages for both routes of inoculation with respect to studying the pathogenesis of this bacterium. In particular, if one is interested in reproducing what is occurring in natural pig populations, the IN route would be more suitable given that horizontal transmission is thought to occur that way. However, depending on the isolate used, disease may not occur in high frequency or severity. Conversely, by inoculating via IV, the experimental approach may become more robust and facilitate screening for isolates capable of causing more severe disease since it bypasses the initial colonization step of the upper respiratory tract. Yet, more isolates would have to be tested to define the most optimal route and volume of inocula and to determine the genotype-phenotype correlation across M. hyosynoviae strains [71322].
Although clear variations in distribution and severity of clinical cases were seen between isolates, the histopathology scores did not fully reflect these differences. This can be partially attributed to the variability in timing of the necropsy relative to the onset of clinical disease, in addition to the low or absent bacterial load in joints at necropsy. Despite the lack of specific joint tropism, the higher proportion of positivity, were seen for the humero-radial, coxi-femoral, and scapula-humeral joints. Combined, the qPCR and histopathological results suggest that their uselfuness for post-mortem diagnostics only comes when interpreted together as proposed in our diagnostic criterion. As suggested here, a cohesive diagnosis of M. hyosynoviae-associated arthritis should include the presence of the bacterium and typical morphological alterations of the synovia. In conclusion, this study demonstrated that clinical lameness caused by M. hyosynoviae can be reproduced by infecting CDCD pigs either IV or IN with no specific joint tissue tropism. However, the variability in disease phenotype, including pathogen detection and histopathological scoring, strengthens the idea that post-mortem diagnostic criterion has to be stringent to increase its accuracy. Moreover, given the demonstration that differing clinical isolates can have a distinct impact in clinical lameness, more comprehensives studies should be conducted with well-established collections of genotyped strains to determine the markers associated with virulence of this pathogen.
 XML Download