

 PDF
PDF ePub
ePub Citation
 Print
Print


Introduction
Kidney stones are a major health issue in humans and nonhuman animals [1930] that cause substantial morbidity, involving pain, potential of recurrent infection, and increased risks of hypertension and chronic kidney disease. A major factor in the development of kidney stones and the prevention of their recurrence is oral hydration status. Chronic dehydration has been identified as a major contributory factor in the development of stone disease [36], and increasing fluid intake decreases the risk of recurrent urolithiasis [220]. In one study, increasing fluid intake and urine output resulted in a significantly lower recurrence (12% vs. 27%) in stone formation [2]. Fluid intake may alter nephrolithiasis propensity through alterations in saturation characteristics of solutes, such as calcium and oxalate, involved in stone development and growth.
Another potential mechanism through which fluid intake may alter stone development is via alterations in the renal expression of organic components of kidney stones [15]. Approximately 5 to 10% of the kidney stone mass is organic material, which is generally believed to be of renal epithelial cell origin. A number of proteins have been identified in kidney stones. Quantitatively, the protein with the highest level of expression is generally identified as osteopontin (OPN) [1422]. Moreover, in experimental models, induction of intrarenal crystal formation is correlated with increased renal epithelial cell OPN expression [1333]. Genetic deletion or in vivo reduction of OPN expression appears to reduce the risk of renal crystal formation [82332]. Thus, variations in OPN expression appeared to play an important role in renal stone development.
In the present study, we tested the hypothesis that hydration status may decrease the risk of intrarenal crystal formation, at least in part, through alteration of intrarenal OPN expression.
Materials and Methods
A total of 18 adult male Sprague Dawley rats (200–250 g) were used. All studies were approved by the Ewha Womans University IACUC (EMRI 08-0092). Weight-matched pairs of rats were randomly assigned to three different groups (n = 6 per group). Control animals had free access to standard rat chow and water. Dehydrated rats had free access to standard diet, but were deprived of water for 2 days. Hydrated rats had free access to standard diet and 3% sucrose was added to their drinking water beginning 2 days before sacrifice. Although chronic dehydration has more powerful effects on stone formation, we used only 2-day deprivation for ethical reasons. The animals were individually placed in metabolic cages (Tecniplast, Buguggiate, Italy) for two days before sacrifice to collect daily 24 h urine samples. Animals were anesthetized with an intraperitoneal injection of tiletamine/zolazepam (10 mg/kg, Zoletil 50; Virbac Laboratories, France) and 2% xylazine hydrochloride (2 mg/kg, Rumpun; Bayer Korea, Korea) as previously described [18]. Blood samples were collected from the heart. Osmolality and sodium concentration were analyzed as previously described [1118].
Tissue preservation
Kidneys were initially flushed through the abdominal aorta with phosphate-buffered saline (PBS; pH 7.4) to rinse out blood as previously described [1118]. For immunoblot analysis, the right kidneys of animals were cut after clamping the renal pedicle. For immunocytochemistry or in situ hybridization, the left kidneys were subsequently perfused with 2% periodate-lysine-paraformaldehyde fixative for 10 min. All kidney samples were randomly assigned for immunoblot, immunohistochemistry, in situ hybridization and electron microscopy. The kidneys were sliced into 1 to 2 mm thick pieces and immersed in the same fixative overnight at 4℃. Tissues were then dehydrated in a graded series of ethanol and embedded in wax (polyethylene glycol 400 disterate; Polysciences, USA) as previously described [1118].
Antibodies
Mouse monoclonal antibodies to osteopontin from rat bone (MPIIIB10) were used as described previously [10].
Immunoblot analysis
Kidney tissues were processed for immunoblot analysis as previously described [910111718]. Briefly, tissues from the renal cortex and medulla were homogenized in lysis buffer containing 20 mM Tris-HCl, 1% Triton X-100, 150 mM NaCl, 0.5% sodium deoxycholate, 10 mM leupeptin, 0.1% SDS, 1 mM EDTA, 0.02% NaN3, and 1 mM PMSF. Homogenates were centrifuged and protein concentration was determined in the supernatant by the Coomassie method (Pierce Biotechnology, USA). Samples were separated by SDS-PAGE and transferred to nitrocellulose membrane. To reduce nonspecific antibody binding, membranes were blocked with 5% nonfat dried milk and incubated overnight at 4℃ with anti-OPN primary antibody (1 : 10,000). The next day, the membranes were washed several times in 0.01 M PBS (pH 7.4) and incubated for 1 h with peroxidase-labeled donkey anti-mouse IgG (1 : 1,000, Jackson ImmunoResearch Laboratories, USA). Blotted samples were visualized using enhanced chemiluminescence (Amersham Life Science, UK), imaged, and subjected to densitometric analysis with the Zero-Dscan software of the Eagle EYETMII Still Video System (Stratagene, USA) as previously described [1718].
Light microscopic immunohistochemistry
For light microscopy, four-micrometer wax sections were processed using immunoperoxidase procedures as previously described [9101117]. Briefly, sections were dewaxed and hydrated in ethanol series, then incubated with 3% H2O2 for 30 min to eliminate endogenous peroxidase activity. The sections were incubated in blocking solution (DakoCytomation, USA) for 30 min, and then in primary antibody (OPN 1 : 5,000) overnight at 4℃. The next day, sections were washed in PBS and incubated with peroxidase-conjugated anti-mouse IgG secondary antibody (Jackson ImmunoResearch laboratories) for 1 h. The sections were rinsed with PBS and treated with a mixture of 0.05% 3.3'-diaminobenzidine and 0.01% H2O2. Sections were then dehydrated in ethanol series, cleared in xylene, and mounted in Permount (Fisher Scientific, USA).
In situ hybridization
Tissue sections were processed for in situ hybridization as previously described [10]. After dewaxing, sections were treated with 0.2 N HCl for 20 min, then deproteinated with proteinase K (5 mg/mL) for 10 min at room temperature. Prehybridization was performed in buffer containing 50% formamide, 4 × SSC, 10% dextran sulfate, 1 × Denhardt's solution, and 1 µg/µL salmon sperm DNA for 1 h at 53℃. Subsequently, hybridization was performed with anti-OPN riboprobe (150 ng/µL) for 15 h. Sections were washed in buffer and incubated with anti-digoxigenin antiserum conjugated with alkaline phosphatase (Boehringer Mannheim, Germany). A color reaction (blue) was detected using an NBT/BCIP mixture (Boehringer Mannheim) as previously described [10].
Image analysis
Quantitative analysis of OPN immunohistochemistry and in situ hybridization were performed as described previously [4]. Microscopic images were captured and processed using the AnalySIS software (Soft Imaging System, Germany). Briefly, images taken under the same conditions of lighting were deconvoluted to separate the brown DAB (immunohistochemistry) or blue alkaline phosphatase (in situ hybridization) staining. Background intensity was subtracted via the threshold function and the staining occupied by OPN labeling was digitally calculated as previously described [4].
Transmission electron microscopy
Tissue sections were processed for electron microscopy as previously described [101117]. Briefly, sections were treated with 50 mM NH4Cl for 15 min, then pre-incubated in solution containing 1% bovine serum albumin, 0.05% saponin, and 0.2% gelatin for 3 h. Sections were then incubated with anti-OPN primary antibody overnight at 4℃. The next day, sections were washed several times with PBS and incubated in peroxidase-conjugated secondary antibody (Jackson ImmunoResearch Laboratories) for 2 h. After washing in 0.05 M Tris buffer (pH 7.6), sections were incubated in a mixture of 0.05% 3.3'-diaminobenzidine and 0.01% H2O2 for 10 min. The sections were then washed sequentially with 0.05 M Tris buffer and 0.1 M phosphate buffer, after which they were post-fixed in 1% glutaraldehyde and 1% osmium tetroxide for 1 h at 4℃. After washing with 0.1 M phosphate buffer, sections were dehydrated in a graded series of ethanol and embedded in epoxy resin (Epon 812; Sigma-Aldrich, USA). Ultrathin sections were cut, counter-stained with 1% uranyl acetate, and photographed with a transmission electron microscope (H-7650; Hitachi, Japan).
Scanning electron microscopy
Kidney tissues were fixed in 2.5% glutaraldehyde in 0.1M phosphate buffer for 2 h at 4℃. Tissues were next washed with phosphate buffer, then refixed in 1% osmium tetroxide for 1 h at room temperature. After washing with buffer, tissues were dehydrated in a graded series of ethanol (from 50% to 100%), then dried in a critical point dryer (HCP-2; Hitachi). Dried tissues were mounted using sticky carbon tape on an aluminum specimen holder and coated with platinum in an ion-sputter (E-1030; Hitachi). Finally, tissues were examined with a S-4700 electron microscope (Hitachi).
Results
Physiological data
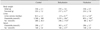
Table 1 shows the physiological data describing the control, dehydrated, and hydrated animals. At the beginning of the experiment, there was no difference in body weight among the groups. At the end of the study period, dehydrated animals had lost body weight (235 ± 3.6 to 217 ± 4.7 g), while control and hydrated animals showed gradual weight gain. There was no difference in weight gain between control and hydrated rats. Dehydration significantly reduced urine volume, increased urine osmolality, and increased urine Na+ concentration. In contrast, hydration increased urine volume, decreased urine osmolality, and decreased urine Na+ concentration (Table 1).
Immunoblot analysis
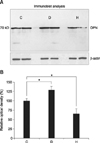
Fig. 1 shows the results of immunoblot analyses and the relative optical densities of proteins from the renal medulla. Immunoblot analysis against OPN showed a single band corresponding to approximately 70 kD, which is characteristic of OPN on standard SDS-polyacrylamide gels. The OPN expression was increased in dehydrated rats (129.2% vs. 100%, p < 0.05), and decreased in hydrated rats (65.7% vs. 100%, p < 0.05) when relative optical densities were compared using control rats as a 100% reference. The OPN protein was undetectable by immunoblot of renal cortical homogenates during these experiments.
Light microscopic immunohistochemistry
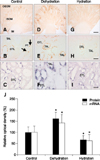
In control animals, OPN immunoreactivity was observed in the descending thin limb of Henle's loop in the inner stripe of the outer medulla (panel A in Fig. 2). Immunostaining was strongest in the initial part of the descending thin limb, continuous with the S3 segment of the proximal tubule (panel B in Fig. 2). Occasionally, faint immunostaining was observed in some proximal tubules and the parietal epithelium of Bowman's capsule (data not shown). Overall, the level of immunolabeling in these cells in the cortex was substantially less than in the descending thin limb (data not shown).
Dehydration caused a marked increase in OPN immunoreactivity in the inner stripe of the outer medulla (panel D in Fig. 2). There was a moderate increase in immunoreactivity in the descending thin limb. In addition, strong labeling was present in thick ascending limb segments, notably at the apical surface of the cells (panel E in Fig. 2). Occasionally, a few cells of some distal convoluted tubules and the parietal epithelium of Bowman's capsule exhibited positive immunostaining in the cortex (Fig. 3).
In hydrated animals, OPN immunoreactivity was only observed in the inner stripe of the outer medulla (panel G in Fig. 2). High-power micrographs showed that there was a significant decrease in immunostaining intensity in the descending thin limb relative to control-treated rats (panel H in Fig. 2). Consistent immunolabeling was not identified in any other cellular structure.
In situ hybridization
Because OPN can be secreted, its expression in renal epithelial cells could result from either production in the same cell or production in different cells and uptake in more distal epithelial segments. To differentiate between these possibilities and determine the cellular origin of OPN, we examined OPN mRNA expression using in situ hybridization under both basal conditions and following changes in hydration status. In control animals, strong OPN mRNA signals were present in the descending thin limb (panel C in Fig. 2). No detectable mRNA expression was identifiable in other cellular structures.
In dehydrated animals, OPN mRNA expression was detected in both the descending thin limb and the medullary thick ascending limb in the inner stripe of the outer medulla (panel F in Fig. 2). When compared to control animals, OPN mRNA expression in the descending thin limb was increased in dehydrated rats. In hydrated rats, OPN mRNA expression was present only in the descending thin limb (panel I in Fig. 2). When compared to control rats, expression intensity was decreased in the hydrated rats. No expression was identifiable in the thick ascending limb or in other renal cellular structures. Thus, the results of in situ hybridization study coincide with those of immunohistochemical studies.
Image analysis
Panel J in Fig. 2 shows the results of quantitative analysis of OPN immunostaining and in situ hybridization. Dehydration significantly increased OPN protein (161.46% vs. 100%, p < 0.05) and mRNA (142.72% vs. 100%, p < 0.05) expression when relative optical densities were compared to control rats. In contrast, hydration decreased OPN protein (67.07% vs. 100%, p < 0.05) and mRNA (62.17% vs. 100%, p < 0.05) expression.
Transmission electron microscopic immunocytochemistry
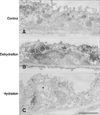
In the descending thin limb, OPN immunostaining was increased in dehydrated animals, while it decreased in hydrated animals (Fig. 4). Notably, the intercellular space between the thin epithelial cells was very narrow in dehydrated animals, while it was wide in hydrated animals (Fig. 4).
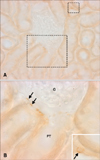
In dehydrated animals, strong OPN immunostaining was also observed in the Golgi apparatus and numerous small vesicles in thick ascending limb cells (panel A in Fig. 5). OPN expression was not detected in the thick ascending limb in hydrated animals (panel B in Fig. 5). In general, the surface of the thick ascending limb was smooth in dehydrated animals, while it was rough in hydrated animals (Fig. 5).
Scanning electron microscopy
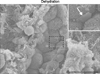
We investigated whether water deprivation for two days could affect kidney stone formation. Scanning electron microscopy revealed crystal-like structures in the tubule lumen in dehydrated rats (Fig. 6).
Discussion
The results of the present study demonstrate that hydration status affects OPN expression in the rat kidney. Dehydration significantly increased OPN expression in tubular epithelial cells, while hydration caused its expression to decrease. The dehydration-induced OPN was primarily localized in the apical side of epithelial cells in the descending thin limb and thick ascending limb.
There is general agreement that OPN is restrictively expressed in the descending thin limb of the loop of Henle under normal conditions in the rat kidney [101236]. However, under pathological conditions, OPN expression can be upregulated in many different tubule segments [36]. Angiotensin II-induced tubulointerstitial nephritis increased OPN mRNA and protein expression in cells of the distal tubules, collecting ducts and Bowman's capsule [7]. In models of glomerulonephritis and ischemic renal injury, OPN mRNA and protein levels have been detected in both proximal and distal tubules [2729]. In stone-forming rats, OPN staining of distal tubular cells was remarkably increased [1333]. We showed that dehydration upregulated OPN expression, particularly in the descending thin limb and thick ascending limb in the present study.
OPN appears to be an important mediator of inflammation and renal injury. In various tubulointerstitial nephritis and glomerulonephritis models, OPN expression in tubules preceded and was correlated with the sites and degree of monocyte/macrophage accumulation [572829]. Blockade of tubular OPN expression with either OPN neutralizing antibody or antisense oligodeoxynucleotide attenuated inflammatory cell infiltration and renal injury [2440]. Moreover, OPN knockout mice exhibited less inflammation than wild-type mice in models of renal injury [212526].
Dehydration is a common precipitating factor of ischemic renal injury. However, it should be noted that OPN was predominantly expressed at the luminal surface of the cells in the descending thin limb and thick ascending limb in the present study. The secretory direction to the apical side would not reflect the recruitment of interstitial inflammatory cells. Electron microscopy demonstrated that OPN was localized in the Golgi apparatus and small cytoplasmic vesicles in the apical region, indicating that it is synthesized in tubular cells and secreted into the lumen. Therefore, OPN upregulation may not have been associated with inflammation in the present study.
Increased OPN expression occurs in multiple models of renal crystal formation [1333]. In vitro, OPN stimulated the formation and adhesion of calcium oxalate crystals [16373839]. The majority of studies using either gene deletion or gene knockdown showed that gene deletion decreases the extent of crystal formation. In OPN knock-out mice, crystal formation was lower than in stone-forming mice [823]. In vivo knockdown of OPN using siRNA technology showed that decreased OPN expression was associated with significant protection against calcium oxalate crystal deposition in the ethylene glycol model of nephrolithiasis [32].
In the present study, urine volume significantly decreased and urine osmolality increased in dehydrated animals. Highly concentrated urine contributes to the supersaturation of elements such as calcium oxalate. Scanning electron microscopy demonstrated that dehydration resulted in the formation of crystal-like structures in the tubule lumen. Therefore, OPN upregulation may be associated with urinary stone formation.
However, it should be noted that the role of OPN in stone formation is still controversial [36]. In some in vitro experiments, OPN has been shown to inhibit growth and aggregation of calcium oxalate crystals [13135]. In an ethylene glycol administration model of calcium oxalate nephrolithiasis, OPN-deficient mice had significantly greater intratubular deposits of calcium oxalate crystals than wild-type mice [34]. These two completely different actions of OPN may be due to differences in experimental conditions; °however, further research is necessary to understand these differences. Moreover, the mechanism of renal OPN transactivation by water is incompletely understood at present. Mediators such as angiotensin II can potentially upregulate OPN [7], and dehydration often leads to activation of the renin-angiotensin system.
Interestingly, OPN expression decreased in hydrated animals. Many cytokines are known to stimulate OPN expression, while only a limited number of factors can inhibit its expression [36]. Good hydration is often helpful at preventing formation of urinary stones [220], but the underlying mechanisms have not yet been clearly elucidated. If OPN promotes stone formation, drugs or factors decreasing OPN expression will be useful to treat stone disease. Moreover, the decreased OPN expression during hydration may be protective.
The present study demonstrated that OPN expression and secretion is upregulated by dehydration, while it is downregulated by hydration in the rat kidney. These observations may provide new insights into the modulation of OPN expression in the kidney.

 XML Download