

 PDF
PDF ePub
ePub Citation
 Print
Print


Introduction
Magnetic resonance spectroscopy allows non-invasive measurement of the chemical composition of living tissues [11]. While MRI provides anatomical information based on the signals from water, magnetic resonance spectroscopy (MRS) provides chemical information regarding metabolites [2529]. In humans, proton magnetic resonance spectroscopy (1H-MRS) has been used to study brain disorders such as stroke, tumor, head trauma, developmental and degenerative disorders, and metabolic diseases [62529]. Protons are more commonly used for spectroscopy because of their natural abundance in organic structures and higher magnetic sensitivity relative to other nuclei such as phosphorus, sodium, carbon, fluorine, and lithium [29].
In MRS applications, the signals from water and fat are of lesser interest than those from smaller metabolites. Thus, a magnetic field of sufficient strength is required. Therefore, most clinical MRS measurements are conducted using magnetic resonance systems with field strengths of 1.5 Tesla (T) or higher [31]. Spectroscopy may be conducted using the single-voxel (where a spectrum is obtained from a voxel) or multi-voxel techniques (where data from multiple adjacent voxels are acquired simultaneously) [1127]. The metabolites measured with the 1H-MRS technique in the human brain include N-acetyl aspartate (NAA), choline (Cho), creatine (Cr), myoinositol (Myo), and lactate (Lac). NAA is generally considered a neuronal marker and Cr indirectly indicates energy metabolism. Cho and Myo are considered markers for the cell membrane and glial cells, respectively. Lac is the end-product of anaerobic glycolysis [361331]. These molecules can be distinguished based on the slight differences in resonance frequencies of nuclei in each molecule because of local changes in the magnetic field induced by their molecular structures.
Many studies in humans have reported normal variations in metabolite concentrations according to the technique used, brain region studied (left and right, anatomical region), gender, age, and tissue (gray [GM] or white matter [WM]) [12101518232834]. However, few investigations of 1H-MRS have been conducted in veterinary medicine [57131621223033]. These studies involved a canine model of various brain disorders, feasibility of MRS at 3.0 and 7.0 T, and reference values for various brain regions in healthy dogs. Recently, regional variations of metabolites in the brains of healthy beagles have been reported [72233]. Two of these studies used single voxel acquisition techniques at 1.5 and 3.0 T to demonstrate significant differences among regions of the brain [722], while investigators in another study used the multi-voxel technique by 3.0 T to evaluate the brain [33]. However, few small-animal practice facilities currently have access to 3.0 T MRI [22]. To the best of our knowledge, data on 1H-MRS acquired using the multi-voxel technique at 1.5 T in healthy dogs have not been reported. Therefore, this study was conducted to determine the differences in levels of cerebral metabolites between the right and left hemispheres, GM and WM, imaging planes, and anatomical regions to establish normal metabolite variations in healthy dogs using 1.5 T MRI.
Materials and Methods
This study was approved by the Animal Care and Use Committee of Chungnam National University (CNU-00333). Eight healthy male beagle dogs (1 to 4 years of age; mean, 2 years) weighing 7.6 to 12.5 kg (mean, 10.6 kg) were included in the study. All dogs underwent a complete physical examination, complete blood counts, serum biochemistry, and neurologic examination 24 hours before general anesthesia. The dogs were fasted for approximately 12 hours before MRI examination. Prior to MRI, general anesthesia was induced by the intravenous injection of propofol (Provive 1%; Claris Lifesciences, India) (6 mg/kg) and maintained with isoflurane (Ifran; Hana Pharm, Korea). These dogs were positioned in sternal recumbency with the head centered in the coil. The heart rate was continually monitored by electrocardiography and the respiratory rate was controlled using assisted mechanical ventilation. Upon completion of the procedure, the dogs were allowed to recover from anesthesia.
Magnetic resonance imaging and MRS of all canine brains was performed at 1.5 T (MAGNETOM ESSENZA; Siemens Medical Solutions, Germany) using an extremity coil. Conventional MRI including transverse (TR/TE 3980/81 ms), sagittal (TR/TE 2500/81 ms), and dorsal (TR/TE 3000/88 ms) T2-weighted turbo spin-echo sequences were obtained from the brains of all dogs. Scanning parameters were: slice thickness, 3.0 mm and field of view, 130 × 150 mm. The dorsal plane slices were oriented parallel to the hard palate. The transverse slices were obtained at right angles to the dorsal plane.
After conventional T2-weighted sequences, MRS was performed on all brains. A two-dimensional MRS sequence using point-resolved spectroscopy (TR/TE 135/1500 ms; thickness 10 mm; field of view 120 × 120 mm) was acquired. Multi-voxel sections (4 transverse, 2 dorsal, and 1 sagittal section) were positioned in T2-weighted images obtained from conventional T2-weighted MRI. The four sections of the transverse plane were located at the level of the frontoparietal lobe, thalamus, occipital lobe, and cerebellum. Two sections in the dorsal plane were located at the level of the lateral ventricle and thalamus. One section in the sagittal plane was located at the middle level. Nine volumes of interest (VOI) from seven sections were obtained. Two VOI were applied to two transverse sections at the level of the frontoparietal lobe and thalamus. Dimensions of the VOI varied depending on the area of the brain being imaged. VOI were maximally placed within the brain parenchyma. After the transmitter and receiver were automatically adjusted, the homogeneity of the magnetic field was optimized over the VOI using an automatic and volume selective shimming method. Full width at half maximum of all VOI was measured under 20 Hz.
MRS data were processed using a water reference by averaging 30 adjacent points, Hanning filtering at 512 ms width, zero-filling from 1024 to 2048 data points, Fourier transformation (32 × 32), and frequency shift correction (-0.03 ppm). After baseline correction by polynomial fitting and phase correction, the spectra were quantified using Gaussian curve fittings to measure the areas under the peaks.
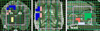
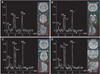
Individual voxels in each of the VOIs obtained from MRS were selected based on the anatomy (Fig. 1). Voxel location included the GM and WM of the frontoparietal, parietal, temporal and occipital lobes, thalamus, cerebellum, mid-brain and pons. In transverse sections at the frontoparietal level, the GM anatomically included the cerebral cortex of the frontoparietal lobe, putamen, globus pallidus, claustrum, and caudate nucleus. The WM included the frontoparietal lobe and internal capsule. The voxels were arranged into symmetrical pairs on each side of the midline. The number of voxels ranged from 1 to 7. Voxels corresponding to specific regions were averaged automatically. To evaluate differences in anatomical regions, the right side was selected at random. The location of every voxel was selected to omit bone structures and ventricles. Multi-voxel spectra images were obtained from the frontoparietal WM, parietal GM, temporal GM, occipital GM, thalamus, cerebellum, mid-brain, and pons (Fig. 2).
The metabolite concentrations of voxels corresponding to the left and right hemispheres, the GM and WM of the cerebral lobe, and specific regions at different planes were measured in each peak area of the spectra (NAA at 2.02, Cho at 3.20, and Cr at 3.03 ppm). Next, metabolite ratios (NAA/Cr, Cho/Cr, and NAA/Cho) were calculated for the major metabolites in each brain region.
All data were expressed as the means ± SD. An unpaired two-tailed t test or Mann-Whitney U test was used to compare differences in the metabolite ratio between the left and right hemispheres and GM and WM. An unpaired two-tailed t test or one-way ANOVA was used to compare differences in the metabolite ratio between the imaging planes (transverse, dorsal and sagittal). Differences in the metabolite ratios in each brain region were evaluated by one-way ANOVA using Tukey's b (post hoc tests algorithms). A p < 0.05 was considered statistically significant. All statistics were performed using a computer statistical package (SPSS ver. 21; IBM, USA).
Results
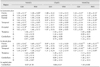
In the transverse plane, no significant differences in metabolite ratios (NAA/Cr, Cho/Cr, and NAA/Cho) were observed between the left and right hemispheres in the cerebrum, thalamus, and cerebellum. However, in the dorsal plane, significant differences in the NAA/Cr and NAA/Cho ratios were found in the left and right hemispheres of the frontoparietal and temporal lobes, but not in the thalamus and cerebellum (Table 1).
Metabolite ratios between the GM and WM did not differ significantly, except for the NAA/Cho ratio of the parietal lobe and the NAA/Cr ratio of the occipital lobe. No significant differences in metabolite ratios were observed between the GM and WM in the right hemisphere of the dorsal plane. However, in the left hemisphere, significant differences were observed in the NAA/Cr and NAA/Cho ratios were found (Table 1).
MRS spectra of the frontoparietal, temporal lobes and thalamus were obtained using two imaging planes (transverse and dorsal), while those of the cerebellum were obtained using three (transverse, dorsal, and sagittal). In the frontoparietal and temporal lobes, significant differences were detected in some metabolite ratios between the imaging planes. However, there were no significant differences between the transverse and dorsal sections of the thalamus (Table 1). The NAA/Cr ratio for the dorsal plane in the cerebellum was significantly higher than that for the transverse and sagittal planes. In addition, the NAA/Cho ratios for the cerebellum were significantly different among the three planes.
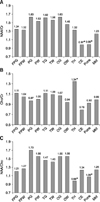
Regional differences in all measured metabolite ratios were detected (Fig. 3). The NAA/Cr ratio in the cerebellum and pons was significantly lower than in the frontal, parietal, temporal and occipital lobes, thalamus, and midbrain (panel A in Fig. 3). Additionally, the Cho/Cr ratio in the thalamus was significantly higher than in the remaining brain regions. The lowest Cho/Cr ratio was found in the cerebellum (panel B in Fig. 3). The NAA/Cho ratio in the thalamus and pons was significantly lower than that in the frontal, parietal, temporal and occipital lobes, cerebellum, and midbrain (panel C in Fig. 3).
Discussion
Previous 1H-MRS studies of the human brain have implemented the single-voxel technique, acquiring a single spectrum from a definite volume of tissue as an integral [9242526]. Although this acquisition is fairly rapid and easy, it provides limited information about the regional distribution of brain metabolites [8]. In addition, relatively large voxels encompass a large portion of the brain with limited discrimination of individual lobes [21]. Recently, one study using the single voxel technique showed that single voxel differentiation of gray and white matter is challenging because of the smaller size of the canine brain [7]. However, the multi-voxel technique is capable of obtaining multiple adjacent voxels covering large VOI and the spatial distribution of metabolites within a single sequence [8]. Therefore, the present study used the multi-voxel technique because the minimal single voxel size (10 mm × 10mm × 10 mm) was larger than the brain size, and this large voxel included adjacent structures, mixing individual lobes.
MRS can be obtained using different TEs that result in distinct spectra. Metabolites visualized using long TEs (135 to 288 ms) include NAA, Cho, Cr, and possibly alanine and Lac. Short TE acquisitions (< 40 ms) include the above metabolites, as well as Myo, glutamate and glutamine, glucose, and some macromolecular proteins and lipids [29]. Long TE has a worse signal-to-noise ratio than short TE, but can obtain spectra with a limited number of sharp resonances that are relatively easy to analyze [29]. Therefore, a long TE (135 ms) was used to easily image major metabolites (NAA, Cho, Cr) in this study.
In clinical settings, metabolite ratios are more frequently used than absolute metabolite values because of variations in susceptibility, coil loading, tissue composition, and changes in receiver gain [8]. The ratios conveniently remove the concerns of signal calibration and correction for variation in detection sensitivity [18]. Additionally, because metabolite ratios remove the arbitrary unit (MR units) assignment by any given MRI scanner, ratios are likely more clinically applicable across various scanners than are raw concentrations, taking into account the lower signal-to-noise ratio with lower field strength [3033]. Moreover, ratios are largely unaffected by CSF contamination of the voxel because the metabolite concentrations of interest are much lower in the CSF [14]. Cr is considered the most stable cerebral metabolite, and its concentration is relatively constant. Therefore, it was used as an internal reference for calculating metabolite ratios [29]. In humans, metabolite values have generally been observed to be symmetrical between the left and right hemispheres [1419]. In veterinary medicine, two studies revealed contradictory results [733]. A recent multi-voxel study reported asymmetry between the left and right hemispheres for all metabolites evaluated [33], while another demonstrated no significant differences between hemispheres [7]. In this study, the discrepancy of these results could be explained by differences in technique (multi-voxel vs. single voxel; long echo time vs. short echo time). Interestingly, the previous study revealed that there were no significant side differences in metabolite ratios in the transverse plane. We do not have a definitive reason to explain why the same multi-voxel technique showed different results. The NAA/Cr and NAA/Cho ratios in the GM and WM of the frontoparietal or temporal lobes in the dorsal plane were significantly different. More voxels corresponding to this region were located on the edges of the margins of VOI than in the thalamus and cerebellum. Although the majority of the VOI were placed within the brain, overlap with the calvaria was unavoidable when including the GM and WM in the dorsal plane. The concentration of lipids in the calvaria is considerably higher than that of brain metabolites [21]. Upon multi-voxel MRS, metabolite concentrations localized to one voxel actually represent the integrated metabolite concentration from the entire VOI [9]. Decreased magnetic field homogeneity and poor quality of spectra due to inclusion of substances (cortical bone, frontal sinus air) with different magnetic susceptibilities in the VOI may explain the differences between hemispheres for some metabolites. Therefore, in clinical MRS studies, comparison with the contralateral healthy area should be performed in the transverse plane less affected by the calvaria. However, further studies evaluating the differences between right and left hemispheres in a larger number of dogs are warranted.
Previous studies in humans have attempted to differentiate cortical GM from WM spectra [12815172024]. In studies using multi-voxel MRS in humans, significantly elevated NAA/Cr and Cho/Cr ratios were observed in the WM [815]. Another study reported higher NAA/Cho and Cr/Cho ratios in the GM than in WM [20]. In veterinary medicine, metabolite concentration ratios were greater in white matter than in gray matter [33]. In this study, differences in inherent metabolic activity between gray and white matter may differ between humans and dogs, as well as potentially among other species. In contrast to previous studies, we found no significant differences between the GM and WM in most spectra. The discrepancy with the results of other studies in humans or veterinary medicine may be due to differences in the studied region, spatial resolution used, and exact spectral location. The voxel bleeding effect, defined as contamination of the voxel with signals from adjacent voxels in a multi-voxel MRS, could further explain the results of this study. The overlapping areas between the GM and WM may make distinguishing tissue-types difficult, not only because of technical reasons, but also because the GM and WM anatomically overlap in the brain [32]. 'Pure' tissue selection may be very difficult because brain volume in dogs is much smaller than in humans. Therefore, voxel contamination is unavoidable in the distinction of GM and WM due to the brain and voxel size.
In this study, the metabolite ratios in the cerebral lobe and cerebellum, but not the thalamus, showed significant differences between the transverse and dorsal planes. These results could also be explained by the asymmetry of the hemisphere in the dorsal plane. A major difference between the two cerebellar regions is the concentration of NAA, which is significantly higher in the cerebellar hemispheres than in the central part. The concentrations of Cr and Cho were similar in both cerebellar areas but significantly higher than in any neocortical location [24]. These results support the finding that NAA/Cr and NAA/Cho ratios of the cerebellum differed significantly with the imaging planes. The hemispheres and the central part were not distinguished when the voxel was selected, demonstrating that MRS analyses comparing subjects or groups must be conducted in the same imaging plane. Additional information regarding the variations between cerebellar regions may be needed.
Numerous studies measuring the regional distribution of metabolites using 1H-MRS have been conducted in humans [128171824]. Several recent studies demonstrated metabolite differences among various regions in veterinary medicine [72233]. In agreement with the results of these previous studies, significant regional differences in all measured metabolite ratios were also found in the present study. In studies of humans, the largest metabolic difference between the cerebellum and other brain regions was found to be in the levels of Cr, both in the vermis and cerebellar hemispheres [1217]. One study suggested that the cerebellum had a smaller NAA/Cr and Cho/Cr ratio compared with the pons and midbrain [1718]. The NAA/Cr ratio in the cerebellum is lower than that of other cerebral GM and the thalamus [26]. The highest concentration of Cr is in the cerebellum, which is possibly related to the high creatine kinase activity [1224]. In veterinary medicine, two studies suggested that the NAA/Cr ratio was lower in the cerebellum than in other regions of the brain [722]. One study found that the creatine concentration was highest in the basal ganglia and cerebellum and lowest in the parietal lobes [7]. These findings may support our finding that the lowest values of NAA/Cr and Cho/Cr are found in the cerebellum. Another study showed that the levels of Cho are significantly higher in the thalamus than other regions of the brain, including the parietal or occipital GM and WM [4]. This could explain our finding that the ratio of NAA/Cho is lower and that of Cho/Cr is higher in the thalamus than in other regions, including the parietal GM, occipital lobe, and insular cortex. The origin of the high Cho signals in the insular cortex and thalamus is unknown, but they may reflect differences in the cellular composition of these regions from other GM [4]. No significant differences in the metabolite ratios between the cerebral lobes (including the GM and WM) were observed in this study. As in previous studies, no significant differences in the NAA/Cr and Cho/Cr ratios of the GM or WM were found [18]. The brain exhibits significant regional metabolic variations that should be considered when evaluating studies of pathology. Regional variations should be noted for MRS analysis in clinics and research.
It should be noted that this study was limited by the small number of experimental animals used; accordingly, further studies with a larger population are needed. In addition, other factors such as age and technique were not considered and should therefore be considered in future investigations.
In conclusion, metabolite ratios were found to be symmetric between the right and left sections of all brain regions. The NAA/Cr ratio was lower in the cerebellum than in other regions, while the thalamus had a higher Cho/Cr and lower NAA/Cho value than other regions. There were no differences in metabolite ratios between the GM and WM in the cerebral lobe. However, a significant difference in metabolite ratio was observed for the imaging planes. Therefore, MRS analysis should be conducted in the same imaging plane, ideally the transverse imaging plane. Measurements in the transverse plane are recommended for comparison of regional metabolites using 1H-MRS in clinical practice and in research.
 XML Download