

 PDF
PDF ePub
ePub Citation
 Print
Print


Introduction
Excessive obesity of ponies is a serious problem in contemporary veterinary medicine [15]. Obesity is often accompanied by metabolic disorders including equine metabolic syndrome (EMS) [7,15]. Ponies are considered to be a primitive breed that is especially susceptible to EMS, a life-threatening disorder that may lead to euthanasia [5,7]. A key factor that contributes to the development of endocrine diseases is an unhealthy diet, especially one rich in starch and simple sugars [6,7,22]. The course of the EMS is strongly influenced by chronic systemic inflammation that is caused by excessive expression of pro-inflammatory cytokines [6,23].
Adipocytes produce molecules such as leptin (LEP) and pro-inflammatory cytokines including tumor necrosis factor-alpha (TNF-α) and interleukin-6 (IL-6). The activities of these molecules are closely related and all three play an important role in regulating of the physiology of an organism [10,18,23]. LEP promotes the activation of monocytes and macrophages, stimulating them to produce TNF-α and IL-6. The importance of LEP in the inflammatory response is also related to the production of C-reactive protein (CRP) [1,19,20,25]. The roles of TNF-α in adipose tissue include (i) inhibition of gene expression that regulates the metabolism of fatty acids and glucose, and (ii) reduced secretion of certain adipokines with anti-hyperglycemic capabilities [12]. Moreover, increased activity of TNF-α affecting the insulin receptor tyrosine kinase activity is highly correlated with obesity, insulin resistance, and laminitis [13,30]. The functions of IL-6 include inhibition of adiponectin secretion, an anti-inflammatory hormone. IL-6 is mainly produced by monocytes and macrophages, but also by fibroblasts, lymphocytes, and endothelial cells. Similar to the LEP, IL-6 stimulates the synthesis of acute phase proteins, especially CRP [2,8,16,24]. Studies performed in humans have demonstrated the close relationship between obesity, insulin resistance, and high concentrations of IL-6 in plasma. Furthermore, IL-6 and TNF-α inhibits the activity of lipoprotein lipase (LPL) [17].
The concentrations of TNF-α and IL-6 in serum are often taken into consideration while studying the development of EMS. However, the expression of these factors and their localization in tissues has been neglected. Thus, the aim of the present study was to measure the expression and observe the localization of IL-6, TNF-α, and LEP in subcutaneous adipose tissue of ponies with EMS. We assumed that subcutaneous adipose tissue is a source of pro-inflammatory cytokines (i.e., IL-6 and TNF-α). The results obtained were correlated with data on serum equivalents of investigated cytokines in murine and human experimental models. We believe that these cytokines may behave as mediators of inflammation during the course of EMS development. In our opinion, measuring the concentrations of circulating cytokines and assessment of cellular protein levels may be crucial for better understanding the mechanisms underlying EMS pathogenesis in ponies.
Materials and Methods
Ethical approval
This research was approved by the II Local Ethical Committee of the Wrocław University of Environmental and Life Science (Poland).
Animals
A total of 16 Welsh Ponies (eight mares and eight geldings) owned by private individuals were used for the experiment. The age of the animals ranged from 7 to 15 (10 ± 3) years and resided in two provinces of Poland: Lower and Upper Silesia. All animals were able to go on outdoor walks, spending most days outside the stables and exercising with moderate intensity.
Case definition
Classification of the ponies was performed in two stages. Initially, 30 horses were included in the investigation. The ponies were screened for the study using the following steps: (i) extensive interview with the owners, (ii) measurement of body weight, (iii) estimation of body condition score (BCS) and crest neck scoring system (CNS) number, (iv) palpation and visual assessment the hoof capsule, (v) X-ray examination, (vi) measurement of resting insulin levels, (vii) combined glucose-insulin test (CGIT), and (viii) measurement of LEP concentration. During preliminary selection, all 30 animals were clinically examined (i-iv). Exclusion criteria of the ponies included: (a) normal body weight (x = 260 kg), (b) BCS < 6, CNS 0~1, (c) absence of divergent growth rings on the hoof (a symptom of chronic laminitis), and (d) pregnant mares, mares with foals, or young horses undergoing growth and development. Inclusion criteria were as follows: (a) overweight (x = 290 kg) or obese (x = 325 kg) animals, (b) BCS 7~8 (overweight~obese) or 8~9 (obese~extremely obese), (c) CNS 1~2 points or 3~5 points, (d) obese ponies with divergent growth rings on the hoof and (e) overweight animals with healthy hooves (no symptom chronic laminitis). Ponies with CNS 1 and that were overweight (BSC 7) were also incorporated into the study. Basis on the above criteria, 10 ponies were excluded (six with normal body weight, no divergent growth rings on the hoof, and CNS 1; one with normal body weight, CNS 1, and evidence of chronic laminitis; one pregnant mare; one 2-year-old horse, and one 8-month-old foal). Ultimately, 20 ponies were selected for further study (v-viii).
An X-ray examination of the 10 obese ponies enabled characterization of the coffin bone rotation and sinking that was associated with laminitis. The others ponies that were overweight were characterized by proper orientation of the coffin bone within the hoof capsule. Measurement of resting insulin levels allowed for further division of the animals into the appropriate groups. Ponies classified as healthy had insulin levels 6~20 uU/mL while animals with insulin concentrations 60~100 uU/mL were assigned to the experimental group. Despite the fact that the reference value of resting insulin is < 20 µU/mL, animals with the borderline result (i.e., 22~23 µU/mL) were excluded from the study. Next, 10 ponies with negative CGIT results were assigned 7~8 points on the BSC scale and 1~2 points on the CNS scale. LEP concentrations were categorized as normal (3~4 ng/mL) or high (> 7 ng/mL). Ponies with concentrations between 5.0~6.7 ng/mL were excluded from the study. Based on the above criteria, four ponies were excluded. Ultimately, the ponies were divided into experimental (group A, EMS ponies, n = 8) and control (group B, healthy ponies, n = 8) groups.
Body weight was measured using an electronic mobile Bosh equine weight scale (Bosch, Germany). The BCS was determined using a system developed by Henneke et al. [12] in which a numerical value for fat deposition ranging from 1 (poor) to 9 (extremely obese) is assigned. Additionally, all horses were evaluated using the CNS proposed by Carter et al. [4] for which numbers ranging from 0 (no palpable crest) to 5 (enormous neck) are given. An X-ray examination was performed to assess the gait and hoof capsule of the horses. Furthermore, palpation and visual assessments were conducted by veterinarians who could recognize subclinical and/or clinical signs of laminitis. Clinical examinations also included analysis of resting insulin levels and a CGIT. At 16 h prior to performing the CGIT, the horses received only 4 kg of timothy hay. Blood for analysis was collected from the jugular vein in order to measure the levels of resting insulin and glucose. Next, a 50% dextrose solution (150 mg/kg body weight [bw]) was injected intravenously and followed immediately by an insulin bolus of 0.10 U/kg bw (Humulin R; Eli Lilly and Company, USA) delivered intravenously. Glucose concentrations were measured at 1, 5, 15, 25, 35, 45, 60, 75, 90, 105, 120, 135, and 150 min after insulin administration using a glucometer (Glucosens 1040; ARKRAY, Japan) as previously described [6,21].
Blood and tissue sample collection
Fasting blood samples (10 mL) were collected from the external jugular vein of all ponies. Sterile techniques were performed throughout the collection process. The samples were transferred to polypropylene tubes (Monovette; Sarstedt, Germany) with serum clotting activator. Next, the samples were centrifuged at 1,137 × g for 10 min and temperature 4℃ (MPW 54; MPW Med. instruments, Poland). The serum was collected, and four aliquots were prepared and frozen in liquid nitrogen for further analysis. To measure glucose concentrations, blood was collected into tubes containing fluoride as a glycolysis inhibitor and EDTA as an anticoagulant (S-Monovette; Sarstedt). The preserved blood was analyzed within 24 h of collection. Adipose tissue samples (2 g) were collected from the base of the mane from each horse under local anesthesia (2% Lignocainum; Polfa Warszawa, Poland). The tissue samples were incubated in 10% buffered formalin for 24 h and temperature 4℃ and washed by Phosphate Buffered Saline-PBS (Sigma-Aldrich, Germany). All samples were dehydrated by increasing gradients of 50%, 60%, 70%, 80%, 96%, 100% and 100% ethanol. The samples were then imbued in ethanol/xylene 1 : 1 and clear xylene, both for 1 h at room temperature. After that the samples were embedded in paraffin.
Eenzyme-linked immunosorbent assay
Aliquots of serum were analyzed to determine the insulin, LEP, IL-6, and TNF-α concentrations. Measurement of each factor was performed using specific ELISA kits (insulin kit; Mercodia, Sweden; LEP kit; USBiological, US; IL-6 and TNF-α kits; Genorise Scientific, US) according to the manufacturers' instructions. Before the assays all samples were briefly centrifuged (1,137 × g; 5 min; temperature 4℃). The serum samples did not required dilution prior to the assays and were therefore transferred directly to plates pre-coated with a specific primary antibody. The samples were incubated at room temperature in the presence of the capture antibody for 2 h with the exception of the TNF-α kit for which the samples were incubated for 1 h. Measurement of insulin required addition of an enzyme conjugate immediately after the samples were applied. After incubation with the primary antibody, the serum samples were aspirated from each well and the plates were washed four to six times with Wash Buffer (supplied with the assay kits). For the IL-6 assay and TNF-α secondary detection antibody were applied, and the samples were incubated with detection antibody for 20 min at room temperature, while samples with anti-LEP secondary detection antibody were incubated for 30 min at 37℃. Next, the plates were washed as described above. Stop solution included to the assay kits was used to inhibit the reaction. Optical density of each well was immediately measured at 450 nm using a microplate reader (BMG LABTECH, Germany). The insulin kit used for the experiment had a sensitivity of 0.01 µg/L, while the precision of the assay expressed as co value (CV) was < 10% and < 12% within and between assays, respectively. Sensitivity of the test used for LEP determination was 0.242 ng/mL, while the intra-assay and inter-assay CVs were lower than 4% and 5%, respectively. The tests used for IL-6 and TNF-α measurements had a sensitivity equal to 0.8 pg/mL and an intra-assay CV of 6%. The inter-assay CVs for both the IL-6 and TNF-α tests was 9%.
Histochemistry and immunohistochemistry examination of the adipose tissue
Adipose tissue samples were prepared as 5 µm-thick sections cut with a Microm HM 340E microtome (Carl Zeiss, Germany) and placed on histological slides (Dako, Denmark). The sections were subsequently deparaffinized with xylene and rehydrated in ethanol (decreasing concentrations from 100 to 50%), and washed with distilled water. Next, the slides were stained with hematoxylin (Shandon; Thermo Scientific, USA) for 8 min, rinsed in running tap water for 10 min at room temperature, and stained with eosin (Shandon; Thermo Scientific) for 5 min at room temperature. The sections were then dehydrated by washing with ethanol (increasing concentrations from 50 to 100%) followed by xylene, and sealed with DPX mounting medium (AquaMed, Poland). The slides were viewed with a light microscope (Axio Imager A1; Carl Zeiss).
For immunohistochemistry, the tissue samples were cut into sections 3 µm-thick, deparaffinized in xylene, and rehydrated in alcohols with decreasing concentrations (decreasing concentrations from 100 to 50%). To visualize the antigen-antibody reaction was used EnVision System (Dako). Immunoperoxidase labeling was performed using polyclonal antibodies against IL-6 (Genorise Scientific) and TNF-α (R&D Systems, USA). Antigen heat-induced retrieval was performed by incubating the slides with target retrieval solution (pH 9.0; Dako) for 20 min at 96℃. Endogenous peroxidase activity was blocked with 3% hydrogen peroxide and the slides were then washed with Tris-buffered saline (TBS) for 5 min at room temperature. The tissue sections were next labeled with primary antibodies for 20 min at 20℃. The antibodies were diluted to 1 : 10. The sections were counterstained with Mayer's hematoxylin for 1 min, washed by tapping water, dehydrated in ethanol (increasing concentrations from 50 to 100%), and closed in mounting medium with coverslips. Analysis was carried out with an optical microscope (Axio Imager A1; Carl Zeiss).
Statistical analysis
Normality of the data was determined using a Shapiro-Wilk test while equality of variances was assessed using Levene's test. Differences between the experimental groups were analyzed using parametric (Student's t) or non-parametric (Mann Whitney U) tests. All analyses were performed with STATISTICA 10.0 software for Windows (StatSoft, USA). P values < 0.05 were considered significant.
Results
Clinical characteristics of the ponies
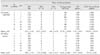
Characteristics of both experimental groups that were established based on clinical data are presented in Table 1. Group A (n = 8) was classified as EMS ponies. This group was characterized by divergent growth rings indicative of chronic laminitis. Ponies from this group were also characterized by high BCS (8.37 ± 051) and CNS (4.0 ± 0.76) values. A standard 95% confidence interval (95% CI) estimated for BSC was 7.92 ~8.82 while that for the CNS was 3.31~4.69. Moreover, horses from group A had a distribution of body fat typical for animals with EMS (i.e., particularly around the tail base, mane, and eyes). All horses from group A had elevated levels of resting insulin (74.75 ± 13.95 mU/mL; 95% CI = 62.29-87.21). Additionally, glucose concentrations did not return to baseline levels within 45 min as represented by positive CGIT results (130.75 ± 10.33 mg/dL; 95% CI = 121.50-140). The mean concentration of LEP was 7.72 ± 0.17 ng/mL (95% CI = 7.57-7.87) and the mean body weight was 325 ± 2.44 kg (95% CI = 322.82-327.17).
Ponies assigned to the control group (B, n = 8) did not show clinical signs of laminitis. The mean BCS value of the control horses was 7.25 ± 0.46 (95% CI = 6.88-7.68) while the mean CNS value was 1.62 ± 0.51 (95% CI = 1.17-2.07). In contrast to animals in group A, the control ponies did not have atypical body fat distribution typical for EMS horses. Ponies from group B had a normal resting insulin concentration (10.25 ± 4.68 mU/mL; 95% CI = 6.07-14.43). CGIT results were negative. Additionally, glucose concentrations decreased to a normal level (73.75 ± 9.61 mg/dL; 95% CI = 65.17-82.33) 45 min after insulin injection. The mean level of serum LEP was 3.97 ± 0.05 ng/mL (95% CI = 3.93-4.02) while the mean body weight was 290 ± 2.39 kg (95% CI = 287.87-292.12).
Adipose tissue histology findings of the EMS ponies and healthy animals
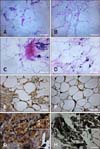
Comparison of adipose tissue samples from EMS ponies and healthy animals showed that tissues from horses in group A were highly infiltrated by macrophages and lymphocytes that were mainly localized in the intercellular space between adipocytes (panel A in Fig. 1). Infiltration of inflammatory cells was not observed in tissue samples from group B (panel B in Fig. 1). Additionally, adipose tissue samples obtained from the EMS group showed signs of fibrosis while samples from the healthy ponies lacked these features.
Distribution of pro-inflammatory cytokines in adipose tissue compared to circulating levels
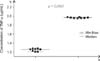
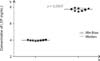
In the adipose tissue samples, both IL-6 and TNF-α were detected with immunohistochemical staining while serum levels of these factors were measured with ELISAs. IL-6 expression was higher in adipocytes from the EMS ponies (panel E in Fig. 1) compared to healthy individuals (panel F in Fig. 1). However, distribution of IL-6 in the tissue samples was similar for both groups. High accumulation of IL-6 was observed around the cell membrane and nuclei of adipocytes. Blood vessels in samples from group A were found to be infiltrated by macrophages and lymphocytes (panel G in Fig. 1). In contrast, no signs of inflammation were observed in the sections derived from group B (panel H in Fig. 1). Analysis of IL-6 concentrations in serum showed that EMS ponies had higher levels of the cytokine (x = 1.905 µg/mL; 95% CI =1.902-1.907). The mean IL-6 concentration of the healthy animals was 1.886 µg/mL (95% CI = 1.884-1.887). These differences were statistically significant (p = 0.0000; Fig. 2). TNF-α levels in adipocytes from EMS and healthy ponies were comparable. The protein was mainly located in the area around adipocyte nuclei (panels C and D in Fig. 1). EMS ponies had high levels of serum TNF-α with a mean concentration of 1.970 µg/mL (95% CI = 1.960-1.980). Healthy ponies had a mean serum TNF-α concentration of 1.250 µg/mL (95% CI = 1.220-1.280; Fig. 3). The observed differences were statistically significant (p = 0.0007).
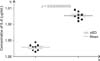
Statistical analysis also revealed differences in serum LEP concentrations (p = 0.0007). The mean LEP level of group A was 7.72 ng/mL. On the other hand, the mean LEP concentration for group B was 3.97 ng/mL (Fig. 4).
Discussion
Obesity is a main symptom of EMS, which is considered to be a very complex disease that is difficult to diagnose [5,7,14]. Another typical feature of this condition is an uneven distribution of adipose tissue, mainly around the base of the tail, eyes, and neck [6]. Methods used by veterinarians to diagnose EMS are designed to confirm or exclude symptoms. The most frequently used method for identifying cases of EMS is the CGIT. Application of this technique, however, constitutes a real threat to animal life. Therefore, there is a great need for establishing more efficient and safe methods that make it possible to diagnose EMS during the very early stage [15].
Adipose tissue not only stores fat, but also plays an important role in metabolic regulation and inflammatory processes. It is known that adipose tissue cells (i.e., adipocytes and macrophages) are a main source of cytokines which are mediators of inflammation [7,29,35]. In our experiment, we observed hypertrophy and macrophages infiltration of adipocytes in the EMS group. These features are also typical for pathological obesity. Our results correspond to those obtained for animal and human experimental models in that the adipocyte size determines the percent of infiltrated macrophages in adipose tissue [31].
We also noticed a higher expression of IL-6 in the subcutaneous adipose tissue from EMS ponies compared to the control group. The role of IL-6 and insulin resistance in cases of obesity is not yet fully understood. However, clinical studies have shown a significant correlation between IL-6 concentrations in peripheral blood, the percentage of body fat, and insulin resistance [27,32]. We postulate that determination of IL-6 concentration in horse serum may be useful for diagnosing EMS. Therefore, the role of IL-6 in EMS pathogenesis requires further detailed investigation.
Several investigators have paid special attention to the importance of TNF-α in the course of metabolic disorders [3,26,33]. Comparison analysis of TNF-α levels in serum from both groups of animals in the present study showed that EMS ponies had significantly increased levels of this cytokine. On the other hand, immunohistochemical analysis revealed that both groups had comparable levels of TNF-α expression in the subcutaneous fat. However, TNF-α is also localized in the visceral fat as previously reported and these deposits may have influenced the elevated serum concentrations of this cytokine [3,11]. The high levels of circulating TNF-α in ponies with EMS in the present study correspond to the values reported by Suagge et al. [28] and Vick et al. [35]. These findings demonstrate that ponies with acute hyperinsulinemia and/or obesity have significantly increased levels of pro-inflammatory cytokines in the plasma.
Taking into account results from the literature and those from the present study, it seems that both adipose tissue and insulin play a significant role in the regulation of TNF-α and IL-6 activity. Furthermore, body weight along with insulin and plasma LEP concentrations in horses have a close relationship [9,34]. Our results demonstrated that LEP concentrations are significantly elevated in serum collected from EMS horses. Molecular and cellular alterations resulting from the activities of TNF-α, IL-6, and LEP affect systemic metabolism of organisms [3,6,7,10]. Therefore, it may be important to determine the correlation between these adipokines for the assessment of animal of health condition and predict the development of EMS.
In conclusion, results from our study showed that IL-6 and TNF-α may be involved in the development of EMS in ponies. The relationship between pro-inflammatory cytokine expression in adipose tissue and serum concentrations of these factors requires further investigation. Future studies on this association may be valuable for not only understanding EMS development, but also for creating efficient and safe diagnostic methods as well as new therapeutic strategies.
 XML Download