

 PDF
PDF ePub
ePub Citation
 Print
Print


Introduction
Diabetes mellitus includes a group of metabolic diseases characterized by high blood glucose levels and insulin deficiency. In particular, type 2 diabetes is associated with insulin deficiency as well as insulin resistance [9,11]. Patients with diabetes are more susceptible to oxidative damage because hyperglycemia lowers endogenous antioxidant levels and facilitates the production of reactive oxygen species (ROS) [36,40]. In addition, hyperglycemia can result in protein modification through the formation of ROS during protein glycation, indicating that oxidative stress is involved in diabetic complications [36,40]. The hippocampus is particularly sensitive to diabetes, and the associated complications can result in degeneration of hippocampal synaptic plasticity and transmission [1,35]. Furthermore, diabetes and associated complications are currently implicated as risk factors for cognitive impairment [24,30].
Zucker diabetic fatty (ZDF, Leprfa/fa) rats are widely used for type 2 diabetes research. These animals are characterized by a genetic mutation in the leptin receptor and increased circulating leptin, glucose, insulin, and lipid levels at 7 weeks of age. ZDF rats show symptoms of overt diabetes starting around 12 weeks of age [8,34]. Diabetes is associated with learning deficits and oxidative imbalances that are reflected in alterations of enzymatic antioxidant defenses in organs and tissues, including the brain [7,19]. The brain is particularly susceptible to oxidative damage because it has a high rate of oxygen consumption, lower levels of antioxidant enzyme activity, and large concentrations of unsaturated fatty acids [12]. ROS attacks unsaturated fatty acids and produce highly reactive products such as malondialdehyde (MDA), 4-hydroxy-2-trans-nonenal, acrolein, and thiobarbituric acid reactive substances (TBARS) [33]. Cu,Zn-superoxide dismutase (SOD1) is the first line of defense of ROS because intracellular concentrations of SOD1 are high (about 1% of the total protein) in the central nervous system [15]. In rats with type 1 diabetes induced by streptozotocin (STZ), ROS reduces SOD1 in the hippocampus [38].
Physical exercise confers a number of benefits, including insulin sensitization [23] and anti-diabetic effects [32]. There are conflicting reports regarding the effects of physical exercise on ROS generation and antioxidant levels in the hippocampus of animals with STZ-induced type 1 diabetes [3,6,14,16,17,25,31,38]. However, to the best of our knowledge, no studies of the effects of physical exercise on lipid peroxidation and antioxidant levels in type 2 diabetic animals have been conducted. Furthermore, most previous investigations have focused on the effects of physical exercise intervention after the development of overt diabetes [3,13,21,32]. In the present study, we investigated the effects of treadmill exercise on lipid peroxidation by MDA and SOD1 in ZDF rats and lean control (ZLC) littermates before the onset of diabetes.
Materials and Methods
Experimental animals
Male and female heterozygous (Leprfa/+) ZDF rats were purchased from Genetic Models (USA) and mated to each other. The animals were housed at 23℃ with 60% humidity and a 12-h light/dark cycle with free access to food and tap water. The rats were fed Purina 5008 rodent diets (7.5% fat) as recommended by Purina (USA). Animal handling and care conformed to guidelines that complied with current international laws and policies (National Institutes of Health [NIH] Guide for the Care and Use of Laboratory Animals, NIH Publication no. 85-23, 1985, revised 1996), and this study was approved by the Institutional Animal Care and Use Committee (IACUC) of Seoul National University (SNU-110316-5). All of the experiments and procedures were designed to minimize the number of animals used and animal suffering.
Genotyping the fa gene and experimental design
Genotyping the fa gene was performed as previously described [13]. To measure the effects of diabetes and/or exercise on SOD1 immunoreactivity, 16 male ZLC or 16 ZDF rats were randomly divided into two groups (n = eight per group): sedentary ZLC (SED-ZLC), exercised ZLC (EX-ZLC), sedentary ZDF (SED-ZDF), and exercised ZDF (EX-ZDF) groups. Running speed and duration were set to correspond to 75% of maximal oxygen uptake as determined according to a protocol by Lawler [29]. At 6 weeks of age, the exercised rats were familiarized with running on a motorized treadmill (Model 1050 LS Exer3/6; Columbus Instruments, USA) for 15 min/day at a rate of 15 m/min for 5 consecutive days [21]. After familiarization, electrical stimulation used to encourage the rats to run was discontinued to avoid pain and stress [21]. For early stage experiments, the rats ran for 1 h/day for 5 consecutive days at 16 m/min for 5 weeks and the speed was then increased to 2 m/min for 2 weeks [21]. The sedentary rats were placed on the treadmill, but did not run, for 1 h/day for 5 consecutive days for 5 weeks. All animals were euthanized at 12 weeks of age.
Blood glucose level analysis and tissue processing
Animals in the SED-ZLC, EX-ZLC, SED-ZDF, and EX-ZDF groups (n = four per group) were anesthetized with 30 mg/kg Zoletil 50 (Virbac, France) and blood samples were taken by cardiac puncture (at 9~11 a.m.) using a 22 G needle (Sigma-Aldrich, USA). Fasting glucose levels were measured using a blood glucose monitor (Ascensia Elite XL Blood Glucose Meter; Bayer, Germany). For histological analysis, the animals were perfused transcardially with 0.1 M phosphate-buffered saline (PBS, pH 7.4) followed by 4% paraformaldehyde in 0.1 M phosphate buffer (PB, pH 7.4) [37]. Brains were removed and post-fixed in the same fixative for 6 h at room temperature [37]. The brain tissues were cryoprotected by incubation overnight with 30% sucrose. Next, the brains were cut into serial sections (30 µm) in the coronal plane using a cryostat (CM 1510; Leica Biosystems, Germany). The sections were collected in six-well plates (SPL Life Sciences, Korea) containing PBS for further processing.
Immunohistochemistry for SOD1
For immunohistochemical analysis, free-floating brain sections were carefully processed under the same conditions. Sections from between -3.00 and -4.08 mm posterior to the bregma were selected for each animal according to the rat brain atlas [22]. Ten sections cut 90 µm apart from each other were sequentially treated with 0.3% hydrogen peroxide (H2O2) in PBS for 30 min and 10% normal goat serum in 0.05 M PBS for 30 min at room temperature. They were then incubated with sheep anti-SOD1 (diluted 1:1,000; Chemicon International, USA) overnight and subsequently exposed to biotinylated rabbit anti-sheep IgG with a streptavidin-peroxidase complex (1: 200; Vector, USA) at room temperature for 2 h as previously described [20]. Antibody binding was visualized by reaction to 3,3'-diaminobenzidine tetrachloride (Sigma-Aldrich. USA) in 0.1 M Tris-HCl buffer (pH 7.2) and mounted on gelatin-coated slides (Sigma-Aldrich) [20]. Finally, the sections were mounted in Canada balsam (Kanto Chemical, Japan) following dehydration [20].
Regions of interest (ROIs) in the hippocampal CA1 region were analyzed using an image analysis system (ImageJ 1.59; National health Institute, USA). Images were calibrated in an array of 512 × 512 pixels corresponding to a tissue area of 140 × 140 µm (40× primary magnification) [21]. Each pixel had a resolution of 256 gray levels. The intensity of SOD1 immunoreactivity was evaluated according to relative optical density (ROD), which was obtained after transformation of the mean gray level using the formula: ROD = log (256/mean gray level) [21]. The background ROD of unlabeled portions was determined and the value was subtracted for correction, yielding high ROD values in the presence of preserved structures and low values after structural loss [21]. NIH Image 1.59 software was used for image analysis. The values obtained from the image analysis were calibrated and demonstrated as a ration of the ROS versus the data from SED-ZLC group.
Measurement of SOD activity
The effects of diabetes and/or exercise on SOD activity in SED-ZLC, EX-ZLC, SED-ZDF, and EX-ZDF rats (n = four in each group) was measured based on the ability of samples of hippocampal homogenates to inhibit the reduction of ferricytochrome c by xanthine/xanthine oxidase as previously described [38]. Briefly, blood was sampled for blood glucose testing as described above and bilateral hippocampi were dissected thereafter using a surgical blade. Hippocampi were homogenized with laboratory high-speed disperser (Sower, China) in 20 mM PBS (pH 7.4) and the homogenate was combined with 5 mM butylated hydroxytoluene. SOD protein was separated by electrophoresis in 10% native polyacrylamide gels and visualized as previously described by Beauchamp and Fridovich [4]. Briefly, the gels were soaked in 2.45 mM nitroblue tetrazolium at room temperature for 15 min, and then in 0.36 mM potassium phosphate buffer containing 28 mM N,N,N',N'-tetramethylethylene diamine (Sigma-Aldrich) with 28 µM riboflavin (Sigma-Aldrich) at pH 7.8 for 30 min. The gels were subsequently exposed to a fluorescence light source until maximum band resolution was achieved.
Measurement of lipid peroxidation
The effects of diabetes and/or exercise on lipid peroxidation in SED-ZLC, EX-ZLC, SED-ZDF, and EX-ZDF rats (n = four in each group) were assessed by measuring MDA formation with a Bioxytech MDA-586 kit (Oxis Biotech, USA). Briefly, hippocampal tissue samples used to measure SOD activity were homogenized and centrifuged at 3,000 × g for 10 min at 4℃ and the supernatant was collected. For each reaction, 10 µL of probucol and 640 µL of diluted R1 reagent (1:3 solution of methanol:N-methyl-2-phenylindole) were added to 50 µL hippocampal supernatant and mixed with 150 µL of 12 N HCl [39]. The reactions were then incubated at 45℃ for 60 min and centrifuged at 10,000 × g for 10 min at 4℃ [39]. The supernatant was collected and MDA formation was assessed by measuring the absorbance at 586 nm using Cary 300 UV/vis spectrophotometer (Agilent Technologies, USA) [39]. MDA data were normalized to the total protein concentration [39].
Results
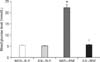
Effects of diabetes and/or exercise on blood glucose levels
The mean blood glucose level of the SED-ZLC rats was 5.37 mmol/L. Blood glucose levels of the EX-ZLC group were slightly lower (5.15 mmol/L) than those of the SED-ZLC group (5.37 mmol/L). SED-ZDF rats (22.3 mmol/L) exhibited significantly higher blood glucose levels than the SED-ZLC rats. The EX-ZDF rats (5.69 mmol/L) had significantly lower blood glucose levels than the SED-ZDF animals (Fig. 1).
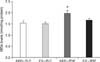
Effects of diabetes and/or exercise on lipid peroxidation levels
The MDA level in hippocampal homogenates obtained from the SED-ZLC rats was 1.53 nmol/mg protein. EX-ZLC rats had similar hippocampal MDA levels compared to those of the SED-ZLC rats. SED-ZDF rats had MDA levels 1.29-fold higher than those of the SED-ZLC rats. MDA concentrations in hippocampal homogenates obtained from the EX-ZDF rats were moderately lower (0.84-fold) than those of the SED-ZDF rats although this difference was not statistically significant (Fig. 2).
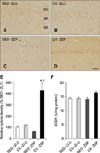
Effects of diabetes and/or exercise on SOD activity and SOD1 immunoreactivity
SOD1 immunoreaction was weakly detected in the neurons located in the stratum pyramidale of the CA1 region of SED-ZLC rats. In addition, strong SOD1 immunoreactivity, but in a limited number neurons, was observed in the stratum oriens of these animals (panel A in Fig. 3). In the EX-ZLC rats, some SOD1-immunoreactive neurons were found in the stratum pyramidale of the CA1 region (panel B in Fig. 3). SOD1 immunoreactivity was slightly higher in the EX-ZLC rats compared to that observed in the EX-ZLC animals (panel E in Fig. 3). In the SED-ZDF rats, SOD1 immunoreactivity was moderately decreased (0.57-fold) in the CA1 region relative to the SED-ZLC rats (panels C and E in Fig. 3). In the EX-ZDF animals, SOD1 immunoreactive neurons were abundantly detected in the stratum pyramidale of the CA1 region (panel D in Fig. 3). SOD1 immunoreactivity was significantly higher (7.51-fold) in the CA1 region of the EX-ZDF rats compared to the SED-ZDF rats (panel E in Fig. 3). However, no significant differences in SOD activity were observed between the groups (panel F in Fig. 3F).
Discussion
ROS are thought to play an important role in the pathogenesis of type 2 diabetes since ROS increase insulin resistance in animal models and humans [5,10,17,26]. However, the exact mechanisms are not clearly understood. In the present study, we observed the effects of diabetes on lipid peroxidation and SOD1 levels in the hippocampus of ZDF rats. In addition, we trained animals before the onset of diabetes to elucidate the effects of exercise on these parameters. For the ZDF rats, running speed and duration were set to 75% of maximal oxygen uptake because exercise can increase aerobic metabolism, leading to increased ROS generation [27,28]. Additionally, 60~80% of maximal oxygen uptake has been suggested as suitable for patients with diabetes [27,28].
In the current investigation, diabetes significantly increased blood glucose levels in the ZDF rats compared to the ZLC rats. Physical exercise prevented increases in blood glucose concentrations in ZDF rats. In addition, diabetes significantly elevated hippocampal MDA levels in the ZDF rats compared to those found in the ZLC rats while no significant differences were observed between the SED-ZLC and EX-ZLC groups. These results are supported by findings from previous studies demonstrating that regular exercise has no significant effect on TBARS levels [2,3]. This suggests that physical exercise alone does not affect lipid peroxidation. However, it was reported that chronic exercise decreases the formation of superoxide radicals in the hippocampus [2]. Similarly, physical exercise moderately reduced lipid peroxidation in hippocampal homogenates obtained from ZDF rats in the present study, although this change was not significant. This finding is supported by data from previous studies showing that diabetes significantly increases lipid peroxidation in the hippocampus [3,38]. In addition, diabetes reduces glutathione levels in the rat brain [14] and decreases superoxide radical formation in the hippocampus [2]. However, these studies used an STZ-induced model of type 1 diabetes.
Regular exercise increases antioxidant enzyme activity [18]. In the present study, we observed that SOD1 immunoreactivity was significantly reduced in the hippocampal CA1 region of the ZDF rats. Furthermore, physical exercise significantly increased SOD1 immunoreactivity in the stratum pyramidale of the ZDF rats although the SOD activity was not altered in all experimental groups. These results suggest that physical exercise has positive effects on SOD1 expression in the hippocampal CA1 region. There are some conflicting data concerning the effects of diabetes on SOD activity in the brain. Hippocampal glutathione peroxidase and SOD1 levels are significantly higher in type 2 diabetic (Otsuka Long-Evans Tokushima Fatty, OLETF) model rats compared to control animals [31]. In contrast, SOD1 and catalase activities are lower in db/db mice than control counterparts [16]. Similarly, a few studies demonstrated that SOD activity in the brain is higher with type 1 diabetes [6,38] although other groups observed a reduction in SOD activity [3,17,25]. Our colleagues demonstrated that SOD1 immunoreactivity is transiently increased 3 weeks after STZ treatment [38]. This discrepancy may be associated with the severity of diabetes in the animals used.
We found that physical exercise during the progression of diabetes increased SOD1 levels in the hippocampal CA1 region. In cases of STZ-induced type 1 diabetes, treadmill exercise training decreases glutathione reductase activity and SOD1 levels although SOD1 mRNA, Mn-SOD protein, and total SOD activity along with catalase mRNA, protein, and activity are unchanged [14]. However, STZ directly and severely damages pancreatic islet cells. Furthermore, the hippocampus is more slowly damaged in cases of type 2 diabetes than type 1 diabetes [24,30,38].
In conclusion, diabetic fatty (ZDF) rats and lean control (ZLC) animals were trained before the onset of diabetes. No changes in blood glucose levels were observed in the SED-ZLC rats. Physical exercise significantly reduced diabetes-induced lipid peroxidation although the level of lipid peroxidation was relatively high compared to the SED-ZLC group. SOD1 levels of the EX-ZDF group were higher than those of the SED-ZDF or EX-ZLC group. These results suggest that physical exercise in a pre-diabetic state significantly ameliorates diabetes-induced lipid peroxidation and reduction of SOD1 levels in the CA1 region of the hippocampus.
 XML Download