

 PDF
PDF ePub
ePub Citation
 Print
Print


Introduction
Dental age estimation has been widely performed in human forensic medicine and wildlife animal research. Age estimation is important for postmortem examination and has been used in human forensic medicine to determine the age of humans who died during large-scale disasters. Hard tissues, such as teeth and bones, are preserved for a long time after the soft tissues have decayed, and serve as useful evidence for personal identification [12]. The pulp cavity volume of teeth gradually decreases with age and this characteristic is known to correlate with the age-associated deposition of dentin [16]. In veterinary medicine studies of wildlife of unknown ages (grey foxes, coyotes, moose, and other species), correlations between chronological age and teeth have been investigated [5,9,14,18]. However, few studies have involved domestic cats. The chronological age of abandoned cats is typically unknown. Therefore, it is not possible for some cat owners to know the age of the abandoned cats they have adopted.
Techniques for estimating dental age estimation are beneficial because teeth are highly resistant to mechanical, chemical, or physical trauma [1,6,8,17]. Teeth are also less affected by hormones, nutrition, and environmental factors compared to other skeletal markers [13]. Although many methods have been evaluated, dental radiography has been generally used to analyze changes of pulp cavity size in human forensic medicine and wildlife animal research [4,5,7,18]. This technique is simple, non-invasive, and suitable for age estimation [3]. The purpose of the present study was to evaluate the correlation between age and pulp cavity/tooth width ratio (P/T ratio) in healthy cats. Additionally, the relationships between P/T ratio, gender, and breed were examined.
Materials and Methods
Animals
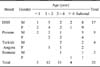
Thirty-two clinically healthy, client-owned cats in Seoul National University (Korea) (16 males and 16 females) were evaluated in this study. The age of all the cats was known and ranged from 6 to 108 months. The clients volunteered for this clinical study and signed a consent form. The breeds of the participating cats were domestic short hair (DSH; n = 17), Persian (n = 9), Turkish angora (n = 4), and Siamese (n = 2). All the cats underwent physical examination and blood testing to rule out any systemic diseases. Cats that had received dental treatment in the past were excluded from the study.
The entire sample population (n = 32) was used to evaluate the correlation between age and P/T ratio in healthy cats. To assess the P/T ratio according to gender and breed, the sample population was reorganized according to age. Eighteen cats were selected and evaluated based on gender (nine males and nine females) and breed (nine DSH and nine Persian). Each subgroup (n = 9) was subdivided based on age: less than 1 year old (n = 2), 1~3 years old (n = 4), and 3~6 years old (n = 3). To reduce statistical error, breeds that were underrepresented in the study population (Turkish Angora and Siamese cats) were excluded from the analysis (Table 1).
Anesthesia
All cats were anesthetized with medetomidine hydrochloride (40 µg/kg, Intramuscular, Domitor; Orion Pharma, Finland) and tiletamine-zolazepam (5 mg/kg, IM, Zoletil; Virbac, France). A half-dose of tiletaminezolazepam was additionally administered when the animals appeared to be recovering from anesthesia.
Radiography
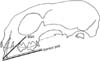
The cats were positioned in a sternal recumbent position for radiography of the maxillary canine teeth. These teeth were chosen for evaluation because of easily access and obdurability due to deep roots compared to other teeth. All dental radiographic images were generated with a digital dental X-ray unit (Dentix; Ardet Dental & Medical Devices, Italy). The digital sensor pad was inserted into the mouth to obtain a rostral maxillary view. The sensor pad was placed between the tongue and maxilla, and beneath the canine tooth root. The cat's head was positioned so that the digital sensor pad was level with a position-indicating device (PID). The PID was positioned perpendicular to the bisecting angle (sensor and long axis of the tooth) as close as possible to the cat's maxilla and over the nose as previously described [10]. The standard exposure setting was 8 mA at 60 kVp for 0.1 sec, and the kVp setting was slightly adjusted according to the radiographic outcomes (Fig. 1).
Measurements
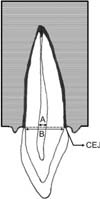
The radiographic images were converted into JPEG files and processed using the Adobe Photoshop CS6 image software (Adobe Systems, USA). Standardized measurements of the canine teeth were made by drawing a line on the radiograph perpendicular to the cemento-enamel junction (CEJ) of the tooth (Fig. 2). The program automatically calculated the pixel volume of the pulp cavity and tooth width using a ruler tool.
Each image file was numbered consecutively from 1 to 32 as part of a blind setup. While analyzing the radiographs, the investigator did not know the chronological age of the cats. To test for reproducibility, all measurements were performed by the same experienced investigator and re-examined after an interval of 2 weeks.
Statistical analysis
Statistical analysis was performed using SPSS Statistics 21.0 software (IBM, USA). To quantify the proportion of variance associated with age according to the P/T ratio, Pearson's squared correlation coefficients were calculated. Linear and curved regression analyses were conducted to identify correlations between age and P/T ratio. The best-fit regression equation was determined by calculating the correlation coefficient (γ2). A Mann-Whitney test was used to compare the mean P/T ratios of the male and female cats. The same method was used to compare the mean P/T ratios of the DSH and Persian cats. P-values less than 0.05 were considered statistically significant.
Results
Reduced P/T ratio associated with increasing age
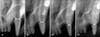
The P/T ratio markedly decreased with age. The ratio was 0.56, 0.27, 0.18, and 0.15 for cats that were 6 months, 12 months, 32 months, and 60 months old, respectively. The calculated P/T ratio of the entire sample population ranged from 0.13 to 0.56 with a mean (± standard deviation [SD]) value of 0.21 ± 0.11 and median of 0.18 (Fig. 3).
Correlation between chronological age and P/T ratio
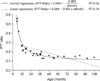
There was strong correlation between age and P/T ratio (linear regression model: y = 0.294 + 0.002x, γ2 = 34; curved regression model: y = 0.094 + 2.463/x, γ2 = 92, p < 0.01, x; month, y; P/T ratio). An inversely proportional correlation was observed in the plot. The curved regression model was definitely more suitable than the linear regression model in this study (Fig. 4).
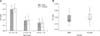
Comparison of P/T ratios for males and females
The mean P/T ratios (± SD) for male cats according to age were 0.40 ± 0.19 (less than 1 year old), 0.19 ± 0.03 (1~3 years old), and 0.15 ± 0.02 (3~6 years old). The mean ratios (± SD) for the female cats according to age were 0.42 ± 0.21 (less than 1 year old), 0.20 ± 0.02 (1~3 years old), and 0.15 ± 0.03 (3~6 years old). P/T ratios of the entire sample population (n = 9) based on gender were 0.22 ± 0.12 for males and 0.23 ± 0.13 for the females. Differences between males and females were not statistically significant (p = 0.66, Fig. 5).
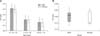
Comparison of P/T ratios for DSH and Persian cats
The mean P/T ratios (± SD) of the DSH cats were 0.41 ± 0.21 (less than 1 year old), 0.21 ± 0.03 (1~3 years old), and 0.16 ± 0.04 (3~6 years old). The mean P/T ratios (± SD) for Persian cats were 0.40 ± 0.19 (less than 1 year old), 0.21 ± 0.03 (1~3 years old), and 0.15 ± 0.01 (3~6 years old). P/T ratios for the entire sample population (n = 9) based on breed were 0.24 ± 0.13 for DSH cats and 0.23 ± 0.13 for the Persians. Differences between the DSH and Persian cats were not statistically significant (p = 0.80, Fig. 6).
Discussion
In the present study, pulp cavity volume of the maxillary canine teeth was measured to estimate the chronological age of cats. Changes of pulp cavity volume are associated with secondary dentin deposition. This type of deposition is a normal morphological alteration associated with aging [16]. The formation of secondary dentin may also be caused by attrition, abrasion, erosion, or changes in osmotic pressure throughout the pulp cavity [11,15]. However, aging is the main reason for secondary dentin deposition in intact teeth. As a result, the pulp cavity volume progressively decreases. Reduction of the pulp cavity volume in intact teeth can therefore serve as a dental age predictor [16].
In human forensic medicine, many studies have demonstrated the correlation between age and P/T ratio measured by radiography. Furthermore, three-dimensional analysis using computed tomography has been performed in recent years [12,16]. Results of regression analysis in humans indicated a general inverse relationship between age and P/T ratio similar to that observed in the current study. However, there are differences between humans and other animals including cats that should be noted. A previous study in coyotes demonstrated that the P/T ratio is rapidly reduced during the first year of life with a marked reduction as the years pass [5]. This rapid reduction of the P/T ratio during the juvenile period has not been observed in humans [2,3,12,16]. Rapid reduction of the P/T ratio during the juvenile period was represented equally in this study. The supposed reason for differences in P/T ratio changes is that humans and animals have different whole-body growth rates during the juvenile period.
In cats, differences between males and females were not significant. This finding is similar to ones from studies on humans and other animals (grey foxes, coyotes, moose) [2,5,12,16]. Moreover, differences between breeds (DSH and Persian cats) were not significant in cats.
Different types of teeth (incisors, canines, and premolars) have been evaluated in previous studies. Slight differences in the correlation coefficients exist among the different types of teeth, but the overall relationships between age and P/T ratio are similar [3,5,16]. In the current investigation, other types of teeth (incisors or premolars) were not assessed, so a comparison between cats and other animals could not be made. In summary, our findings demonstrated that P/T ratio closely correlates with age. Based on our results, determination of age according to P/T ratio could be useful for estimating the chronological age of cats.
 XML Download