

 PDF
PDF ePub
ePub Citation
 Print
Print


Introduction
The bursa of Fabricius is an organ unique to birds. During embryogenesis, stem cells that give rise to B cells enter the bursa of Fabricius [7]. The bloodborne and stromal cells that help create the microenvironment of the bursa orchestrate events leading to B cell differentiation and maturation [7]. The bursa of Fabricius undergoes striking changes in size during development, growing rapidly during late embryogenesis and for several months after hatching before regressing in sexually mature adults [3,8]. Age-dependent alterations of this organ vary largely within the time frame as well as macro- and micro-structural changes among species [3,6]. Growth and involution of the bursa of Fabricius are attributed to many factors including neuropeptides, cytokines, hormones [5,13,29], and the onset of egg production [1].
The B cell developmental process in the bursa of Fabricius includes active proliferation and Ig diversity generated by gene conversion [31,32]. During the maturation process, most developing bursal cells undergo apoptosis [21,22]. Only a minority of the bursal B cells produced daily survives and finally emigrates into the periphery immune organs [15,25].
Cell proliferation and apoptosis not only takes place in the normal bursa of Fabricius but can also be induced by many physiological, chemical, and biological factors. A large body of literature has described the induction of cell proliferation and apoptosis in this organ [10,16,22,23,27,33]. However, mechanisms underlying these processes in normal bursa have been poorly documented. The life cycle of bursal cells from normal and cyclophosphamide-treated chicken at 16 and 20 days embryonic stage have been assessed by flow cytometric analysis [9]. Similarly, Zhang et al. [34] reported that the apoptosis rate of bursal cells of white Leghorns is much higher in 17-day old embryos than 90-day old adults. Higgins [11] performed a transferase-mediated dUTP nick-end labeling (TUNEL) assay revealing that the normal apoptosis of the bursa of Leghorn chicks at neonatal stage is preferentially, but not exclusively, ongoing in bursal follicular cortical cells. Furthermore, Rodríguez-Méndez et al. [29] demonstrated that there is a developmental wave of apoptosis in the bursa of white Leghorns corresponding to a greater abundance of TUNEL signals during the involution stage of this organ. The ultrastructure of lymphocytes undergoing apoptosis in the bursa of Gushi chick has been clarified with transmission electronic microscopy [17]. Li et al. [18] performed flow cytometry and found that the proportion of cells in the G0/G1 phase and proliferating index (PI) change in a wave-like pattern in Gushi chick bursa of Fabricius 1 to 20 weeks after hatching.
Knowledge about cell apoptosis and proliferation in normal bursa of Fabricius has been acquired mainly for chicks and rarely for ducks. Additionally, less is known about the ontogenetic changes associated with apoptosis and proliferation in this organ. The growth and involutive changes in the bursa of Fabricius are also highly variable among different breeds of ducks [6]. Therefore, we measured the normal distribution and proportions of proliferating and apoptotic cells in the bursa of Fabricius from ducks during the embryonic period until the involution stage in order to acquire information for correctly evaluating apoptosis and proliferation patterns associated with immunopathogenesis in ducks.
Materials and Methods
Animals
Tianfu duck embryos (of both genders) and male Tianfu ducks provided by a farm of Sichuan Agricultural University (China) were used in this study. The normal embryonic period of ducks is 28 days. Experiments were carried out using Tianfu ducks on days 24 and 27 of embryogenesis (E24 and E27) as well as days 20, 70, and 200 of postnatal development (P20, P70, and P200). There were five animals in each group. Fertile eggs were incubated at 38.5 ± 0.5℃ with 84 ± 2% relative humidity. The ducks were given water and commercial diet (New Hope Group, China) ad libitum. All animal studies were approved by the Animal Ethics Committee of Sichuan Agricultural University (approval no. 2012-024).
Measurement of absolute and relative weight, length, and width of the bursa of Fabricius
After the body weights were recorded, the animals in each group were euthanized by cervical dislocation and necropsied. The absolute weight of the bursa of Fabricius was recorded for each duck. The relative weight of the bursa was calculated using the following formula:
The length and diameter of the organ were measured by vernier calliper (C101-150M; Xiangyu Science and Technology, China)
Flow cytometry
Cell cycle and apoptosis detection by flow cytometry was carried out using a method similar to that reported by Chen et al. [2]. Briefly, the bursae were cut up and minced using scissors to form a cell suspension that was filtered through a 300-mesh nylon screen (WanKe Company, China). The cells were washed twice with cold PBS (pH 7.2~7.4) and then suspended in 1 × binding buffer (cat. no. 51-66121E; Becton, Dickinson and Company, USA) at a concentration of 1 × 10⁶ cells/mL. The cell suspension was used for annexin-V staining to monitor apoptosis and assess the cell cycle by flow cytometry (BD FACSCalibur; BD Biosciences, USA).
For cell cycle analysis, 500 µL of the cell suspension were transferred to a 5-mL culture tube and centrifuged (200 × g force) at room temperature (25℃) for 5 min. After removing the supernatant, 5 µL 0.25% Tritonx-100 and 5 µL propidium iodide (cat. no. 51-66211E, BD) were added. The cells were gently vortexed and incubated for 30 min at 25℃ in the dark. Finally, 500 µL PBS were added to each tube and the contents were analyzed by flow cytometry within 45 min.
For annexin-V staining, 100 µL of the cell suspension were transferred to 5-mL culture tubes, and 5 µL of annexin V-FITC (fluorescein isothiocyanate, cat. no. 51-65874X; BD Biosciences) with 5 µL of propidium iodide were added. The mixture was gently vortexed and incubated for 15 min at 25℃ in the dark. Next, 400 µL of 1 × binding buffer (cat. no. 51-66121E; Becton, Dickinson and Company, USA) was added to each tube, and flow cytometry was conducted within 1 h.
Histologic staining and immunohistochemistry
The duck bursae at E24, E27, P20, P70 and P200 were collected and fixed by immersion in 4% buffered paraformaldehyde, respectively. After fixation for 24 h at room temperature (25℃), the tissues were dehydrated with alcohol, embedded in paraffin, cut into 5-µm sections with microtome (RM2135; Leica, Germany) and stained with haematoxylin and eosin (NJJCBIO, China) for histological examination. Sections were also collected to perform proliferation cell nuclear antigen (PCNA) immunohistochemistry and a TUNEL assay.
A PCNA assay was carried out in a similar method as reported by Higgins et al. [11]. Briefly, endogenous peroxidase activity was quenched for 10 min in 0.3% H2O2. The sections were then saturated with 5% normal goat sera (Boster Corporation, China) for 20 min at room temperature (25℃) and then incubated with mouse anti-PCNA antibody (Boster Corporation, China) for 17 h at 4℃ (working dilution 1:100). After three successive washings with PBS, the sections were incubated with 1% biotinylated goat anti-mouse IgG (Boster Corporation) and 1% streptavidin-biotin-peroxidase complex (Boster Corporation) for 20 min at 37℃. Antibody binding was visualized with 3'3'-diaminobenzidene (Boster Corporation). The sections were then counterstained with haematoxylin. For the negative control, representative sections were processed in the same way but the primary antibodies were replaced with PBS.
A TUNEL assay was performed with an Apoptosis Detection Kit (Boster Corporation) according to the manufacturer's instructions. Briefly, tissue sections were dewaxed with 100% xylene, and rehydrated in successive changes of 100%, 95%, 85% and 75% ethanol. After endogenous peroxidase activity was quenched for 10 min in 3% H2O2 with distilled water at 37℃, the sections were incubated with proteinase K diluted 1:200 in TBS at 37℃ for 5~10 min in a humidified chamber. A labeling mixture containing digoxin-dUTP in TdT (Terminal deoxynucleotidyl Transferase) enzyme buffer was added to the sections and incubated at 37℃ for 2 h. After three successive washings with TBS for 2 min, sections were covered with anti-digoxin-biotin conjugate diluted 1:100 in blocking regent and incubated for 30 min at 37℃. The tissues were then incubated for 1 h at 37℃ with strept avidin-biotin-complex (SABC) diluted 1:100 in TBS. Labeling was visualized with 3'3'-diaminobenzidene. The sections were then counterstained with haematoxylin. For the negative control, representative sections were processed in the same way but incubation with TdT enzyme buffer was omitted.
Microscopy analysis
Apoptotic lymphocyte density (ALD) in the follicular cortex and medulla was estimated. Microscopic analyses were performed as previously described by Resendes et al. [28]. Briefly, photographs of the follicular cortex and medulla were taken with a digital microscope camera system (Nikon DS-Ri1, Japan) at 400× magnification. For each section, five fields of 0.064 mm2 from each area of the image were analyzed (corresponding to five fields at 400× magnification) using computer-assisted image analysis (Jiangsu Jieda 801 series morphologic analysis system, China). By selecting "dot-chosen target" in the option bar of the morphologic analysis system, positive and negative lymphocytes were first marked one by one in red or green, respectively. Next, "disconnect" in the option bar was selected to separate the overlapped cells. Finally, "calculating" in the option bar was selected to automatically calculate the total numbers of cells marked red or green. The percentage of TUNEL-positive lymphocytes relative to total lymphocytes corresponded to the ALD.
The proliferative lymphocyte density (PLD) in the follicular cortex and medulla was also estimated according to the method described above. However, five fields of 0.001 mm2 from each area were quantified (corresponding approximately to five fields at 1000× magnification). The percentage of PCNA-positive lymphocytes relative to the total number of lymphocytes corresponded to the PLD.
Results
Absolute and relative weight, length, and diameter of the bursa of Fabricius
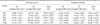
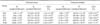
Absolute weight of the bursa of Fabricius increased significantly from E24 to P70 (p < 0.05) and sharply dropped on P200 (p < 0.05; Table 1). The relative weight of the bursa increased from E24 to E27 (p < 0.05), did not significantly change from E27 to P20 (p > 0.05), and significantly decreased from P20 to P200 (p < 0.05; Table 1). The duck bursa of Fabricius was tubular-shaped and the length significantly increased from E24 to P70 (p < 0.05) before sharply decreasing on P200 (p < 0.05; Table 2). The diameter of this organ did not significantly change from E24 to E27 (p > 0.05), significantly increased from E27 to P70 (p < 0.05), and was reduced dramatically on P200 (p < 0.05).
General bursa of Fabricius histology
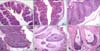
The wall of the bursa on E24 consisted of four basic layers. From the inside outwards these layers were the mucosa, submucosa, muscularis, and serosa. The mucosa with a mucosal epithelium and lamina propria comprised the greater portion of the wall thickness. The mucosa formed two thick, vertical large plicae and several small ones. Numerous lymphoid follicles were located in the tunica propria, some of which exhibited a distinct medulla and cortex (panel A in Fig. 1). The surface epithelium immediately overlying the follicle is called the follicleassociated epithelium (FAE) while the other surface epithelium is known as the interfollicular epithelium (IFE; panel A in Fig. 1). Compared to E24, the bursa of Fabricius on E27 had attained an almost mature histological structure with increased lymphoid follicle size along with a clear medulla and cortex (panel B in Fig. 1). From E27 to P70 (especially on P20), a marked increase in lymphoid follicle size was evident (panels C and D in Fig. 1). Compared to ducks in other age groups, the bursa of Fabricius on P200 exhibited an obviously decreased lymphocytes density, and reduced number and size of lymphoid follicles. In addition, the organ had an increase in fibrous tissue accumulation and large mucoid cysts appeared, indicating that the bursa was in the involution stage (panels E and F in Fig. 1).
PCNA assay
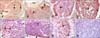
PCNA-specific reactions were mainly observed in lymphocyte nuclei in the lymphoid follicles (panels A-G in Fig. 4). Many cells in the IFE were also positive for PCNA while the FAE was negative (panels A and B in Fig. 4). Decreased numbers of PCNA-positive lymphocytes in the follicular cortex and medulla were observed from E24 to P200 (panels C-G in Fig. 4). Microscopy revealed that the PLD values for the follicular cortex and medulla significantly decreased from E24 to P200 (p < 0.05) with the exception of the value for the follicular cortex on P200 (Table 3). Furthermore, no significant change in the PLD values for the follicular cortex or medulla on E24 to E27 (p < 0.05) was observed, but the PLD value for the follicular cortex was significantly lower than that of the follicular medulla on P20, P70, and P200 (p < 0.05; Table 3). No staining was observed in the control sections (panel H in Fig. 4).
TUNEL assay
TUNEL-positive follicular lymphocytes containing free apoptotic bodies or nuclei with condensed chromatin along with apoptotic bodies in the cytoplasm of macrophages in the follicular cortex and medulla were identified (panel A in Fig.5). TUNEL-positive lymphocytes were mainly observed as single cells scattered within lymphoid follicles (panels A-F in Fig.5). From E24 to P70, only occasional TUNEL-positive cells were seen in the mucosa epithelium (panel A and D in Fig.5) whereas many apoptotic cells were observed in this area on P200 (panel G in Fig.5). Microscopy revealed that the ALD value for the follicular cortex and medulla significantly increased from E24 to P20, dropped on P70 (p < 0.05), and then dramatically rose on P200 (p < 0.05; Table 4). Compared to the follicular medulla, the ALD value for the follicular cortex was significantly lower from E24 to P70, but had not significantly changed on P200 (p < 0.05; Table 4). No staining was detected in the control sections (panel H in Fig.5).
Discussion
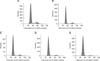
There is extensive cell division in the bursa, particularly during the first few weeks of life during which time the bursa cellularity increases as well as the production of B cells that emigrate to the organ periphery [19]. In the present study, flow cytometry results indicated that the percentage of G0/G1 bursal cells significantly and progressively increased from E24 to P200 whereas the bursal cell population in the S and G2 + M phases along with the PI value obviously decreased from E24 to P200. Furthermore, PCNA-specific immunohistochemistry revealed that the PI value for the bursal follicles markedly and progressively decreased from E24 to P200 with the exception of the PLD value for the follicular cortex on P200. These results indicate that the proliferative cell capacity of the duck bursa of Fabricius declines with increasing age. However, Zhang et al. [34] determined that the PI value for 17-day old embryonic chicken bursa was much lower than that of 90-day old adults. Li et al. [18] also demonstrated that the amount of cells in the G0/G1 phase and PI value for chick bursa changes in a wave-like pattern from 1 to 20 weeks after hatching. These findings are different from those of our study.
In the present investigation, PCNA-positive cells were observed throughout the bursal follicles with a slightly higher number in the medulla from P20 to P70. Previous reports have shown that after hatching, most chick bursal cell proliferation occurs in the cortex of bursal follicles while the medulla contains largely nondividing cells [26,30]. These data disagrees with results from our study.
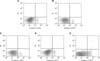
Apoptosis plays a role in embryogenesis, metamorphosis, differentiation, proliferation/homeostasis, and as a defensive mechanism to remove infected, mutated, or damaged cells [20]. Apoptosis may make important contributions to B cell development in the bursa of Fabricius, and promote diversification of the B cell immune repertoire and/or selection of non-self-reactive B cells [21]. In the present study, flow cytometric and TUNEL assays both revealed that the number of apoptotic cells obviously and progressively increased from E24 to P20, dropped on P70, and dramatically rose again on P200. These results indicate that cell apoptosis in normal duck bursa increased with advancing age (except from P20 to P70). Additionally, our TUNEL assay data concur with those from a study by Rodríguez-Méndez et al. [29] who demonstrated that there is a developmental wave of apoptosis in the bursa of white Leghorns associated with a greater abundance of TUNEL signals in both the cortical and medullar parts during the involution stage of this organ.
In the present study, TUNEL-positive cells were found in both the bursal follicular cortex and medulla, indicating that bursal lymphocyte apoptosis can clearly occur in both anatomical locations and closely resembles to that observed in chickens [11]. Furthermore, we found that ALD values for the follicular medulla from E24 to P70 were significantly higher than those for the cortex. Thus, the duck follicular medulla appears to play an important role in B cell development, differentiation, and maturation during these periods.
The mucosal epithelium of the bursa can be classified as the FAE or IFE [12]. The former is different from the latter in both histological structure and function. The cell composition of the FAE is not the same as that of the IFE, which has been demonstrated by staining with monoclonal antibodies [24]. The FAE has marked non-specific esterase activity, and contains many liposomes, pinocytotic vesicles, and abundance of microvilli [30]. It has been generally speculated that the FAE is related to antigen uptake and transfer due to endocytosis of ferritin, carbon, and emulsion particles [30]. However, specific functions of the FAE are not yet fully understood. In the present study, we found that many cells in the IFE were positive for PCNA while the FAE was negative, indicating that the IFE is different from the FAE in terms of cell proliferation.
According to the absolute and relative weights, length, diameter, and histology of the duck bursa of Fabricius, we determined that the bursa grew most rapidly on P20 after hatching and then involuted on P200. The mechanisms that control the growth and involution of the bursa of Fabricius are complex. Some reports on neuropeptides that play important roles in the growth and involution of this organ have been published. Rodríguez-Méndez et al. [29] provided evidence that GH (growth hormone) promotes the viability of bursal cells and has an anti-apoptotic function in the bursa of Fabricius. This group also demonstrated that autocrine/paracrine actions of bursal GH are involved in the differentiation and proliferation of B lymphocytes along with bursal growth and cell survival in embryonic and neonatal chicks. Additionally, diminished GH expression in adults may result in bursal involution. Some pro-opio-melatonocortin-derived peptides (i.e. Adrenocorticotropic Hormone and α-Melanocyte Stimulating Hormone) as well as cytokine-like molecules influence the growth and involution of the organ [5]. Findings from our study showed that there is a reduction in proliferation and elevation in apoptotic activity with age (with the exception of apoptosis occurring from P20 to P70). Thus, our results indicate a possibility that the balance between proliferation and apoptosis in duck bursa of Fabricius may account for bursa development and involution, and the regulation of bursal cell proliferation and apoptosis by neuropeptides may be one of the underlying mechanisms.
Compared to our previous study on cell proliferation and apoptosis in duck thymus [4], we found that these processes in duck bursa of Fabricius are distinct. First, the duck bursa of Fabricius always presented a higher level of proliferation than the thymus, which concurs with findings from a study of chicks by Li et al. [18] but is different from data collected by Zhang et al. [34]. Zhang et al. reported that the proportion of PI in chicken bursa was lower than that in chicken thymus after 17 days in the embryonic stage but higher 90 days after hatching. Secondly, the duck bursa exhibited a higher level of apoptosis at all ages except for P70 than the thymus, confirming and extending the findings of Zhang et al. [34], Motyka and Reynolds [21], and Lampisuo et al. [14] who demonstrated that apoptosis seems to be more extensive within the bursa than in the thymus. Our results also support the speculation made by Motyka and Reynolds [21] that B cells in the bursa may be more prone to apoptosis than T cells in the thymus, but it seems more likely that the extent of apoptosis is related to the higher incidence of proliferating cells in the bursa than the thymus.
In conclusion, results from the present study demonstrate that the balance between proliferation and apoptosis in the duck bursa of Fabricius is altered from the embryonic developmental stage to the involution stage. Proliferation is reduced while apoptosis increases with age (with the exception of apoptosis occurring from P20 to P70). The balance between proliferation and apoptosis in the duck bursa of Fabricius may account for the development and involution of the organ.


 XML Download