

 PDF
PDF ePub
ePub Citation
 Print
Print


Introduction
The somatotropic axis is a key metabolic pathway that influences the transition from late pregnancy to early lactation in dairy cows [5]. This endocrine axis involves pituitary-derived growth hormone (GH), which is released in a pulsatile fashion under the control of two hypothalamic hormones (GH releasing hormone and GH inhibiting hormone). The liver expresses the highest level of GH receptors (GHR), and the binding of GH to its receptor initiates the production of insulin-like growth factor I (IGF-I) [20,21].
During the peripartal period, liver GHR expression decreases in dairy cows along with hepatic IGF-I production while GH concentrations increase due to reduced negative feedback signaling [20,24]. It is well known that the production of GHR transcript, GHR1A, decreases as parturition approaches [20] along with the binding of GH to hepatic GHR [27]. Alterations of the GH-IGF-I system have already been associated with increased occurrence of postpartum metabolic diseases [25,26] and fertility problems [10]. Therefore, basic knowledge of factors or pathways that uncouple the somatotropic axis is crucial for formulating new management strategies (e.g. individual feeding plans) or prophylactic therapies (in order to ensure a balanced uncoupling of the somatotropic axis with e.g. food additives) for high-yield dairy cows during the transition from late pregnancy to early lactation.
It was previously speculated that a reduction of feed intake occurring within the last 3 weeks of pregnancy is not partially or solely responsible for decreased GHR1A mRNA expression in dairy cows [34]. In a previous study, cows from one large-scale dairy farm were fed comparable diets and had significantly different antepartal IGF-I concentrations [24]. These results support the idea that additional factors may block IGF-I production by inhibiting the GHR signal transduction.
Increasing estradiol concentrations have been identified as a potential mechanism for attenuating the GHR signal transduction pathway by inducing the expression of suppressor of cytokine signaling 2 (SOCS2) [15,34], a known negative regulator of the GHR signal transduction pathway. Only a few studies have assessed SOCS2 expression in cattle during the transition period. It was previously demonstrated that cows which were fed "limited" regarding their energy requirements showed higher estradiol concentrations and parallel also have elevated hepatic SOCS2 expression [34]. Furthermore, cows selected for low IGF-I concentrations during late pregnancy were shown to have comparable GHR1A expression levels and produced higher amounts of SOCS2 mRNA [24]. Based on these data, the goals of the present study were to monitor cows selected based on antepartal IGF-I concentrations until spontaneous calving, and evaluate the interrelationships between endocrine endpoints using a structural equation model. Moreover, differences in SOCS2 mRNA expression in cows with high or low antepartal IGF-I concentrations were examined to determine whether IGF-I expression correlates with a physiological increase of estradiol.
Materials and Methods
Cows and selection criteria
From a large-scale dairy farm (1,100 cows) in Wöpel/Siedenlangenbeck, Saxony-Anhalt (Germany), pluriparous German Holstein Friesian cows in the second to third lactation that had already dried off were selected for this study. All procedures involving animals were approved by the German legislation on animal welfare Lower Saxony Federal State Office for Consumer Protection 279 and Food Safety (AZ 33.9-42502-04-09/1696). At the dairy farm, the cows were housed throughout the year in a free-stall barn with rubber mats. The animals were fed a total mixed ration twice a day as previously described by Piechotta et al. [24] automatically by a band-conveyor system and provided with a mineral supply (Deutsche Vilomix Tierernährung, Germany) along with free access to water.
A total of 158 pregnant cows were examined at the farm by a veterinarian between 240 and 255 days after AI to assess posture, locomotion, and general well-being. Blood samples were collected (10 mL from coccygeal vessels). A 3-mL aliquot of blood was immediately subjected to a glutaraldehyde test (Sigma Aldrich, USA) to assess the immunoglobulin status as a rapid estimation of overall health [32]. Cows with a positive test result in ≤ 3 min were excluded from the study. In all other cows with negative glutaraldehyde test results blood samples were collected in tubes containing EDTA and serum tubes from the animals at timepoint of selection on the farm, and daily at the clinic until a spontaneous calving. Serum samples were kept at room temperature (30~60 min) for clotting of the whole blood. Serum as well as plasma samples were subsequently centrifuged (2,000 × g, 15 min, at room temperature) within 120 min after blood sampling. Plasma and serum samples were transported on ice and stored at -20℃ until analysis.
The plasma IGF-I concentrations were measured immediately using a previously described method [24] and cows were selected following a previously established protocol [24]. Due to logistical reasons, two cows were selected during each farm visit as previously described [24]. The selected cows were then transported to the Clinic for Cattle, University of Veterinary Medicine, Hannover, Germany by day 265 after AI at the latest. Based on the IGF-I concentration, a total of 20 cows were selected and divided into two groups: ones with a low IGF-I level (IGF-Ilow; n = 10) and ones with elevated IGF-I concentrations (IGF-Ihigh; n = 10). The cows were housed in tie stalls with straw bedding and had ad libitum access to hay and water. Additionally, the diet was supplemented twice daily with 6 kg of corn silage and 1 kg of concentrate with18% crude protein (concentrate St.Mv.18 III Pell.; ForFarmers Bela, Germany). The cows were examined daily to measure body temperature, heart rate, breathing rate, rumen filling, and food intake. Spontaneous calving was anticipated; therefore, progesterone (P4) levels were measured every day. By the time P4 concentrations decreased to <2 ng/mL, the cows were monitored more closely using a webcam (Logitech, Switzerland) fixed to the stall ceiling.
Blood sampling
From day 266 after AI until the day of parturition (day -1), blood samples were collected once a day during the morning from the coccygeal vein in serum tubes or tubes containing potassium-EDTA as an anticoagulant (SARSTEDT, Germany). Blood samples were also collected 30 min after parturition (day 0). EDTA and serum tubes were centrifuged at room temperature at 2,000 × g for 15 min within 30 min after sampling and stored at -20℃ until analyzed. The serum and plasma samples were ordered retrospectively by the day of calving and the day of selection was defined as day -34 (median of all animals; min = day -27 and max = day -43).
Liver biopsies
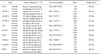
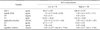
Liver biopsies were taken on day 264 ± 1 after AI (antepartum) and postpartum after the fetal membranes were released (3~9 h after spontaneous calving) to measure the mRNA abundance of specific genes (Table 1). The biopsies were obtained as previously described [24]. Approximately 100 mg of liver tissue was collected, directly transferred to a sterile Eppendorf tube (Eppendorf, Germany), and immediately frozen in liquid nitrogen. The samples were stored at -80℃ until mRNA extraction and PCR analysis.
Measurement of hormone and metabolite levels
IGF-I and GH
The total plasma IGF-I concentration was measured using a commercial IGF-I-specific ELISA (Active IGF-I ELISA; Beckman Coulter, USA) according to the standard operation manual. The analytic sensitivity was 0.03 ng/mL. The intra- and interassay coefficient of variation (CV) were 3.5% and 8.5%, respectively. Bovine GH concentration was determined using an in-house ELISA as previously described [10,31] with modifications described by Piechotta et al. [24]. The GH levels were calculated using Magellan software with a cubic spline modus (Magellan 3.11; Tecan, Germany). Intra- and interassay CV were 9.8% and 12.6%, respectively. The lowest detection limit for GH was 2.0 ng/mL.
Measurement of serum thyroxine (T4), triiodothyronine (T3), insulin, progesterone, 17β-estradiol, and non-esterified fatty acid (NEFA) concentrations
T4 and T3 concentrations were determined every other day starting on the day of parturition using a commercially available competitive chemiluminescence immunoassays according to the manufacturer instructions (thyroxin LKCT5 and LKT35, respectively, IMMULITE 1000 System; Siemens Healthcare Diagnostics, USA). Plasma insulin was measured every second day using an radioimmunoassay (RIA, DSL-1600; Diagnostic Systems Laboratories, USA). Daily serum P4 concentrations were determined using an automated commercially available competitive chemiluminescence immunoassay according to the manufacturer instructions (LKPG1, IMMULITE 1000 System; Siemens Healthcare Diagnostics). Serum 17β-estradiol was quantified every second day using a coat-a-count RIA (Estradiol Coat-A-Count, TKE21; Siemens Medical Solutions Diagnostics, USA) according to the manufacturer's instructions. Serum NEFA levels were measured at the time of selection on the farm, day 266 after AI, and day 0 using a photometric automatic clinical chemistry analyzer (ABX Pentra 400; HORIBA Medical, France). The test specifications were previously described [24].
RNA isolation and quantitative PCR
Total mRNA was extracted from the liver tissue using an RNeasy Mini Kit for animal tissues and cells (Qiagen, The Netherlands) with a QIAcube (Qiagen) according to the manufacturer's instructions. The quality and integrity of the extracted RNA was assessed using an RNA 6000 Nanoassay for an Agilent 2100 Bioanalyzer (Agilent Technologies, USA). The RNA relative integrity number was at least > 7.5. The relative abundance of mRNA in the liver biopsy specimen for quantitative PCR (qPCR) was measured using a BioRad iQ5 (Bio-Rad Laboratories, USA). The PCR reaction contained 0.5 µg total RNA, 10 µL MESA GREEN qPCR MasterMix Plus for SYBR assay (Eurogentec, Germany), and 0.2 µM of each forward and reverse primer (Eurofins Genomics, Germany) specific for the genes of interest (Table 1). The PCR-Cycler (Biometra, Germany) was programmed for the following protocol: denaturation at 95℃ for 15 min followed by 43 cycles of 95℃ for 15 sec, 60℃ for 30 sec, and 72℃ for 30 sec for amplification. The transcripts were visualized using SYBR Green. To generate the melting curve, the temperature was increased by 0.5℃ every 10 sec up to a final temperature of 95℃. Relative mRNA abundance was measured relative to that of two housekeeping genes (RPS9 and GAPDH).
Statistical analyses
SAS (ver. 9.2; SAS Institute, USA) was used to perform the statistical analyses. The data were tested for normal distribution using the Kolmogorov-Smirnov test (n > 90; Proc Univariate normal plot) and Shapiro-Wilk test (n < 90). Data that did not deviate significantly from the normal distribution are presented as the mean ± standard error (SE) or the least-squares means (ls-means) ± SE. All data that were not normally distributed were mathematically transformed. To achieve a normal distribution before parametric statistical analyses were performed, the relative mRNA abundance of GHR1A, diodinase1 (DIO1), and acid labile subunit (ALS) as well as the blood concentrations of GH, IGF-I, T4, T3, insulin, NEFA, and E2 were transformed using a logarithmic natural transformation [logX = log(X)]. IGF-I mRNA values were transformed using the arctangent procedure [atanX = atan(SQRT(X×100))] along with the values for SOCS2 and IGFBP4 [atanX = atan(SQRT(X))]. IGF-I (day -17 to 0) values were transformed using the square-root procedure [sqrtX = sqrt(X)].
Differences between the two groups of cows (IGF-Ilow and IGF-Ihigh) were evaluated using Student's t tests (Proc ttest) and an ANOVA. For data that lacked a normal distribution, statistical analyses were performed using a Kruskal-Wallis test (Proc npar1way). The mRNA data and NEFA plasma concentrations between day -17 and the day of calving (day 0) that were normally distributed were analyzed using an ANOVA (Proc GLM with options lsmeans/pdiff). Significant differences were identified using a repeated measures ANOVA while fixed effects were assessed using a mixed model procedure (Proc Mixed and residual (restricted) maximum likelihood [REML]). The main effects: IGF-I group (treatment: IGF-Ilow and IGF-Ihigh), time (day -17 to 0 calving) and interactions (treatment IGF-I × time) were defined. Additionally, the effects of IGF-I levels on IGF-I, GH, T3, T4, P4, E2, and insulin concentrations were tested as previously described [16,17,18,19].
The Bayesian-Schwarz criterion and Akaike information criterion were used to determine the optimal covariance structure matrix (sqrtIGF-I and T3: spatial power with random effect; logGH: spatial power; logT4: variance components simple structure; logInsulin and P4: first-order autoregressive with random effect and logE2: first-order autoregressive) for the statistical model [16,17]. Due to the unbalanced number of individual data points per IGF-I group, the option Sattherthwaite was applied to obtain the corrected ls-means.
To detect statistical differences between variables, an orthogonal contrast analysis was performed. A univariate procedure was used to assess the residuals for normality, and a Levene test was used to test for homoscedasticity. Relationships between and within parameters were evaluated using the Spearman and Pearson correlation (Proc corr spearman pearson). To control for an unequal sample size, the homogeneity of variance and random effect were first evaluated using a Brown and Forsythe test (Proc GLM with option means hovtest = BF) followed by a Durbin-Watson test (Proc REG options dw). Obvious outliers (n = 5) were removed before performing the final analysis. The prediction equation was determined by a multiple regression analysis using PROC REG with option selection = BACKWARD. For all procedures, p values < 0.05 were considered statistically significant while p values > 0.05 and < 0.10 indicated statistical tendencies.
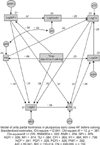
A structural equation model was formulated using the programs AMOS (ver. 18.0; SPSS, USA) and PROC CALIS of SAS (ver. 9.2; SAS Institute) [4]. This model was created to estimate causal relationships among variables using a combination of statistical data and qualitative causal assumptions as described [2,3,4]. The major indices showed a poor fit, indicating that the model structure was not acceptable. However, the centrality and Hoelter's Critical N (CN) showed a good fit. Out of the 18 fit indices that were evaluated, 14 supported the acceptance of the model.
Results
Cows
In total, 158 cows were examined on the farm between 240 and 254 days after AI, and blood samples for IGF-I measurements were drawn from 151 of the animals. The mean IGF-I concentration was 161.4 ± 65.7 ng/mL with a minimum of 46.3 ng/mL and maximum of 450.0 ng/mL. The lower 25% quartile, median, and upper 75% quartile were 109.9, 153.5, and 202.3 ng/mL, respectively. The 20 cows selected for the final evaluation had comparable body weights (661 ± 65 for the IGF-Ilow group versus 607 ± 65 kg for the IGF-Ihigh group) and comparable milk yields during the previous lactation (IGF-Ilow = 7,743 ± 1,265 versus IGF-Ihigh = 7,045 ± 607 kg/305 days). One of the 10 IGF-Ilow cows transported from the farm to the clinic was excluded from the study due to highly aggressive behavior. Spontaneous calving was monitored in 19 cows, and obstetrical assistance (provided by two individuals) was needed by only one cow.
Hormone concentrations on the day of selection of cows for the study
On the day of selection, the cows had significantly different IGF-I plasma concentrations whereas GH levels were comparable. NEFA concentrations tended to be higher in cows with low IGF-I concentrations (p = 0.053) compared to the IGF-Ihigh counterparts. Levels of the other tested metabolic hormones (insulin and thyroid hormones) as well as those of the sexual steroid hormones were comparable between the IGF-Ihigh and IGF-Ilow groups (Table 2).
IGF-I and GH
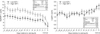
Cows designated as IGF-Ihigh and IGF-Ilow according to IGF-I levels on day 240~254 post-AI (27~43 days before calving) still had significantly different IGF-I concentrations 17 days before calving (p = 0.0063). IGF-I concentrations in both groups significantly decreased from day -17 until the day of calving. In contrast, plasma GH levels significantly increased towards the time of spontaneous calving in both groups, and were comparable on the day of selection and during the 17 days prior to calving (Fig. 1).
Thyroid hormones
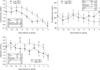
T4 concentrations decreased towards calving in both groups but were significantly higher in the IGF-Ihigh cows. The concentration of T3 remained relatively constant and at similar levels in both IGF-Ihigh and IGF-Ilow cows (Fig. 2)
Insulin
A significant decrease of insulin concentration was observed in both the IGF-Ihigh and IGF-Ilow groups (Fig. 2). A continuous decrease was observed in the IGF-Ilow animals between day -17 and parturition (day 0). In the IGF-1high group, insulin levels remained constant until 2 days before calving (day -3) when they decreased sharply between day 0 and when the samples were taken 30 min after parturition.
Sexual steroid hormones
The 17β-estradiol concentration increased significantly from day -17 (logEstradiol: IGF-I low = 4.5 ± 0.2 versus IGF-Ihigh = 4.2 ± 0.2 pg/mL) to the day of calving (logEstradiol: IGF-I low = 6.8 ± 0.2 versus IGF-Ihigh = 6.4 ± 0.2 pg/mL) in both the IGF-Ihigh and IGF-Ilow groups (p < 0.0001). Cows in the IGF-Ilow group tended to have a higher (p = 0.06) 17β-estradiol concentration (logEstradiol: 5.6 ± 0.2 pg/mL) compared to IGF-Ihigh animals (logEstradiol: 5.2 ± 0.1 pg/mL). Progesterone levels significantly decreased towards the time of calving in both groups (p < 0.0001) and were similar in the two groups (IGF-Ilow = 4.9 ± 0.4 versus IGF-Ihigh = 4.8 ± 0.4 ng/mL; p > 0.05).
NEFA
The mean NEFA concentration 266 days after AI was significantly higher in cows with low IGF-I concentrations (1,147 ± 221 mMol/L) compared to animals in the IGF-Ihigh group (567 ± 118 mMol/L; p < 0.01). On the day of calving, similar observations were made. Cows with low IGF-I levels had significantly higher NEFA concentrations (1,417 ± 207 mMol/L) compared to cows with high IGF-I levels (1,219 ± 137 mMol/L; p < 0.05). In both groups, NEFA concentrations significantly increased towards the time of calving (p < 0.01).
Interrelationship between tested endocrine variables - the structural equation model
The standardized pathway diagram had eight parameters to be estimated with 15 regression weights, one covariance (correlations), and nine variances that were statistically significant (Fig. 3).
Hepatic gene expression
After calving, cows in the IGF-Ihigh group expressed significantly more IGF-I mRNA compared to animals with low IGF-I concentrations. Interestingly, the GHR1A mRNA expression levels in the IGF-Ihigh and IGF-Ilow groups were comparable. GHR1A mRNA expression significantly decreased towards parturition by the same magnitude in both the IGF-Ihigh and IGF-Ilow animals. SOCS2 expression did not appear to vary depending upon IGF-I level or time. The relative abundance of liver DIO-1 expression was significantly higher antepartum than postpartum. Cows in the IGF-Ihigh group had a higher level of DIO1 expression both antepartum and postpartum compared to cows with low IGF-I concentrations. Hepatic expression of IGFBP3 and the ALS decreased significantly towards parturition in both groups (Table 3).
Interactions between IGF-I group, 17 β-estradiol production, and SOCS2 expression
The IGF-I level was not significantly associated with the ante partal or post partal 17β-estradiol concentration or the increase of 17β-estradiol before calving (diffE2, p > 0.05). Additionally, SOCS2 expression was not associated with the IGF-I plasma level.
Discussion
Twenty cows were selected for the present study and divided into two groups based on the levels of IGF-I. Daily blood sampling revealed that IGF-I concentrations remained significantly different until the day of calving. Similar to conclusions made by Kessel et al. [11], it was possible in the present study to select cows obviously showing and an individual variation of the metabolic adaptive ability in the dried off period. Kessel et al. [11]. concluded that cows with a higher post partum concentration of ketone bodies were less able to cope with metabolic stress than normoketonaemic animals. It was previously suggested that measuring metabolic endpoints, like β-hydroxybutyrate, seemed to be a more efficient and sensitive selection criteria to judge the metabolic adaptive capacity of cows compared to a mathematical calculation of energy balance or measuring feed intake and weight loss [33]. Cows of the IGF-Ilow group displayed higher NEFA concentrations compared to the IGF-Ihigh group, but this was only a statistical tendency. Based on this result, it was assumed that cows with markedly lower IGF-I levels had enhanced lipolysis irrespective of diet or housing conditions. Our finding indicated that IGF-I concentration is a suitable metabolic marker of adaptive capacity. However, factors that may causally determine the differences in IGF-I concentrations between the selected cows are not clear.
IGF-I as well as its major binding proteins (IGFBP3 and ALS) are produced in the liver under GH control. However, neither hepatic GHR1A expression nor blood GH concentrations of the IGF-Ihigh and IGF-Ilow groups were different. Similar results were reported by Kobayashi et al. [12] for lactating dairy cows (153~265 days in lactation) fed either restricted or non-restricted diets with different IGF-I concentrations and comparable GHR1A levels. During late pregnancy, however, the GHR1A transcript levels decreased as was also detected in the present study in both groups of cows. Energy deficiency and ghrelin concentrations have been shown to affect the GH peak concentration after re-feeding following a starvation phase during early lactation but not late pregnancy, suggesting that the GH-IGF-I axis might be regulated in a completely different manner during late pregnancy compared to early lactation [6]. Moreover, cows in the present study were fed and housed under comparable conditions, indicating that additional factors regulate total IGF-I and binding protein concentrations antepartum.
The structural equation model revealed that time exerted a significant direct effect on IGF-I concentration, but no other tested hormones seem to directly influence IGF-I levels. However, several direct effects of the IGF-I level on other hormones were detectable. IGF-I concentration directly influenced T4, insulin, and 17β-estradiol levels. It was hypothesized that the selected cows differed in their metabolic adaptive capacity. This fact seemed to be further confirmed by observing a direct effect of IGF-I levels on T4 production. An interaction between the GH-IGF-I system and thyroid hormone levels has been identified [24,30], but less is known about the influence of thyroid hormones on metabolic adaption during late pregnancy. Decreased T4 concentrations detected in the present study have also been reported in the literature [22]. Additionally, a decrease in T3 during early lactation versus late pregnancy (previously described as low T3 syndrome) was observed, and is suspected to result from a phase of chronic catabolism [1,22].
Cows with high IGF-I concentrations showed significantly higher T4 concentration whereas T3 and liver DIO1 mRNA expression in the two groups remained comparable. In both groups of cows, liver DIO1 expression was significantly higher antepartum compared to levels found immediately postpartum. This was reflective of the decreasing T4 concentrations we observed since DIO1 converts T4 into T3. Short-term changes in thyroid hormone production have no major effect on the GH-IGF-I axis [8], but little is known about the impact of different IGF-I levels on thyroid hormones ones. The structural equation model suggested that IGF-I concentration along with E2 and T3 directly affect the T4 concentration while "time" exerts an indirect effect. These parameters might account for 75% of the variance in T4 production. Therefore, differences in T4 concentrations might indicate a diverging adaption of the GH-IGF-I system. This hypothesis is also substantiated by the fact that the thyroid hormone concentrations in the two groups of cows were comparable at the time of selection and started to differ approximately 10 days before calving. Interestingly, T4 had a direct although weak effect on GH concentration, which in turn directly affects T3 generation.
GH directly acts on adipose tissue and enhances lipolysis [13]. However, no difference in GH concentration or GHR1A RNA expression in the liver was detectable between the two groups of cows. As the somatotropic axis uncouples, a decrease in GHR1A mRNA levels and a subsequent decrease in IGF-I concentrations occurs; this induces an increase in GH concentration [20,27]. Hepatic GHR1A mRNA expression and IGF-I concentration decreased in both IGF-Ilow and IGF-Ihigh cows. However, cows with high IGF-I concentrations had significantly higher IGF-I mRNA expression antepartum, but GHR1A transcript levels were comparable between both groups of cows.
In rats and humans, it is known that the somatotropic axis is differentially affected by nutrient deficiency or protein restriction [7]. It has been suggested that protein restriction causes post-GHR resistance, and that low IGF-I concentrations are not caused by reduced GH binding but rather general feed restriction by which IGF-I mRNA and IGF-I blood concentrations are decreased [7,21]. However, the cows in the current study were fed the same diet. In general, it might be more difficult to differentiate between the effects of protein or feed restriction in cows since ruminal fermentation occurs in these animals, and data on the influence of nutrient intake during the peripartal period on IGF-I concentrations are conflicting [28,29,23]. Nevertheless, the finding of very low IGF-I mRNA expression but not corresponding low GHR1A mRNA expression has led to the speculation that post-receptor signaling might be negatively regulated in cows with low IGF-I concentrations [12,24]. Orally administered estrogens, for instance, reduced IGF-I levels in women [9].
A connection between estrogen concentration with attenuation of the post-GH receptor pathways through SOCS2 expression was previously described [14,15]. In the present study, no difference in SOCS2 expression was identified between the two groups of cows. Furthermore, no differences in the relative abundance of SOCS2 mRNA antepartum or postpartum were obvious. These results conflict with those from a study by Winkelman et al. [34] in which SOCS2 mRNA expression increased towards the time of calving. The most pronounced increase of SOCS2 mRNA expression was detected between day -7 and 2 days after parturition [34]. In the present investigation, SOCS2 expression was measured earlier before calving (264 ± 1 after AI) and immediately after calving. Therefore, the missing increase in SOCS2 in the present study could be due to time points of liver biopsy sampling, as estradiol is already low after parturition.
In conclusion, cows selected antepartal during the dry period with different IGF-I levels (IGF-Ihigh versus IGF-Ilow) showed variations in thyroid hormone metabolism. Cows with low IGF-I concentrations expressed low levels of ALS mRNA. This binding protein affects the half-life of IGF-I and might be responsible for the low total IGF-I concentrations that were observed. Even if expression of the ALS is also GH-dependent, the levels of GH and GHR1A transcription were comparable between the IGF-Ihigh and IGF-Ilow groups. 17β-estradiol concentrations were higher in cows with low IGF-I concentrations. In contrast, no differences in mRNA expression of SOCS2 as a negative regulator of GHR signal transduction were observed. Data from the present study indicated that the production of several endocrine factors differed between IGF-Ihigh and IGF-Ilow cows. However, the hypothesis that low IGF-I levels might be associated with enhanced SOCS2 expression could not be confirmed although E2 concentrations measured during the prepartal period differed slightly between the two groups of animals. The level of E2 decreased rapidly after parturition (day 0) and might already be comparable to the sample taken antepartum on day 264 after AI. If the SOCS2-expression occurs fast during high estradiol levels, this study might have missed the exact time as postpartum estradiol is already decreased. Therefore, further studies are needed to determine if SOCS2 expression inhibits GHR signal transduction in the liver of dairy cows during late pregnancy. Low antepartal IGF-I concentrations are already associated with increased occurrence of postpartal metabolic diseases, and the data from the present study clearly demonstrated that IGF-Ilow cows had a higher lipolysis rate indicated by NEFA levels. Thus, cows with reduced IGF-I concentrations should be managed in a different manner compared to ones with high IGF-I levels.

 XML Download