

 PDF
PDF ePub
ePub Citation
 Print
Print


Introduction
In cattle, superovulation (SOV) treatment should allow the production of an optimum number of transferable embryos (TE) capable of establishing pregnancy after transfer, maintaining normal development and resuming pregnancy with the delivery of healthy offspring. Multiple variables constrain SOV success in dairy cattle and reduce the predictability of the number of TE [35]. Variability in ovarian response has been shown to be related to factors such as gonadotrophin preparation, batch and total dose, duration and timing of treatment and the use of additional hormones in the SOV scheme [20]. Factors such as ovarian status and number of small follicles at the time of SOV [4], presence or absence of dominant follicle [17], reproductive history, nutritional status [30] and repeated SOV [2] have also been reported as important sources of variation in SOV response and number of TE.
In cattle, the embryo moves from the oviduct into the uterus 4 days after fertilization and then remains relatively free until implantation, which occurs around day 20 [33]. An adequate uterine environment during these first few days of life is essential to embryo growth and survival [1]. The interaction between the embryo and uterine milk is critical in species such as bovines, in which placentation occurs later [18]. Oviductal and uterine environments directly affect recovered embryo quality after SOV [16]. Thus, an abnormal uterine environment could be considered a determining factor in embryo development and survival, and eventually on the number of TE after SOV treatment.
The present study was conducted to determine the effect of SOV on serum and uterine biochemical parameters, uterine bacteriology and cytology and consequently, to evaluate its association with the number of TE.
Materials and Methods
Animals
Animal care procedures followed the guidelines of the Canadian Council on Animal Care [25], and the protocol was approved by the Animal Care Committee of the Universite de Montreal. A convenient group of 35 clinically healthy Holstein cows was housed indoor with free access to fresh water and fed a total mixed ration diet composed mainly of corn silage, alfalfa/grass silage, corn meal and protein and mineral supplements. Cows were aged between 2 and 6 years with a body condition score ranging from 2.5 to 3.5 according to the scoring system of Edmonson et al. [9]. All cows, SOV and control groups had a normal reproductive examination on transrectal palpation (no ovarian cysts, adhesions or enlarged uterine horns) and ultrasonography (no uterine fluid or edema) and vaginoscopy (no purulent discharge and signs of inflammation).
Experimental design
A group of seven single-ovulated non-lactating dairy cows from the dairy herd of the Université de Montréal was used as a control group. A second group of 28 lactating cows from a dairy farm in Center Quebec, Canada between 80 and 185 days in milk (DIM) and milked twice daily comprised the superovulated (SOV group). All cows were synchronized with two injections of cloprostenol (Estrumate, 500 µg, i.m.; Shering-Plough, Canada) with a 14 day interval (day 21 and 7). Heats (day 0) were observed and recorded. Seven days after the last heat of the designated estrous cycle (day 7), all cows were assigned to low-volume (30 mL) uterine lavage and blood collection. After sampling, cows were given estradiol-17β (3.5 mg, i.m.) and an intravaginal progesterone implant containing 1.39 g of progesterone (CIDR; Pfizer, Canada) was inserted. In the control group, cows received two injections of cloprostenol (500 µg, i.m) at a 12 h interval at day 13 and the vaginal device was removed on day 14. On the afternoon of day 16, GnRH (150 µg, i.m., Cystorelin; Merial, Canada) was administered and cows were inseminated for the first time. The second insemination was performed on the morning of day 17. On DER (day 21), a second low-volume (30 mL) uterine lavage and blood sample were performed. In the SOV group, cows received twice-daily injections of porcine FSH (400 mg, i.m., Folltropin-V; Bioniche Animal Health, Canada) over a 4-day period with decreasing doses (e.g., 80, 80, 50, 50, 40, 40, 20 and 20 mg) starting on day 11. On day 13, cloprostenol (500 µg, i.m., 12 h interval) was administered and the vaginal device was removed on day 14. On the afternoon of day 16 and morning of day 17, cows were inseminated. On DER, a second low-volume (30 mL) uterine lavage and blood sampling was performed before embryo collection.
Embryo recovery
At DER, an epidural anesthesia was administered using 5 mL of Lidocaine Hcl 2% (Bimeda-MTC, Canada). The number of corpus luteum (CL) was estimated prior to collection using an ultrasound scanner (Pie Medical Imaging BV, France) equipped with a 7.5 MHz linear-array transducer. Embryos were recovered from uterine horns using the modified shallow flushing technique described by Sartori et al. [31].
Embryo handling and evaluation
Embryos were identified under a 10× magnification objective using a stereoscopic dissecting microscope and then transferred to a small dish for morphological evaluation (100× magnification) and classified according to the criteria of the International Embryo Transfer Society [28].
Blood sampling
Before uterine lavage, individual blood samples were collected by coccygeal venipuncture into 7 mL tubes without anticoagulants (BD Vacutainer; Becton, Dickinson and Company, USA). The samples were left at 4℃ for 20 min to allow clotting, then centrifuged at 1,500 × g for 15 min at 4℃. Finally, sera were collected and stored at -80℃ until analysis.
Uterine secretion sampling
For both groups, uterine secretion samples corresponded to recovery of the first 30 mL infused volume. Once infused, the solution was left undisturbed in the horn for 1 min before being gently recovered. All recovered fluids (control and SOV groups) were filtered through a minitube filter and then centrifuged at 1,500 × g for 15 min at 4℃. Sediments were subsequently recovered for cytological examination and the supernatants were aliquoted and stored at -80℃ until analysis.
Uterine bacteriology and cytology assessment
Samples of the uterine lavage were subjected to routine bacteriological examination. Bacterial growth density of each species was scored semi-quantitatively by estimating the number of colonies detected on the gel as described by Noakes et al. [23].
Cytological assessment was performed as previously described by Kasimanickam et al. [15]. Briefly, a drop of sediment from uterine lavage was streaked onto a clean slide and air-dried. All slides were then fixed and stained using Diff-Quik stain Kit (Baxter Healthcare, USA). Initially, the entire slide was assessed and representative areas of 10 microscopic fields were selected to determine the percentage of polymorphonuclear neutrophils (% PMN). More than 6% of PMNs identified on the differential cytology count were considered as indicators of subclinical endometritis as previously described [25].
Biochemical analysis
Uterine and blood biochemical analyses were performed in serum and uterine flush samples. Concentrations of glucose (Glu), total protein (TP), sodium (Na), chloride (Cl), potassium (K), lactate dehydrogenase (LDH), creatinine kinase (CK) and urea were analyzed using a Beckman-Synchron DX auto analyzer (Beckman Coulter, USA) with Beckman reagents. Glucose and TP were measured by colorimetric end-point methods. Enzymatic activity of LDH and CK and urea concentration were measured by kinetic-enzymatic methods. Concentrations of Na, K and Cl were measured using ion specific electrodes.
Concentrations of progesterone (P4) and estradiol-17β (E2) were measured on IMMULITE 1000 using immulite reagents (IMMULITE 1000 systems; Siemens, UK).
Concentrations of prostaglandin F2 alpha metabolite (PGFM) were assessed using a 13,14-dihydro-15-keto PGF2α EIA Kit (Cayman Chemical, USA) according to the manufacturer's instructions. The detection limits for serum and uterine flush were 8.53 and 9.94 pg/mL, respectively.
Statistical analysis
Statistical analyses were carried out using SAS (ver. 8.2; SAS Institute, USA). Differences in bacteriology and cytology results at day 7 and DER were identified using Proc FREQ. Wilcoxon non-parametric correlation was used to assess the correlation between uterine bacteriology and cytology and the number of TE. Spearman non-parametric correlation was used to determine the correlation between uterine and serum biochemical parameters and number of TE. The effects of SOV on uterine and serum biochemical parameters were analyzed by repeated measures ANOVA using Proc GLM. The model included the group (control group vs. SOV group) as between-subject factors and time (day 7 vs. DER) as within-subject factors. Mean values of parity, age, DIM, volume of uterine lavage recovered and number of oocytes/embryos were reported with the standard deviation (± SD), while mean values of biochemical parameters were reported with the standard error of the mean (± SEM). A p < 0.05 was considered statistically significant.
Results
The average age, parity and DIM of cows were 4.37 ± 2.32 years, 2.1 ± 1.3 and 135.3 ± 57.4 days, respectively. There was no significant difference in the volume of uterine lavages recovered at day 7 or DER. The amount of uterine lavage recovered ranged from 23.5 to 27 mL with a mean volume of 25 ± 1.15 mL for the two groups. At day 7 and DER, no uterine discharge was observed.
Superovulation response
At DER, cows had an average (± SD) of 12.0 ± 4.6 CLs. A mean of 7.5 ± 6.7 oocytes/embryos was collected, of which 3.4 ± 4.7 were transferable, 0.5 ± 0.9 were degenerated and 3.6 ± 4.3 were non-fertilized oocytes.
Uterine and serum biochemical parameters
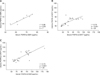
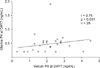
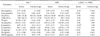
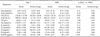
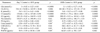
Concentrations of uterine and serum biochemical parameters in the control and SOV groups are presented in Table 1 and 2, respectively. A significant correlation was found between uterine and serum PGFM at DER (r = 0.86, p < 0.05) in the control group (Fig. 1A). In the SOV group, a similar correlation was found at day 7 (r = 0.78, p < 0.001) and DER (r = 0.70, p < 0.001) (Figs. 1B and C). In addition, a significant correlation between uterine and serum P4 at day 7 (r = 0.41, p < 0.05) was found in the SOV group (Fig. 2).
Serum urea and E2 concentrations and uterine Glu, CK, LDH, TP, P4 and PGFM concentrations were significantly higher at DER than day 7 in the control group (Table 1). In the SOV group, there were significantly higher concentrations of serum P4 and PGFM and uterine LDH and PGFM at DER than day 7 (Table 2).
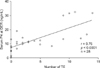
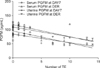
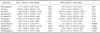
At day 7, the uterine concentrations of Glu, CK and E2 in the SOV group were lower and the concentrations of K and Cl were higher relative to the control group (Table 3). The serum biochemical parameters (Table 4) of the two groups were similar, except for the concentration of K. At DER in the SOV group, uterine concentrations of Glu, CK, urea, LDH, TP, and E2 were lower and concentrations of K, Cl, and PGFM were higher relative to the control group. In the SOV group, serum concentrations of urea, LDH, P4, and PGFM were higher than in the control group. There was a significant positive correlation between the number of TE and serum concentration of P4 at DER (r = 0.76, p < 0.0001) (Fig. 3). Conversely, there were significant negative correlations between the number of TE and serum and uterine concentrations of PGFM at day 7 (r = -0.67, p < 0.001 and r = -0.54, p < 0.005) and DER (r = -0.57, p < 0.002 and r = -0.48, p < 0.01) (Fig. 4).
Uterine bacteriology and cytology
There was no significant change in uterine bacteriology and cytology between day 7 and DER in either group. In the control group, no positive bacteriology was observed at day 7, while one cow was positive (Enterococus spp.) at DER. In the SOV group, 10.7% (n = 3) of the cows were bacteriologically positive at day 7 and DER. Trueperella spp. (n = 2) and Achromobacter xyloxidans (n = 1) were present at day 7, while Trueperella spp. (n = 1), Pseudomonas spp. (n = 2), Pseudomonas aeroginosa (n = 2) and Corynebacterium spp. (n = 1) were present at DER. All cows were negative upon uterine cytological analysis, with a percentage of PMN ranging from 0.9 to 3.1%. There was no significant association between uterine bacteriology or cytology and the number of TE.
Discussion
SOV treatment is associated with higher serum and uterine PGFM concentrations. The concentrations of PGFM at DER were significantly higher than the concentrations at day 7 in both groups. In the control group, the mean uterine and serum PGFM concentrations were lower than those reported by Velez et al. [37], with ranges reaching up to 276 ± 31.6 pg/mL. However, samples were taken much earlier in the postpartum period (29 to 35 DIM) relative to the present study (80 to 185 DIM). The physiological role of PGF2α in the first few weeks after calving is not known; however, serum PGFM (PGF2α metabolite) is known to be substantially more elevated [26] than later in the postpartum period. Following the voluntary waiting period, an increase in PGF2α could be caused by several factors other than SOV treatment, such as manipulation of the reproductive tract [37], nutrition [30], mastitis [12], uterine inflammation or infection [40], and metabolic status associated with lactation [29]. In the present study, all samplings were performed before uterine lavage and manipulations. All cows received the same diet during the experiment, and no evidence of clinical mastitis was observed. The complete reproductive tract examination appeared normal. No evidence of clinical and subclinical endometritis according to the criteria of Dubuc et al. [8] was observed. Furthermore, bacteriological and cytological results revealed no difference between groups and days and no association with the number of TE.
Elevated feed intake and liver function of lactating cows has been associated with a higher metabolic clearance rate of steroids and other metabolic elements such as glucose when compared to non-lactating cows [29]. In the present study, SOV cows were part of a group of donor cows with moderate nutrition and production compared to the rest of the herd, causing them to be on a similar metabolic status as the control. No differences in serum glucose, total protein, estradiol and progesterone concentrations were found between the control and SOV group at day 7. Furthermore, most PGF2α is metabolized in the lung [5]. Increased secretion of PGF2α from the endometrium is possible via an indirect effect of E2 from ovarian follicles on the endometrium [36]. However, serum E2 concentrations did not differ between groups at day 7 and DER. Elevated concentrations of PGFM at DER in the SOV group could be indirectly related to higher concentrations of P4 associated with the presence of multiple CLs on the ovaries. At DER in the SOV group, serum P4 concentration was significantly higher than at day 7, and higher than the concentration at DER for the control group. There was also a positive correlation between serum P4 concentration and the number of TE (Fig. 3), which has also been reported by Lonergan et al. [19]. Elevated P4 enhances the downregulation of its own receptor [6,24] and activates the release of PGF 2α through oxytocin and E2, which increases PGFM concentrations [25] without causing luteolysis. In this study, the mean level of PGFM at DER was lower than 100 pg/mL, whereas it reached over 500 pg/mL during luteolysis in cows [22]. There was no significant difference between groups in uterine P4 concentrations. Finally, the bovine embryo itself could have contributed to the increase in PGFM. Bovine embryos collected 6 to 10 days after mating (morula to hatched blastocyts stages) metabolized arachidonic acid to produce PGE2 [14], which is not converted to PGF2α. Although PGF2α is also produced by the embryo, this only occurs after day 12 [14] and therefore could not explain the increase of PGFM in the present study.
A higher concentration of PGFM in the serum and uterus is associated with a lower amount of recovered TE. This negative correlation is consistent with previous in vivo studies [32,34] in which PGF2α had a detrimental effect on embryonic survival. Schrick et al. [34] showed that a high concentration of PGF2α was negatively correlated with embryo quality. In vitro culture of embryos with PGF 2α reduced pre-compacted and compacted embryos development and decreased hatching [32]. The present association between PGFM concentration in SOV cows and the number of TE in addition to the strong correlation between serum and uterine PGFM concentration at both sampling days indicates the need for further studies to validate serum PGFM concentration as a marker to predict the number of TE in superovulated cows.
The concentrations of urea in the serum and uterine lavage fluid were affected by the SOV treatment. In both compartments, the mean concentrations of urea were significantly higher at DER than day 7 and the DER of the control group. Increased serum urea impaired fertility and embryo growth and survival in dairy cattle because it is associated with low uterine pH and a suboptimal environment for embryo growth and development [27]. However, the level of urea in the present study was still in the normal range [27] and was not associated with the number of TE.
In the uterine lavage fluid, the concentration of TP was higher at DER than day 7; however, no significant difference in serum TP concentration was observed between groups. Chorfi et al. [3] did not observe any association between TP and the number of transferable embryos. In serum, no change of Glu concentration was measured and no correlation was found between the uterine lavage fluid concentration in the SOV group. A lack of correlation between the 2 compartments was previously reported [13]. In uterine lavage fluid of the SOV group, the Glu concentration was much lower at both sampling times relative to the control group. At DER, this may reflect the more important transformation of Glu into pyruvate and lactate by a larger number of embryos present in the uterus of the SOV group. Even though there are conflicting reports [13,21] of the effect of Glu on embryo quality, increased Glu was associated with increased cleavage rate to the blastocyst stage and involved in early embryo energy metabolism [36]. The enzyme LDH plays a role in Glu metabolism, catalyzing the anaerobic conversion of pyruvate to lactate [10,11]. In the present study, uterine LDH concentration was higher in the SOV group at DER than the control group. LDH has been suggested as an indicator of healthier embryos [10].
In terms of uterine infection, three cows had Arcanobacterium pyogenes isolated from the uterus at day 7 and DER, and none of these had embryos recovered at DER. Moreover, there was no correlation between endometrial cytology and the number of TE, suggesting that endometrial cytology with a PMN threshold of 0.9 to 3.1% did not impair survival of the embryos during SOV between 80 and 185 DIM. This is supported by a previous study [8], in which < 6% of PMN on endometrial cytology was not associated with a reduction of fertility. Drillich et al. [7] demonstrated that cows with PMN observed upon endometrial cytology at DER when no PMN were present the day before insemination had a significantly higher number of TE. However, the precise proportion of PMN on endometrial cytology was not presented.
Electrolytes in the uterus regulate enzyme activities, as well as maintain normal pH and embryo development [1]. For the three electrolytes, Na, Cl and K, there was no change in serum concentration after SOV. In the uterus, Cl and K concentrations were significantly higher in SOV than in the control group. An increase of these two electrolytes may promote embryo blastocoel formation [39] and the establishment of tight junctions during blastocyst expansion [38]. However, electrolyte changes were not correlated with the number of TE.
In conclusion, the results of the present study provide reference values for several uterine lavage fluid parameters for the non-SOV group and some indications that SOV leads to changes in uterine and serum PGFM that may consequently affect the number of TE in Holstein dairy cows.
 XML Download