

 PDF
PDF ePub
ePub Citation
 Print
Print


Introduction
The hippocampus is an important integration center for learning and memory [14], and one of the major target areas of glucocorticoids (GCs) in the central nervous system [14,19]. GCs are also essential for maintaining neurons and are hyperglycemic agents that promote diabetes [18,29]. Furthermore, GCs in the blood easily cross the blood-brain barrier and bind to the GC receptor (GR) in the brain [13,27]. GC effects are mediated by ligand-dependent activation of the GR, which is detected in almost every type of cell [21]. Mineralocorticoid receptors (MRs) in the brain are involved in the regulation of stress hormone secretion and complex processes such as ones that control emotions, memory, and sleep [12]. MRs also regulate salt balance and water homeostasis by directly stimulating the expression of specific ionic transporters that are active in the cellular membrane [30]. Although many reports about MR regulation have been published, the exact mechanisms involved in the actions of this receptor remain unknown [2,6]. However, the GR plays critical roles in neuronal regeneration and death as well as learning behaviors, memory, and adaptation within the brain [25,32]. We have previously examined the GR and its involvement in gluconeogenesis along with glucose transport in cases of diabetes [11,16,20].
Chronic stress and prolonged exposure to GCs can damage the hippocampus and induce hippocampal degeneration [36]. The importance of GR-mediated effects is observed with metabolic disorders, particularly diabetes [1,16,26,28,32]. Diabetes is closely associated with increased basal hypothalamo-pituitary-adrenal activity and impaired stress responsiveness [7,8,31]. In addition, activation of the GR was found to modulate the system associated with memory, behavior, anxiety, and fear [27,31,36]. Several reports have been published about GR expression in the hippocampus under diabetic conditions [4,14,15,16,23,28]. However, no study has evaluated GR expression in the hippocampus of animal models with streptozotocin (STZ)-induced type 1 diabetes as it relates to disease development stages. Many researchers have used STZ to induce type 1 diabetes; however, the time and duration of STZ treatment has varied among studies [15,22,24,28,35]. Yi et al. [34] reported that chronological changes in superoxide dismutase activity and inflammatory response in the hippocampus occur 2~4 weeks after STZ administration. Thus, we hypothesized that GR expression in the hippocampus is different based on the time after STZ treatment even though STZ-induced type 1 diabetes develops within a few days after STZ administration. In this study, we therefore assessed GR immunoreactivity and protein level changes in the hippocampus of STZ-treated type 1 diabetic rats 2~4 weeks after STZ injection.
Materials and Methods
Animals and experimental design
Male Wistar rats (n = 40, 7 weeks old) were purchased from OrientBio (Korea). The animals were housed at 23℃ and 60% relative humidity with a 12-h light/dark cycle, and had free access to food and water. The rats were fed a Purina 5008 rodent diet (7.5% fat) as recommended by the manufacturer (Ralston Purina, USA). Animal handling and care procedures adhered to currently accepted guidelines (National Institutes of Health [NIH] Guide for the Care and Use of Laboratory Animals, NIH Publication No. 85-23, 1985, revised 1996) and this study was approved by the Institutional Animal Care and Use Committee of Seoul National University, College of Veterinary Medicine (Seoul, Korea). All experiments were conducted in a manner that minimized the number of animals used and any suffering caused by the procedures.
Type 1 diabetes was induced with a single intra-peritoneal (i.p.) injection of 70 mg/kg/5 mL STZ (Sigma-Aldrich, USA) diluted with 0.1 M sodium citrate buffer (pH 4.3) prior to use. Fasting blood glucose levels were monitored after 72 h, and rats with blood glucose concentrations > 145 mg/dL were divided into three groups. Group 1 was assessed 2 weeks after the STZ injection (STZ2w), group 2 was monitored after 3 weeks (STZ3w), and group 3 was evaluated 4 weeks after the STZ treatment (STZ4w). Control rats received 0.1 M sodium citrate buffer (pH 4.3) in a single i.p. injection as vehicle.
Measurement of body weight, blood glucose levels, food intake, water consumption, and plasma corticosterone levels
Blood was collected weekly from tail veins, and blood glucose levels were measured using a validated one-touch basic glucose measurement system (SureStep blood glucose meter; LifeScan, USA). Body weight was also measured weekly from baseline. Food intake and water consumption of the control and STZ-treated groups were recorded twice a week at 09:00.
Measurement of plasma corticosterone levels
Plasma (50 µL) was added to 5 mL of methylene chloride and incubated at room temperature for 10 min. After filtration through cheesecloth, the mixture was combined with 2.5 mL of fluorescence reagent (7 : 3, sulfuric acid : absolute ethanol), vortexed vigorously, and incubated for 30 min at room temperature. After centrifugation, absorbance of the lower layer was measured using a spectrophotometer (excitation wavelength, 475 nm; emission wavelength, 530 nm, UV-1601; Shimadzu, Japan).
Tissue processing and histological analysis
Five animals from each group (control, STZ2w, STZ3w, and STZ4w) were anesthetized with sodium pentobarbital at designated times and perfused transcardially with 0.1 M phosphate-buffered saline (PBS; pH 7.4) followed by 4% paraformaldehyde in 0.1 M phosphate buffer (pH 7.4). The brains were removed and post-fixed in the same fixative [4% paraformaldehyde in Phosphate buffer (pH7.4)] for 6 h at room temperature. The brain tissues were then cryoprotected by infusion with 30% sucrose overnight, and the frozen tissues were serially sectioned (30-µm thickness) in the coronal plane using a cryostat microtome (Thermo Fisher Scientific, Germany) at -20℃. The sections were then placed into 24-well plates containing PBS.
GR-specific immunohistochemistry
Immunohistochemistry was performed under the same conditions for all groups. The brain sections were treated with 0.3% hydrogen peroxide in PBS for 30 min and then with 10% normal goat serum (Vector Laboratories, USA) in 0.05 M PBS for 30 min at room temperature. The sections were then incubated with rabbit anti-GR antibody (1 : 1,000 dilution, clone M-20; Santa Cruz Biotechnology, USA) overnight at room temperature, and subsequently exposed to biotinylated goat anti-rabbit IgG and streptavidin peroxidase complex (1 : 200 dilution; Vector Laboratories) at room temperature. Antibody binding was visualized by staining with 3,3'-diaminobenzidine in 0.1 M Tris-HCl buffer (pH 7.2). The sections were mounted on gelatin-coated slides and dehydrated. Negative control samples were incubated with pre-immune serum instead of primary antibody to measure immunostaining specificity.
Western blot analysis
Five animals each from the control, STZ2w, STZ3w, and STZ4w groups were sacrificed, and Western blot analysis was performed to confirm changes in GR levels in the hippocampus at each time point. The brains were serially and transversely sectioned (400-µm thickness) with a vibratome (Leica, USA), and the hippocampi were removed using a surgical blade. The hippocampal tissues were homogenized in 50 mM PBS (pH 7.4) containing 0.1 mM ethylene glycol bis (2-aminoethyl ether)-N,N,N',N' (pH 8.0), 0.2% Nonidet P-40, 10 mM ethylendiamine tetra-acetic acid (pH 8.0), 15 mM sodium pyrophosphate, 100 mM β-glycerophosphate, 50 mM NaF, 150 mM NaCl, 2 mM sodium orthovanadate, 1 mM phenylmethylsulfonyl fluoride, and 1 mM dithiothreitol (DTT). After centrifugation, protein levels in supernatants were measured using a Micro BCA Protein Assay kit (Pierce chemical, USA) with bovine serum albumin (Sigma-aldrich) as the standard. Briefly, aliquots containing 80 µg of total protein were boiled in loading buffer containing 150 mM Tris (pH 6.8), 3 mM DTT, 6% sodium dodecyl sulfate, 0.3% bromophenol blue, and 30% glycerol. Aliquots (30 µg) of the protein samples were then loaded onto 10% polyacrylamide gels, and the proteins were transferred onto nitrocellulose membranes (Pall Corporation, USA) after electrophoresis. The membranes were incubated with 5% non-fat dry milk in PBS containing 0.1% Tween 20 for 45 min to reduce non-specific binding and then incubated with rabbit anti-GR (1 : 2,000 dilution; Santa Cruz Biotechnology) overnight at 4oC followed by peroxidase-conjugated goat anti-rabbit IgG (1 : 5,000; Sigma-aldrich) for 2 h at room temperature. Antibody binding was visualized by enhanced chemiluminescence using a kit (Pierce chemical, USA).
Data quantification and statistical analysis
All measurements were performed and analyzed blindly by two researchers per experiment to ensure objectivity. Ten sections per animal were selected to quantitate GR-immunoreactive cells in the hippocampus. The counts were performed using an image analyzing system equipped with a computer-based CCD camera (Optimas 6.5; Cybermetrics, USA). The mean number of GR-immunopositive cells per hippocampus section was determined. The staining intensity of GR-immunoreactive structures was evaluated based on optical density (OD) measured by transforming mean gray levels using the formula: OD = log (256/mean gray level). Background OD levels were subtracted from those of areas adjacent to the regions of interest. OD ratios were then expressed as percentages (relative optical density; ROD) using Adobe Photoshop version CS2 (Adobe Systems, USA) and then analyzed using NIH Image 1.59 software. In addition, the Western blots were scanned, and band intensity was quantified using Scion Image software (Scion Corporation, USA), which was used to determine ROD. The ROD ratio was calibrated as a percentage. Data are presented the mean ± standard error (SE). Differences between mean values were analyzed using a two-way analysis of variance followed by Tukey's test and Duncan's new multiple range method. A p value < 0.05 was considered significant.
Results
Changes in physiological characteristics
Body weight, blood glucose, food intake, and water consumption
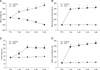
Mean body weight of the STZ-treated rats decreased over the 4-week experimental period whereas that of the controls increased (Fig. 1A). STZ-treated rats had blood glucose levels that were more than 4-times greater than those of the control animals (Fig. 1B). Additionally, the STZ-exposed animals consumed significantly more food (Fig. 1C) and water (Fig. 1D) than the controls.
Plasma corticosterone levels
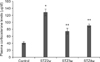
Plasma corticosterone levels of the STZ2w, STZ3w, and STZ4w rats were significantly higher than those of controls. However, these levels were reduced in the STZ3w group compared to those of the STZ2w and STZ4w animals (Fig. 2).
GR immunohistochemistry
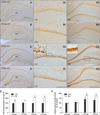
GR-specific immunoreactivity was detected in the hippocampus (CA1 and dentate gyrus; DG) but rarely found in the CA3 hippocampal area. Immunoreactive cell counts in the CA1 of all groups were not significantly different except in the DG of the STZ3w and STZ4w groups (Fig. 3E). However, the intensity of the CA1 cells in each group differed over time (Figs. 3A1, B1, C1, and D1) although the number of immunopositive cells in the CA1 did not vary (Fig. 3E). The numbers and intensities of the immunoreactive cells in the DG were significantly different when comparing the STZ3w group and control animals (Figs. 3E and F). These immunohistochemistry assay results only indicated the general trends in the hippocampal CA1 region and did not reflect quantitative changes. However, the intensity and number of immunopositive cells in the DG region differed among the STZ-treated groups.
Change in GR protein levels
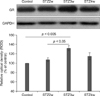
GR protein expression in the hippocampus concurred with the observed changes in immunohistochemical staining intensity (Fig. 4). GR protein levels significantly increased in the STZ3w group (1.32-times higher than that in the control; p < 0.05) and were reduced in the STZ4w animals (1.14-times higher than that in the control). Overall, GR expression levels tended to increase relative to the control.
Discussion
Many studies about GR expression in cases of type 1 diabetes have been conducted [5,10,16,17,24,28]. A chronic excess of GCs can evoke similar to neuropathological signals linked to major targets in the brain [15,24,32]. Excessive stimulation of the GR by STZ can result in compromised neuronal viability and cognitive performance associated with hippocampal function in diabetic animals. Blocking the GR during early type 1 diabetes development attenuates the morphological signs of hippocampal disorders and rescues diabetic animals from cognitive deficits [28]. Therefore, GR expression during this early phase is critically important for preventing STZ-induced hippocampal dysfunction. In the present investigation, we measured GR immunoreactivity and observed expressional differences in the hippocampus of STZ-treated type 1 diabetic rats until 4 weeks after STZ administration. GR immunoreactivity was observed mainly in the CA1 and DG regions of the hippocampus but not in the CA3 region. GR-immunopositive cell counts were significantly different in the DG region but not the CA1 region. However, GR-specific immunostaining intensity in both regions appeared different. We thus measured the signals using an image analyzer (Fig. 3C). The Western blot assay showed that GR protein expression increased continuously and sequentially in the STZ2w and STZ3 groups compared to the control and then decreased thereafter in STZ4w animals (Fig. 4). However, expression levels remained high although the increase was not significant.
Ranhotra and Sharma [24] examined GR expression based on tissue- and age-specific variations in STZ-treated diabetic mice. Revsin et al. [28] reported that excessive GR stimulation compromises neuronal viability and cognitive performance associated with hippocampal function in STZ-treated type 1 diabetic mice. Grillo et al. [14] examined diabetes-mediated plasticity in the hippocampus of STZ-exposed type 1 diabetic rats. However, the time points at which these research groups chose to sacrifice the animals were not the same. Ranhotra and Sharma showed differences in the kidney and liver at two time points (15 and 120 days post-STZ injection); however, they did not show their data collected between these time points [24]. Thus, this group may have ignored changes in body conditions caused by STZ administration. Revsin et al. [28] evaluated changes 6 and 11 days after STZ administration. Grillo et al. [14] examined the animals 1 (short-term diabetic animals) and 5 weeks (long-term diabetic animals) after the development of hyperglycemia. Researchers have considered the effects of short- and long-term STZ exposure times. Nevertheless, they have ignored the effects of STZ injection that could develop over time. GR expression is generally thought to increase in many brain regions under diabetic conditions due to dysregulatory effects in the body regardless of the type of diabetes [14,16,24,32,33]. STZ has been used to induce type 1 diabetes in rodents but researchers have not fully examined the effects of STZ exposure time or dose following administration. If blood glucose levels are reasonably high, many researchers conduct their experiments without considering a timed exposure [14,24,28]. Some discrepancies in the results have therefore occurred [14,24,28]. However, some groups have considered several possibilities when interpreting their experimental results [22,34]. In particular, the possibility that the hippocampal microenvironment could be altered after systemic STZ exposure has been proposed [34], and several microenvironmenal changes in the hippocampus were found 3 weeks after STZ injection. Therefore, we attempted to identify changes in hippocampal GR expression over time (STZ2w, STZ3w, and STZ4w). Yi et al. [34] examined chronological changes in superoxide dismutase 1 (SOD1) activity and inflammatory responses in the hippocampus of STZ-treated type 1 diabetic animals. For this study, assessments were made at three time points (2, 3, and 4 weeks) following STZ administration to rats. Several markers related to oxidative stress and inflammatory responses in the hippocampus were significantly enhanced or reduced 3 weeks after STZ injection versus the controls. Therefore, the 3-week time point was thought to be a very critical period for hippocampal changes following systemic STZ administration. However, it is unclear whether this is attributed to microenvironmental changes due to the length of time after STZ injection. Further study is necessary for clarification.
Basal plasma corticosterone levels are significantly elevated in diabetic rats [3,9]. Hwang et al. [15] reported that GR expression levels in the hippocampus simultaneously increase with elevated plasma corticosterone levels in cases of type 2 diabetes. In the present study, plasma corticosterone levels in the STZ2w, STZ3w, and STZ4w groups were significantly higher than those in the control. However, the plasma corticosterone levels in the STZ3w group were decreased compared to those in the STZ2w and STZ4w groups although they were significantly higher than the levels in the control animals. Since GR expression in the STZ3w group was highest among the time points, physiological factors that influence the relationship between corticosterone and GR expression in the hippocampus should be further investigated. However, we found that GR expression changes were not affected based only on alterations in plasma corticosterone levels if these levels were significantly high. The GR protein levels in the STZ3w to STZ4w groups were not perfectly matched (Figs. 3 and 4), and GR expression in the hippocampus decreased in the STZ3w rats. It should be noted that immunohistochemistry results to calculate quantity are not accurate alone. Therefore, results may not be acceptable when these data are the only evidence for differences in protein levels. The results in Fig. 3. show changes in expression over time. Sections of the hippocampal area used for immunohistochemistry were only some of the ones that were collected. STZ4w GR expression in the hippocampus tended to decrease compared to that of the STZ3w group (Fig. 3). No difference was observed between STZ3w and STZ4w rats (Figs. 3 and 4).
In conclusion, GR expression increased progressively until 3 weeks after STZ injection and decreased thereafter. This may not be a direct effect of corticosterone because levels of this factor remained high after 4 weeks. In addition, we found that the largest difference in hippocampal GR expression after STZ administration compared to that of the control occurred in the STZ3w group. A number of reports have described GR expression in STZ-treated type 1 diabetes animal models [15,24,28,32], However, the times at which the GR is activated post-STZ administration have not been widely examined. We thus measured GR protein expression at three time points following STZ treatment, and found that GR expression was altered over time after STZ exposure. Therefore, we suggest that researchers should consider the time at which animal sacrifice is conducted (the experimental end-point) after STZ treatment to obtain accurate results when measuring GR expression in the hippocampus of STZ-treated animals.
 XML Download