

 PDF
PDF ePub
ePub Citation
 Print
Print


Introduction
Positron emission tomography (PET) is a non-invasive imaging technique used to diagnose neurological and neuropsychiatric disorders. This method facilitates longitudinal studies of various animal models of Alzheimer's disease, cerebral ischemia, depression, epilepsy, Parkinson's disease, and schizophrenia [13]. PET is commonly conducted using 2-deoxy-2-[18F]fluoro-D-glucose (FDG). This compound is a radioactive analogue of glucose and altered FDG uptake indicates metabolic changes of neuronal activity in the brain [6].
Application of FDG-PET in rodents for neuroscience research may be limited by unwanted extracranial accumulation of FDG in the Harderian gland [1,4,5]. Unlike humans, small laboratory rodents have Harderian glands that show strong FDG uptake within the orbit near the frontal region of the brain. The Harderian gland is an irregularly shaped mass within the nictitating membrane [10]. Functional properties of this gland are poorly understood. However, one major secretory product of the gland is porphyrin, which affects photoreception and lubrication of the eyeball [10].
FDG uptake in the Harderian gland varies greatly depending on study conditions prior to PET imaging such as the use of anesthesia during the uptake period [3]. Moreover, other radioactive tracers like 11C-Pib and 18F-fallypride reportedly accumulate in the Harderian gland as well [7,8,9]. This characteristic of the Harderian gland makes it difficult to obtain exact measurements of FDG uptake near the frontal brain region because it is impossible to account for the radioactive spillover coming from the adjacent Harderian gland [1,4,5].
To resolve these problems, surgical procedures for Harderian adenectomy (HA) have been developed for rats but not for mice [1]. Since the mouse brain is significantly smaller compared to rat brain, the additive effect of the Harderian gland on FDG uptake measurement is much greater. However, mice are more susceptible to surgical complications than rats. Thus any procedures developed for HA in mice need to be safe and efficient. The purposes of the present study were to develop a surgical procedure for HA in mice and to assess the effectiveness of this procedure for improving FDG-PET.
Materials and Methods
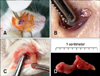
Adult BALB/c mice (22.0 ± 1.9 g; OrientBio, Korea) were used for all experiments. Two mice were used for unilateral HA, and six mice underwent bilateral HA and control operations, respectively. The experimental procedure was approved by the Institutional Animal Care and Use Committee of Konkuk University, Korea. HA was performed in mice anesthetized intraperitoneally with zoletil (90 mg/kg; Virbac, France) and xylazine (10 mg/kg; Bayer, Germany). The whiskers were clipped, and then the conjunctival sac and periocular skin were disinfected with povidone-iodine diluted (1 : 50) in saline. Mice were placed in a lateral recumbent position and the nictitating membrane was pulled toward the lateral canthus using serrated micro-dissecting forceps (Fig. 1A). At the base of the nictitating membrane, the medially protruding, cream-colored Harderian gland could be seen under the thin conjunctival tissue (Fig. 1B). The conjunctival tissue that covered the gland was incised using the tip of a surgical blade. The Harderian gland was then gently drawn out with forceps (Fig. 1C). Once removed, the space between the eye and orbital rim was examined for residual glandular tissue. During the resection procedure, a small amount of bleeding occurred but stopped once slight pressure was applied with a cotton swab. Postoperative care was immediately provided and performed once a day for the next 3 days. Ophthalmic antibiotic ointment (Terramycin; Pfizer, USA) and solcoseryl eye gel (Solcorin; Hanlim Pharm, Korea) were applied for protection against infection and to lubricate the eyes. An analgesic (ketoprofen, 5 mg/kg; UniBiotech, Korea) was also administered subcutaneously daily for 3 days.
The adenectomized mice were subjected to FDG-PET scans on postoperative Days 5, 10, 15, and 30. Prior to scanning, the mice were food-deprived overnight. FDG (300 µCi; Korea Institute of Radiological and Medical Sciences, Korea) was injected via the lateral tail vein while the mice were anesthetized with 2% isoflurane (JW Pharmaceutical, Korea). PET was carried out 60 min after FDG injections were administered. The mice were positioned on the scanning bed, and PET was performed for 20 min in an Inveon PET/CT system (Siemens Healthcare, USA). The acquired PET emission data were reconstructed using a Fourier re-binning algorithm with three span and 31 ring difference, and ordered subsets expectation maximization 2D algorithm with 16 subsets and four iterations. In order to improve the anatomical localization of FDG uptake in the brain, computed tomography (CT) was simultaneously performed. The CT images were acquired with 70 kVp, 500 µA, and 200 msec exposure times for each step (Inveon; Siemens Healthcare). Cone-beam reconstruction was performed with four down-sample factors using bilinear interpolation and Shepp.Logan filters as previously described [2].
In order to demonstrate the influence of the Harderian gland on FDG uptake in specific brain regions, Statistical Parametric Mapping (SPM5; Wellcome Trust Centre for Neuroimaging Institute of Neurology, UK) was used. PET images were realigned to a template image so that the static bounding box could be used to tightly crop the region of interest. All cropped PET images were spatially normalized with a template image. The template image was created from the mean image, which was realigned and provided an average representation of all images. The normalize function determines the transformation that minimizes the differences between two images by minimizing the sum of squares of intensity differences. During normalization, 16 nonlinear warping iterations and trilinear interpolation of the images were performed. To improve normalization accuracy, we used a full affine transformation and nonlinear deformations, which facilitate the correction of subtle differences between subjects. Spatially normalized images were smoothed using a 2 mm Gaussian kernel filter. A two-group t test was designed with relative threshold masking. The threshold was set at 0.8 as a proportion of the global value. Global calculation was performed using standard mean voxel values. Using this method, voxels with values less than 1/8 of the overall mean value were deemed extracranial. For the statistical analysis, we defined t contrast and p value adjustments to the control associated with significantly active regions and rest regions (p < 0.005). In order to compare regional standard uptake values (SUVs) affected by HA, SUV from brain regions including areas of removed Harderian glands, frontal brain and the cerebellum were measured. Then the changes of SUVs of the regions in relation to postoperative time were statistically analyzed using one-way ANOVA and post-hoc analysis (Prism ver. 5.04; GraphPad Software, USA).
When the last PET/CT scan was completed on postoperative Day 30, a visual limb-placing test was performed to evaluate visual acuity and determine if any complication had arisen following the HA. The whisker-clipped mice were lifted by the tail over the wire bar lid of a mouse cage to a height of 20 cm and then lowered onto the lid within a second [11]. Mice with normal vision extended their forelimbs toward the lid before their noses reached it.
Results
The HA mice recovered from surgery without any postoperative complications and the incision site healed without suturing. Mild periorbital edema subsided within 1~2 days. Postoperative physical examinations along with body weight monitoring were carried out. Body weight temporarily decreased after surgery but returned to normal on postoperative Day 4. All adenectomized mice were found to have normal visual acuity according to the visual placing test, indicating there were no surgical complications.
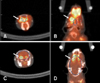
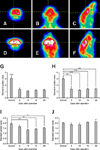
Strong FDG uptake of the Harderian gland was observed in the intact side and radioactive spillover into the brain was also apparent (Fig. 2). This result suggests that excess signals emitted from the Harderian gland interfere with the net measurement of brain FDG uptake, especially in the frontal brain region. Bilateral HA was also carried out to assess the reduction of FDG uptake. Bilateral HA efficiently eliminated extracranial accumulation of FDG in the Harderian gland and subsequent radioactive spillover into the brain (Fig. 3). In particular, PET images of the HA mice showed more defined frontal regions of the brain than those of mice that did not undergo HA.
Analyses of SUVs revealed significant reductions in the regions of Harderian gland and frontal brain (Fig. 3). After bilateral HA, FDG uptake in the regions of the removed Harderian glands was significantly reduced starting on postoperative Day 5 (Figs. 3G and H). The reduction in FDG uptake was approximately 55%, and the left and right Harderian glands both showed similar levels of reduction. SUVs for the frontal brain region decreased significantly from postoperative Day 10 since Harderian gland FDG accumulation was eliminated (Fig. 3I). We also measured SUVs for the cerebellum and the entire brain region but no statistical differences were found (Fig. 3J). These results indicate that the effect of the Harderian gland on FDG-PET analysis was limited to the frontal brain region.
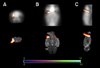
To localize the brain regions affected by Harderian gland FDG uptake, we carried out a statistical analysis using the SPM tool. We were able to obtain parametric maps for mice with intact Harderian glands and the adenectomized animals. When parametric maps were overlaid on a PET template, regions that had significantly high FDG uptake (Fig. 4) were observed. These areas were especially apparent in the Harderian gland and frontal brain regions. Results of the SPM analysis concur with those obtained for manually measured SUVs (Figs. 3G-J).
Discussion
Our study demonstrates that HA in mice is a simple and effective method which enables accurate measurement of FDG uptake in the frontal brain region. We found that the surgical procedure used for rat HA was equally effective in mice [1] although more caution is required for successful surgeries in the latter species. For instance, bleeding must be strictly controlled because blood obstructs views of the limited surgical area that is available in mice. The shape of the resected Harderian glands should be carefully checked to avoid potential tearing during resection. This is because any residual Harderian gland left behind may result in an inaccurate FDG uptake reading along with the additional concern that the gland will regenerate. Moreover, the remaining tissue may cause inflammation that in turn could increase FDG uptake over a short-term period. The simple surgical procedure performed in our study can be carried out by non-veterinarians and should take no more than 5 min. If the surgery is successful, the animal should recover readily without any postsurgical complications including vision impairment.
A limitation associated with FDG-PET scanning is known as the "partial volume effect", which stems from the finite spatial resolution of the images during sampling and reconstruction [12]. A partial volume effect can distort both the contour and signal intensity of images for an actual subject. Due to the partial volume effect, small pieces of tissues that accumulate high level of FDG such as Harderian glands could appear larger than the actual size and obscure images of the brain during PET imaging. Interference attributed to Harderian gland radioactive spillover in the rodent brain has previously been described in rats and mice [1,4,5,7,8,9,14]. The level of Harderian gland FDG uptake is greatly affected by anesthesia [3]. Thus, the adverse effects of Harderian gland FDG uptake are an unavoidable issue since anesthesia is essential for obtaining PET scans of rodents. We found that HA in mice was feasible and had the same effect as it did in rats. After HA, strong FDG uptake signals were excluded from the regions of the gland and distorted FDG-PET images were corrected. It should be pointed out that it took at least 10 days before significant differences in SUVs were achieved.
We were also interested in assessing the range of signal spillover in the brain due to Harderian gland FDG uptake. Using SPM analysis, we were able to demonstrate the additive effect that the Harderian gland has on measuring FDG uptake in the frontal brain region. Our results support a previous finding that FDG uptake by the Harderian gland results in a slight over-estimation of FDG uptake in the frontal lobe of rats [4]. We found that the level of FDG uptake stabilized starting 10 days after the surgery and was maintained for the remainder of the study. This result suggests that the glandular tissue did not regenerate, which is important for long-term experiments.
In conclusion, our results demonstrated that HA in mice can be performed successfully without complications. This was a simple surgical procedure. When performed prior to PET scanning of mice brains, HA may be useful for visualizing the frontal lobe with 18F-FDG micro PET/CT imaging.
 XML Download