

 PDF
PDF ePub
ePub Citation
 Print
Print


Introduction
Recent reports have demonstrated the protective roles of calcium-binding proteins (CaBPs) in response to a variety of conditions that include aging, hyperglycemia, brain ischemia, and depression [9,12,13,15,20,26,30,33]. Among the CaBPs, calbindin D-28K (CB) and parvalbumin (PV) are primarily found in gamma-aminobutyric acid (GABA)ergic neurons in the hippocampus [9,36]. GABA is the most important inhibitory neurotransmitter in the brain and plays a role in various pathophysiological states [30,33]. These GABAergic and CaBP neuronal markers are believed to participate in a variety of functional brain systems and circuitries. CaBPs are assumed to primarily act in calcium buffering and transport, the regulation of different enzymatic systems [14] and ion channels, and synaptic transmission in the nervous system [1,16]. Several studies have shown that blocking calcium entry through either voltage-gated calcium channels or glutamate receptor antagonists protects the brain from various insults [18,31,35].
Type 1 diabetes mellitus is associated with metabolic, neuronal, endocrine, and immune system alterations at the cellular, tissue, and organ levels [34]. Furthermore, rats with streptozotocin (STZ)-induced type 1 diabetes mellitus were reported to develop hyperglycemia with reduced nerve fiber diameter and myelin width in peripheral tissues [21]. Diabetes involves pathophysiological changes in both the brain and body, and affects reciprocal links between the nervous system and many physiological systems [22]. Likewise, this disease may be a stressor and can perturb hypothalamo-pituitary-adrenal (HPA) axis regulation [38,39].
We hypothesized that GABAergic CaBPs (e.g. calbindin D-28K, calretinin and parvalbumin) may play an important role under diabetic conditions. However, few studies of changes in these proteins associated with diabetes, particularly type 1 diabetes, have been conducted. Since chronological alteration of SOD1 activity and inflammatory responses in the hippocampus following STZ administration have been reported [40], we speculated that CaBP expression should be modulated in order to maintain brain homeostasis following an insult. We therefore performed this study to examine hippocampal CB and PV expressions in STZ-treated type 1 diabetic rats at various times after disease onset.
Materials and Methods
Experimental animals
Male Wistar rats were purchased from SLC (Shizuoka, Japan). The animals were 8 weeks old and had body weights between 190 and 240 g. The rats were housed at 22℃ with 55% humidity and an alternating 12-h light/dark cycle, and had free access to normal chow diet and tap water. The care and handling of the animals conformed to guidelines compliant with the National Institutes of Health Guide for the Care and Use of Laboratory Animals, and were approved by the Institutional Animal Care and Use Committee (IACUC) at Seoul National University, College of Veterinary Medicine (Korea). All experiments were conducted to minimize the number of rats used and animal discomfort.
Treatment with STZ
The rats were divided into four groups (10 animals/group). One group was treated with citrate buffer (pH 4.3, vehicle) and the other rats were treated with STZ before being evaluated 2, 3, and 4 weeks after treatment (STZ2w, STZ3w, and STZ4w, respectively). Type 1 diabetes mellitus was induced by a single intra-peritoneal (i.p.) injection of 70 mg/kg/5 mL of freshly prepared STZ (Sigma-Aldrich, USA) in 0.1 M sodium citrate buffer (pH 4.3). The vehicle group received an i.p. injection of the same volume of vehicle. After 72 h, 12-h fasting blood glucose levels were monitored. Rats with blood glucose levels exceeding 8.0 mmol/L were defined as having diabetes and were used for the subsequent experiments (n = five in each group).
Physiological data acquisition
Blood was collected weekly from tail veins and blood glucose levels were measured using a validated one-touch basic glucose measurement system (SureStep blood glucose meter; Lifescan, USA). Body weights were also measured weekly. Food intake and water consumption of the sham controls and STZ-treated groups were recorded at 09:00 twice a week.
Tissue processing for histological studies
Animals (n = five in each group) were anesthetized with an i.p. injection of 30 mg/kg Zoletil 50 (Virbac, France) and transcardially perfused with 0.1 M phosphate-buffered saline (PBS, pH 7.4) followed by 4% paraformaldehyde in 0.1 M PBS (pH 7.4). Brain tissues were cryoprotected by incubation with 30% sucrose in PBS overnight prior to cryosectioning. Serial brain sections (30-µm thick) in the coronal plane were cut using a cryostat (Leica, Germany). The sections were transferred to six-well plates containing PBS for further processing.
Immunohistochemical analysis of CB and PV
The free-floating brain sections were carefully processed under identical conditions. Tissue sections from each animal (n = five per group) were from an area -3.00 and -4.08 mm posterior to the bregma as determined with a rat atlas [28]. The sections were sequentially treated in room temperature with 0.3% hydrogen peroxide (H2O2) in PBS for 30 min and 10% normal goat or rabbit serum in 0.05 M PBS for 30 min. Next, the sections were incubated overnight in mouse anti-CB (1 : 2,000 dilution; Swant, Switzerland), and mouse anti-PV (1 : 5,000 dilution; Swant, Switzerland) antibodies at 4℃, and subsequently exposed to biotinylated goat anti-mouse IgG (1 : 200 dilution; Vector, Burlingame, CA, USA) using an avidin-biotin complex kit (Vector, Burlingame, CA, USA). Antibody binding was visualized with 3, 3'-diaminobenzidine tetrachloride (Sigma-Aldrich, USA) in 0.1 M Tris-HCl buffer (pH 7.2) and mounted on gelatin-coated slides. A negative control test was carried out using pre-immune serum instead of primary antibody to establish immunostaining specificity. No immunoreactivity in any structure was observed in the negative controls.
CB- and PV-positive cells in all groups were assessed using an image analysis system equipped with a computer-based CCD camera and Optimas 6.5 software (CyberMetrics, USA). Cell counts for all of the sections from all rats were averaged. The counts are presented as a percentage relative to the number of cells in the vehicle group.
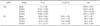
CB-specific immunoreactivity was also graded. The mean intensity of CB immunostaining in each CB-positive structure was measured according to a gray scale system (light-to-dark signal corresponding to 255~0). Based on this technique, the level of immunoreactivity was scored as no staining (gray scale value ≥200), weakly positive (±; gray scale value 150~190), moderate (+; gray scale value 100~149), strong (++; gray scale value 50~99), and very strong (+++, gray scale value ≤50).
Statistical analyses
Data are presented as the mean ± standard error (SE) for each experiment performed. Differences between the groups were statistically analyzed by a one-way analysis of variance followed by Bonferroni post-hoc test and Duncan's new multiple range method. Significant differences indicated (p < 0.05).
Results
Changes in physiological parameters
Body weight
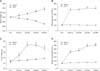
Mean body weight of the vehicle group continuously increased after injection from 299.8 ± 8.54 g at baseline (0 weeks) to 317.3 ± 8.62 g at 1 week, 337.3 ± 7.58 g at 2 weeks, 362.3 ± 5.39 g at 3 weeks, and 390.2 ± 5.99 g at 4 weeks after treatment. In contrast, body weight of the STZ-treated rats fell from 298.8 ± 7.78 g at baseline to 287.3 ± 7.50 g at 1 week, 278.5 ± 8.29 g at 2 weeks, 256.8 ± 8.49 g at 3 weeks, and 226.7 ± 7.94 gat 4 weeks. Mean body weight of the STZ-treated rats was significantly lower than that of the sham control 1 week after treatment and thereafter (*p < 0.005; Fig. 1A).
Blood glucose levels
Blood glucose levels of the vehicle control remained low (<6.1 mmol/L) throughout the experiment. The STZ-treated animals had significantly higher glucose levels (>21.4 mmol/L; p <0.005) throughout the entire experiment. Mean glucose levels of the vehicle group at 0, 1, 2, 3, and 4 weeks after treatment were 6.1 ± 0.29 mmol/L, 5.9 ± 0.22 mmol/L, 5.8 ± 0.12 mmol/L, 5.7 ± 0.26 mmol/L, and 5.7 ± 0.34 mmol/L, respectively, while those of the STZ-treated rats were 5.5 ± 0.52 mmol/L, 21.5 ± 0.58 mmol/L, 21.5 ± 0.58 mmol/L, 23.3 ± 0.56 mmol/L, and 22.8 ± 0.37 mmol/L, respectively (Fig. 1B).
Food intake
Food intake of the vehicle group remained low (< 29.0 g/day) throughout the experiment. However, the STZ-treated rats showed a significant increase (p < 0.005 versus the vehicle group) in food intake that peaked at 2 weeks after STZ treatment. Thereafter, food intake gradually decreased over time. Mean food intake at 0, 1, 2, 3, and 4 weeks after vehicle treatment was 24.1 ± 1.57 g, 24.9 ± 1.44 g, 25.9 ± 1.39 g, 27.2 ± 1.13 g, and 28.8 ± 13.5 g, respectively, while that observed 0, 1, 2, 3, and 4 weeks after STZ treatment was 22.3 ± 1.69 g, 34.2 ± 3.16 g, 53.8 ± 3.79 g, 53.3 ± 3.63 g, and 47.5 ± 3.62 g, respectively (Fig. 1C).
Water consumption
Water consumption of the vehicle group steadily increased throughout the experiment. Water consumption of the STZ group dramatically increased compared to that of the vehicle group. Mean water consumption at 0, 1, 2, 3, and 4 weeks after vehicle treatment was 64.3 ± 4.2 mL/day, 73.7 ± 3.88 mL/day, 77.1 ± 4.1 mL/day, 80.2 ± 4.14 mL/day, and 81.0 ± 4.64 mL/day, respectively, while that of the STZ-treated rats at 0, 1, 2, 3, and 4 weeks was 69.2 ± 2.94 mL/day, 215.3 ± 8.77 mL/day, 234.3 ± 8.09 mL/day, 291.7 ± 11.88 mL/day, and 301.8 ± 12.24 mL/day, respectively (Fig. 1D).
Immunohistochemical assays for CB and PV
Changes in CB
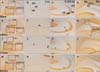
In the vehicle and STZ groups, CB-specific immunoreactivity was mainly observed in the granule cell layer of the dentate gyrus (DG) and mossy fibers (Fig. 2). However, some differences in the localization of CB-positive neurons were observed in these regions when comparing the vehicle and STZ groups. There were few CB-positive cells in the hippocampal CA1 region of the vehicle group (Figs. 2A and B) while STZ treatment significantly increased the number of CB-positive cells in the CA1 region at STZ2w (Figs. 2E and F). However, CB-immunoreactive cell populations in the CA1 region were decreased at STZ3w and STZ4w (Figs. 2I, J, M, and N). In the mossy fibers, CB-specific immunoreactivity in the vehicle group was similar to that at STZ2w (Figs. 2A, C, E and G; Table 1) while CB immunoreactivity at STZ3w and STZ4w was significantly decreased in the mossy fibers compared to that in the vehicle group (Figs. 2I and K; Table 2). In the granule cell layer of the DG, the number of CB-positive cells was significantly decreased by 3 weeks after STZ treatment (Table 1) but increased at 4 weeks (Figs. 2A, D, E, H, I, L, M and P).
Changes in PV
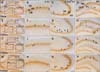
In the vehicle and STZ groups, PV-specific immunoreactivity was mainly detected in the nonpyramidal neurons of the hippocampal CA1-3 region and hilar neurons of the DG. PV-positive fibers were also detected in almost all regions of the hippocampus (Fig. 3). However, some differences in the localization of PV-positive neurons and fibers were noted between the vehicle and STZ groups except in the CA2/CA3 region. In the hippocampal CA1 region, the number of PV-positive neurons was significantly decreased in the STZ groups. No significant differences in the number of PV-positive neurons and fibers of the hippocampal CA2/CA3 region were observed when comparing the vehicle and STZ groups (Figs. 3A, C, E, G, I, K, M and O). In the DG, the number of PV-positive neurons and fibers in the vehicle group were similar to that observed at STZ2w (Figs. 3A, D, E and H) while the numbers of PV-immunoreactive neurons and fibers were significantly decreased at STZ3w compared to those in the vehicle group (Figs. 3I and L). At STZ4w, the numbers of PV-positive neurons and fibers increased in the DG to the level of the vehicle group (Figs. 3M and P).
Discussion
CaBPs are thought to play important roles in the maintenance of calcium homeostasis and protection of neurons against various insults [14]. In the present study, we evaluated the expression of two major CaBPs, CB and PV, in the hippocampus. CB-positive neurons were abundant in the CA1 region of the STZ-treated animals and were significantly increased in number compared to the vehicle group although CB expression declined over time.
Several reports have shown that blocking calcium entry either by regulating voltage-gated calcium channels or using glutamate receptor antagonists protects against ischemia, ischemia-like insults, and depression [10,11,19,29,30,31]. Furthermore, limiting intracellular calcium accumulation by administering various chelators protects neurons against excitotoxicity [32,33]. CaBP overexpression also has neuroprotective effects in neurodegenerative models [37]. These findings suggest that the effective regulation of calcium ion movement is closely associated with neuronal survival. However, few studies have been conducted on CaBP levels in the type 1 diabetic brain.
CB-positive neurons are believed to be associated with memory, learning, and long-term potentiation [25]. CB is present in many double bouquets, bitufted, bipolar, multipolar, and horizontal (Cajal-Retzius) cells [2-7] as well as pyramidal and nonpyramidal neurons in the hippocampus [2,12]. Lee et al. reported that younger gerbils (1 month old) show weaker CB expression in the hippocampal CA1 region compared to older gerbils [17]. In the present study, CB-specific immunoreactivity in CA2/CA3 mossy fibers, granule cell fibers, and the DG gradually decreased; however, expression in the DG was increased at STZ4w.
PV-positive cell counts in all regions except the DG were significantly (p < 0.05) reduced in the STZ-treated rats 2~4 weeks after treatment. The number of PV-positive cells in the DG increased after this period. The CA1 and CA2/CA3 regions appeared to be more affected by STZ over time than the DG. The CB- and PV-positive cell counts in the DG at STZ4w were significantly increased compared to the sham animals. Previous studies demonstrated that CA1 hippocampal neurons are particularly vulnerable to insults while DG cells are notably resistant [1,8]. In the present study, CB-specific immunoreactivity in the DG changed over time with a tendency to become reduced. Although CaBPs play protective roles, these proteins do not protect against cyanide toxicity, and it has also been suggested that the protective effects of CaPBs do not extend to mitochondrial toxins [37].
It has been reported that the number of CB- and PV-positive neurons are significantly increased in the inner nuclear layers of the retina of rats with STZ-induced diabetes [27]. Increased levels of CB and PV in amarcine and bipolar cells may function as buffering reservoirs that maintain calcium homeostasis and protect against the damaging effects of excessive calcium influx during over-excitation. Moreover, several studies have indicated that the CaBPs function, in part, as neuroprotective factors because these proteins are localized within nerve cells that are often less vulnerable to degeneration in patients with Alzheimer's or Parkinson's disease [18,23,24]. Although CB expression in the CA1 gradually decreased from 2 weeks to 4 weeks after STZ treatment, the reason why CB immunoreactivity showed strong signals in CA1 at STZ2w could be that CB activation maintained calcium homeostasis and protected the mechanisms mentioned above.
A recent study reported appreciable changes in Cu levels along with Zn-superoxide dismutase (SOD1), 4-hydroxy-2-nonenal (4-HNE), and microglial activities in rat hippocampus 3 weeks after injection of STZ [40]. Therefore, oxidative stress-related events in the brain of animals with STZ-induced diabetes also seemed to be the most serious and critical at this time point. In the present study, CB and PV expression was reduced 3 weeks after STZ treatment. However, this was restored at 4 weeks in the DG while expression of these proteins in the CA1 and CA2/CA3 were decreased without recovery due to their vulnerability to the STZ toxicity.
In summary, CB and PV expression in the DG was reduced by STZ until 3 weeks after treatment. However, expression of these proteins recovered and increased 4 weeks after treatment. Results from the present study also showed that CB and PV levels were lowest 3 weeks after STZ treatment. Deficits in these proteins at this time point may lead to disturbances in calcium homeostasis.
 XML Download